Abstract
This article presents a feasibility and evaluation study for using 2D ultrasound in conjunction with our statistical deformable bone model within the scope of computer-assisted surgery. The final aim is to provide the surgeon with enhanced 3D visualization for surgical navigation in orthopedic surgery without the need for preoperative CT or MRI scans. We unified our earlier work to combine several automatic methods for statistical bone shape prediction and ultrasound segmentation and calibration to provide the intended rapid and accurate visualization. We compared the use of a tracked digitizing pointer and ultrasound for acquiring landmarks and bone surface points for the estimation of two cast proximal femurs.
Introduction
The use of 3D anatomical models in computer-assisted surgery (CAS) provides the surgeon with image guidance and enhanced visualization to assist navigation and planning. Such models are typically obtained from preoperatively acquired CT or MRI scans, which may not always be available or may not even be necessary if cheaper, radiation-free and/or intra-operative solutions can be provided.
Consequently, intra-operative 3D anatomical visualization can potentially be achieved using an image-free or sparse information approach through the use of statistical shape models. Building a patient-specific anatomical model is a nontrivial challenge given sparse a priori patient anatomical data. Statistical model building consists of establishing legal variations of shape from a training population. The statistical model is then adapted, or fitted, to the patient anatomy using intra-operatively digitized bone surface points. Thus, the aim of statistical shape model fitting is to extrapolate from an extremely sparse set of 3D points a complete and accurate anatomical surface representation.
Surface points are typically acquired by use of a tracked digitizing pointer. In cases of limited surgical access, it can be difficult to acquire a set of points that spans the patient's anatomy sufficiently to ensure accurate shape prediction of a given statistical model. As such, a natural extension is to use ultrasound imaging for noninvasive intra-operative digitization of surface points. The use of ultrasound in CAS is a subject that has been broached by several scientists. Chan et al. Citation[1] and Lavallée et al. Citation[2] have explored methods using ultrasound to instantiate 3D deformable bone models without the need for preoperative CT or MRI scans. We present here our first experiences using our method for automatic segmentation of 2D B-mode ultrasound contours Citation[3], concurrently with our 3D bone deformation method Citation[4], to provide rapid, automatic intra-operative visualization for navigation and planning in minimally invasive orthopedic surgery.
Methods
Statistical model construction
The first step is to build a statistical shape model from a training database. The basic idea is to compute the mean shape and to establish from the training set the pattern of legal variations in the shapes for a given class of images. This is achieved using principal component analysis (PCA). PCA finds a new orthonormal basis for the training set such that the axes are oriented along directions in which the data has its highest variance. PCA-based statistical shape models were introduced by Cootes et al. Citation[5] to establish point distribution models (PDMs).
As potential clinical applications include hip and knee surgeries, we began by concentrating on the proximal femur. Prior work involving our method used a database of 14 bones Citation[4]. We continue to expand our training population, and for the experiments described here the database consisted of a set of 30 CT scans of the proximal femur. The CT data sets were segmented, and surface models of the bones extracted, for the statistical model construction. Dense correspondence between points on the surface of the bones in the training database was initialized with a semiautomatic landmark-driven method and then optimized using the Minimum Description Length criterion Citation[6] to construct a compact optimal model.
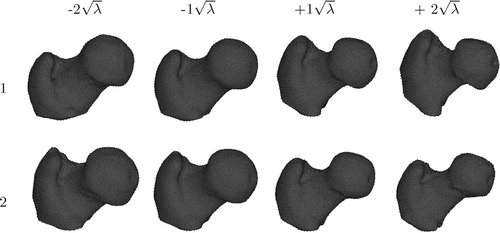
The statistical shape model is constructed based on the established point correspondences. Each member of the training population is described as an individual vector containing all 3D point coordinates. The mean vector and the covariance matrix are next computed from the set of object vectors. The sorted eigenvalues and corresponding eigenvectors of the covariance matrix are the principal directions spanning a shape space, with the mean shape representing its origin Citation[5]. shows the variability captured by the first two modes of variation of our proximal femur model varied by ± 2 standard deviations.
Figure 1. The first two eigen modes of variation of our proximal femur model. The shape instances were generated by evaluating with
.
Model deformation algorithm
The aim of this step is to recover the patient-specific 3D shape of the anatomy from the few available digitized landmarks and surface points. The key factor is the observation that objects in our shape space, and according to our hypothesis the patient's 3D shape, can be described as the mean shape plus a weighted linear combination of eigenvectors. The problem is therefore formulated as estimating the weights for this unknown shape, such that the errors between the reconstructed model and the cloud of digitized surface points are minimized.
Our model fitting algorithm is formulated as a linear equation system with additional regularization terms, and computes a Mahalanobis distance weighted least square fit of the model to the 3D data Citation[7]. The Mahalanobis distance term enables stable prediction with a minimal number of known surface points. Where Fleute and Lavallée Citation[8] and Chan et al. Citation[9] consider a truncated set, we include the complete set of eigenvectors, or shape variations, without an exorbitant increase in the computation time. The objective function that we minimize is defined as follows:
The first term in the function is the Euclidean distance between the N digitized points Y and the estimated shape comprising the mean X plus a weighted sum of the eigenvectors pi. The second term is the Mahalanobis distance of the predicted shape from the mean and controls the probability of the predicted shape. This term ensures that the predicted shapes are valid by favoring those that are closer to the mean. ρ is dynamically adapted as additional points are digitized, thereby relaxing the Mahalanobis distance term and enabling better convergence behavior. M-estimator-based weights wk help to effectively reject outliers Citation[10].
The shape parameters αi are estimated such that both terms are simultaneously minimized. The function f is differentiated with respect to the shape parameters and equated to zero. This results in a linear system of m unknowns, which is solved using QR decomposition.
We evaluated our statistical model deformation through leave-one-out tests and obtained acceptable predictions (mean surface error < 2.5 mm) for the database of 14 proximal femur scans Citation[4].
Calibration and automatic segmentation of ultrasound
To initialize as well as provide surface points for our bone deformation method, we used bone surface contours extracted from the image planes of the tracked 2D B-mode probe of a Kontron Sigma 330© standard diagnostic ultrasound system.
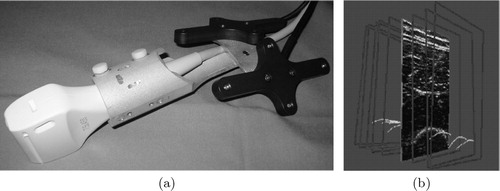
The ultrasound probe was fitted to a dynamic reference base (DRB), allowing for accurate tracking (). The necessary ultrasound calibration step ensures that the coordinates of the imaging plane are known with respect to the anatomy in question, which also bears a DRB. Calibration was achievable in < 5 min, using a minimum of ultrasound images, and has a high reported accuracy Citation[3]. Where Chan et al. Citation[1] manually segment bone contours from ultrasound images, the bone contours used in our experiment were automatically segmented, thereby yielding a cloud of points in the coordinate space of the anatomy (). This automatic segmentation approach requires an average of 0.8 s of computation for each ultrasound image frame and has a mean accuracy of 0.42 mm Citation[11].
Figure 2. (a) The DRB attached to the ultrasound probe. (b) Automatically segmented bone contours in anatomical space.
Experimental setup
Two statistical models were built: one using all 30 CT scans (large) and another one using a subset of 14 scans (small). This was done to study the effect of population size on shape prediction and will be further addressed in the results section. The shape prediction algorithm requires initialization via three landmark points (the lesser trochanter, femoral notch and greater trochanter), and the predicted shape is consequently refined from subsequent surface points.
Using two different plastic cast proximal femurs, their CT surface models were registered into the anatomy's coordinate space using an in-house optical-tracking navigation system, yielding a registration error of 0.2 mm for this experiment. The registered surface models were considered as ‘gold’ references, used for error measurements (computed with Mesh Citation[12]) of the predicted bone models.
Ultrasound bone contours provided the three anatomical landmarks and surface points for bone model deformation. The result was a predicted model in the anatomy's coordinate space. To provide a comparison of performance, a tracked calibrated pointer was used in parallel to digitize 24–26 points for the bone deformation method.
To obtain stable estimates of the errors and an initial impression of the repeatability of our proposed method, two different research scientists each performed a series of five to six trials per bone.
CT-based error
Let the CT-based error be defined as a lower-bound measure of accuracy, given a training population for the bone shape prediction method used here. The CT-based error for each cast bone was obtained by first initializing the bone deformation algorithm with ideal localization of the three landmarks from the 3D bone surface model of the CT. Following this step, additional surface points that span the object sufficiently were input to our shape prediction method. The result was a bone shape prediction in the CT coordinate space, which provided a prediction error that was isolated, in the sense that there was minimum human error and no tracking, segmentation, registration or calibration errors. In this scenario, if all surface points from the CT surface models were used for the deformation, then the error would converge to the minimum prediction error for a given shape with respect to the model training population. Therefore, the CT-based error for each bone was obtained for an equivalent number of surface points, as in the experimental trials to establish a ‘fair’ error reference.
Results
The results in and show the mean and median surface errors for the predicted shapes with respect to the ‘gold’ references for each bone, using 24–26 digitized surface points for each of the two methods described in this article. They also include averaged mean and median surface errors for each scenario to help gauge the repeatability of each experiment. We will use the terms mean error and median error to refer to mean surface error and median surface error, respectively.
Table I. Error statistics of predicted shapes for Bone 1.
Table II. Error statistics of predicted shapes for Bone 2.
Effects due to training population size
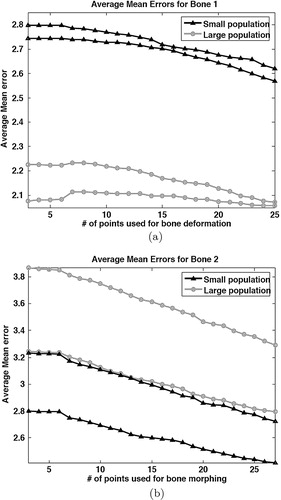
The results for all the pointer-based trials can be seen in , which shows the averaged mean error plots for each user and for the two training populations with respect to the number of digitized surface points. It can be seen immediately from this result that Bone 1 was better estimated with the large training population, whereas the converse was true for Bone 2. The trend was observed for all the experimental setups, including the CT-based error scenario. It should be noted that the error differences with respect to different training population sizes can be expressed as linear shifts; the difference is typically 0.5 mm. The reported results in and , as well as those for CT-based error, are taken from the large 30-bone training population.
Figure 3. Statistics accumulated from the trials carried out by the two users on (a) Bone 1 and (b) Bone 2 using a tracked pointer to obtain surface points. The average mean error is plotted against the number of surface points digitized.
Statistically speaking, the large population should yield better estimations for a given set of surface points of an unknown shape. The latter statement holds true, on average, for most unknown shapes, but not for all. It thus appears that Bone 2 would be an outlier. We can corroborate this assertion by briefly considering the aforementioned CT-based error setup. Nine dry cadaveric femurs were gathered from an archive to test our shape prediction method with respect to training population size, using surface points acquired from CT-generated surface models. Shape prediction error was taken with respect to the number of points digitized, and the two training populations' effects on the outcome were compared. It can be seen from that, for seven of the nine bones, the large training population produced better predictions than the small population. For the two cases where the small population produced better results, the difference in mean error was of the order of 0.1–0.2 mm. shows the mean errors obtained for each population, averaged over all nine bones, and it can be seen that, globally, the large population performed better than the small one.
Figure 4. For each population, the average mean error is plotted against the number of digitized points.
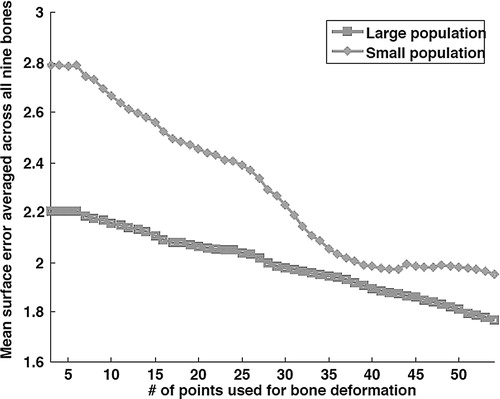
Table III. Mean surface errors for nine dry cadaver bones in the CT-based error scheme.
CT-based error
For Bone 1, the CT-based deformation error consisted of a mean surface error of 1.72 mm and a median surface error of 1.49 mm for 30 surface points. In the case of Bone 2, the CT-based error comprised a mean error of 2.30 mm and a median error of 2.07 mm for 30 surface points.
Evaluation of pointer-based anatomical prediction
For Bone 1, we did not notice a large observable discrepancy between the two users (average difference in mean error = 0.07 mm), as can be inferred from . On average, the predicted errors using this technique were within 0.3 mm of the CT-based error. All the results here were deemed acceptable in terms of accuracy (<2.5 mm mean error for large bones) for potential surgical applications.
For Bone 2, we noticed a larger discrepancy between the two users' trials (average difference = 0.49 mm) (). The averaged mean errors for both users were > 2.5 mm, and it can be noted that for the small population, they would have been acceptable (). The discrepancy between these error results and the CT-based error is larger than for Bone 1. The first user had, on average, mean error 0.5 mm greater than the CT-based error, and the second user had, on average, mean error 0.99 mm greater than the CT-based error.
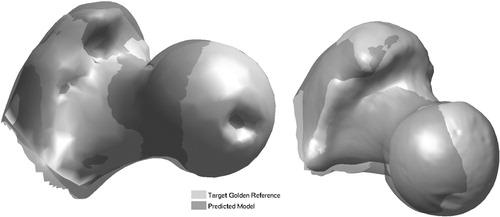
shows one case of shape prediction for each bone using the pointer-based approach, with the predicted shape overlaid on its respective ‘gold’ reference.
Figure 5. Pointer-based prediction: predicted models overlaid onto ‘gold’ references. Bone 1 (left): mean error = 1.76 mm; and Bone 2 (right): mean error = 2.78 mm.
Evaluation of ultrasound-based anatomical prediction
Considering Bone 1, the first user obtained the worst results of the entire experiment (). These predicted models were quite erroneous with respect to the pointer-based reference, and we found that this was largely due to inadequate localization of the initial three landmark points. The second user fared better with Bone 1, and in the best trial (mean error 3.08 mm) the result is comparable to that for the pointer-based approach.
For Bone 2, there was not a large discrepancy between the results of the users' ultrasound trials, as seen in . The second user's results were slightly better than those of the first user, with an average difference of 0.6 mm in mean error between users. In this scenario, there were four trials (mean errors of 2.90, 3.48, 2.94 and 3.12 mm, respectively) that produced results comparable to, if not better than, some of the pointer-based trials.
Discussion
Considering the size difference of the training populations, we can see that the modes of shape variation in the large population better represented Bone 1, whereas the converse was true for Bone 2 (). Considering Bone 2, it can be supposed that the large population became biased against accurate prediction of this shape. This is the effect of the insufficient size of the training population and highlights the need for large databases for statistical model construction.
The pointer-based trials produced results that were very close to those for the CT-based error, although they represent a less realistic clinical situation in which access to the bone surface is limited.
We have seen above that ultrasound-based prediction under our experimental conditions can provide a stable and repeatable prediction for bone visualization, although the accuracy is still not up to the level needed for clinical applications. We identified a severe cause of error to be the inaccurate localization of the initial three landmarks. With 2D ultrasound as a visual guide, it is quite an arduous task to accurately identify a defined landmark. The users who performed these experiments were neither medical experts nor sonographers. As such, the greatest source of error became a human one, and a different approach must be taken for localization of the initial landmarks using tracked 2D ultrasound. A study conducted by Cannon et al. Citation[13] highlights the limitations of using tracked 2D ultrasound for surgical guidance, arguing that real-time 3D systems provide improved accuracy when precise visualization is required. In our scenario, one further step for future work could be to initialize the shape prediction algorithm using a digitizing pointer and obtain further surface points with the use of 2D ultrasound. The location of the initial landmarks can be defined according to a given procedure to lie in areas where there would be surgical access. In a noninvasive manner, ultrasound can therein be used to obtain surface points on unexposed regions of bone that make up the anatomy of interest.
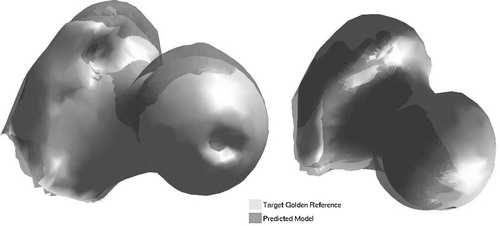
Figure 6. Ultrasound-based prediction: predicted models overlaid onto ‘gold’ references. Bone 1 (left): mean error = 3.08 mm; and Bone 2 (right): mean error = 2.90 mm.
In a clinical situation, although the landmarks may be defined with flexibility (they should span the object space), localizing them can be a challenge due to limited surgical access and possibly high patient-to-patient variability. We have so far avoided using a registration algorithm in conjunction with our bone deformation technique, because a geometric matching of points to a surface does not necessarily reflect an anatomical correspondence. Nevertheless, we intend to reduce the method's dependency on the initial landmarks by implementing a recursive registration algorithm, such as ICP, which could improve prediction and has been shown to yield good results in similar work Citation[1]. From our experience, it is feasible to obtain landmark points within 2–3 mm of their actual location using ultrasound-based techniques, which would then provide a reasonable initialization of the ICP registration. Finally, increasing the size of the model's training population would also improve the shape prediction accuracy for a larger set of ‘unknown’ bones.
Acknowledgments
We would like to thank the NCCR COME for funding this project, and Kontron Medical for providing the 2D diagnostic ultrasound system. We also thank our colleagues Gabriel Zsemlye, Rudolf Sidler, Ségolène Tarte, Tobias Rudolph, Marc Puls, Christoph Anderegg and Thibaut Bardyn for their support. Thanks also go to Kati Haenssgen of the Anatomy Department of the University of Bern for providing the cadaver bones, as well as to Mrs Spielvogel and Dr Sven Sarfert for providing all the CT scans.
References
- Chan CSK, Barratt DC, Edwards PJ, Penney GP, Slomczykowski M, Carter TJ, Hawkes DJ (2004) Cadaver validation of the use of ultrasound for 3D model instantiation of bony anatomy in image guided orthopaedic surgery. Proceedings of the 7th International Conference on Medical Image Computing and Computer-Assisted Intervention (MICCAI 2004), Saint-MaloFrance, September, 2004, C Barillot, DR Haynor, P Hellier. Springer, Berlin, 3217: 397–404, Lecture Notes in Computer Science
- Lavallée S, Merloz P, Stindel E, Kilian P, Troccaz J, Cinquin P, Langlotz F, Nolte L-P. Echomorphing: introducing an intraoperative imaging modality to reconstruct 3D bone surfaces for minimally invasive surgery. Proceedings of the 4th Annual Meeting of the International Society for Computer Assisted Orthopaedic Surgery (CAOS-International), Chicago, IL, June, 2004, F Langlotz, B Davies, SD Stulberg. 38–39
- Kowal J, Amstutz C, Nolte L-P. On the development and comparative evaluation of an ultrasound B-mode probe calibration unit. Comput Aided Surg 2003; 8(3)107–119
- Rajamani KT, Nolte L-P, Styner M (2004) A novel approach to anatomical structure morphing for intraoperative visualization. Proceedings of the 7th International Conference on Medical Image Computing and Computer-Assisted Intervention (MICCAI 2004), Saint-MaloFrance, September, 2004, C Barillot, DR Haynor, P Hellier. Springer, Berlin, 3217: 478–485, Lecture Notes in Computer Science
- Cootes TF, Cooper D, Taylor CJ, Graham J. Active shape models – their training and application. Computer Vision and Image Understanding 1995; 61(1)38–59
- Davies RH, Twining CJ, Cootes TF, Waterton JC, Taylor CJ. A minimum description length approach to statistical shape modelling. IEEE Trans Med Imaging 2002; 21(5)525–537
- Rajamani KT, Joshi S, Styner M. Bone model morphing for enhanced surgical visualization. Proceedings of the 2004 IEEE International Symposium on Biomedical Imaging: From Nano to Macro (ISBI), Arlington, VA, April, 2004, 1255–1258
- Fleute M, Lavallée S (1998) Building a complete surface model from sparse data using statistical shape models. Proceedings of the 1st International Conference on Medical Image Computing and Computer-Assisted Intervention (MICCAI 1998), Cambridge, MA, October, 1998, W Wells, A Colchester, S Delp. Springer, Berlin, 1496: 879–887, Lecture Notes in Computer Science
- Chan CS, Edwards PJ, Hawkes DJ. Integration of ultrasound-based registration with statistical shape models for computer-assisted orthopaedic surgery. Proceedings of the International Society for Optical Engineering (SPIE), San Diego, CA, May, 2003, M Sonka, JM Fitzpatrick. SPIE, 5032: 414–424, Medical Imaging 2003: Image Processing
- Rajamani K, Ballester M, Nolte L-P, Styner M. A novel and stable approach to anatomical structure morphing for intraoperative 3D visualization. Proceedings of the International Society for Optical Engineering (SPIE), San Diego, CA, April, 2005, RL Galloway, Jr, KR Cleary. SPIE, 5744: 718–725, Medical Imaging 2005: Visualization, Image-Guided Procedures, and Display
- Kowal J, Amstutz C, Nolte L-P. On B-mode ultrasound based registration for computer assisted orthopaedic surgery. Proceedings of the 1st Annual Meeting of the International Society for Computer Assisted Orthopaedic Surgery (CAOS-International), DavosSwitzerland, February, 2001, 35
- Aspert N, Santa-Cruz D, Ebrahimi T. Mesh measuring errors between surfaces using the Hausdorff distance. Proceedings of the IEEE International Conference on Multimedia and Expo, LausanneSwitzerland, August, 2002. 1: 705–708, (ICME)
- Cannon J, Stoll J, Salgo I, Knowles H, Howe R, Dupont P, Marx G, del Nido P. Real time 3-dimensional ultrasound for guiding surgical tasks. Comput Aided Surg 2003; 8(2)82–90