Abstract
Objective: To develop and evaluate an integrated approach to intra-operative dosimetry for permanent prostate brachytherapy (PPB) by combining a fluoroscopy-based seed localization routine with a transrectal ultrasound (TRUS)-to-fluoroscopy fusion technique.
Materials and Methods: Three-dimensional seed coordinates are reconstructed based on the two-dimensional seed locations identified from three fluoroscopic images acquired at different angles. A seed-based registration approach was examined in both simulation and phantom studies to register the seed locations identified from the fluoroscopic images to the TRUS images. Dose parameters were then evaluated and compared to CT-based dosimetry from a patient dataset.
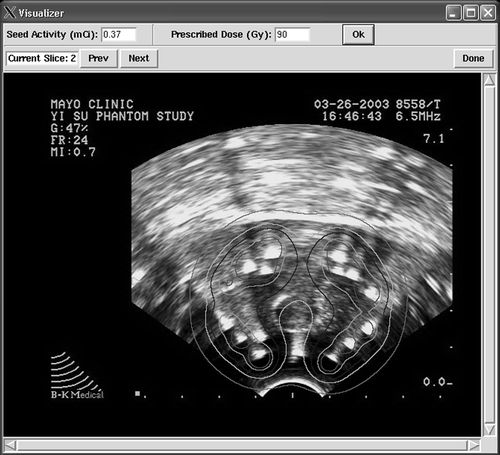
Results: Less than 0.2% error in the D90 value was observed using the TRUS-fluoroscopy image-fusion-based method relative to the CT-based post-implantation dosimetry. In the phantom study, an average distance of 3 mm was observed between the seeds identified from TRUS and the reconstructed seeds at registration. Isodose contours were displayed superimposed on the TRUS images.
Conclusions: Promising results were observed in this preliminary study of a TRUS-fluoroscopy fusion-based brachytherapy dosimetry analysis method, suggesting that the method is highly sensitive and calculates clinically relevant dosimetry, including the prostate D90. Further validation of the method is required for eventual clinical application.
Introduction
Permanent prostate brachytherapy (PPB) is an accepted and commonly employed means of treating early-stage prostate cancer. Despite the improvement in implantation techniques in recent years, exact replication of the treatment plan in the operating room (OR) remains difficult. Stock et al. Citation[1] have demonstrated that implant quality correlates with serum prostate-specific antigen (PSA) failure rates. The parameter D90, which is the minimum radiation dose that is delivered to 90% of the prostate, has been found to correlate with PSA failure and local recurrence Citation[2]. Thus, the accuracy of seed placement is important, and consequently the ability to immediately image and monitor seed placement relative to prostate anatomy is a critical determinant of outcome. The availability of both radiography (fluoroscopy) and trans-rectal ultrasound (TRUS) imaging in the OR leads naturally to the consideration of fusion of these two modalities. The prostate can be delineated from the TRUS images Citation[3], Citation[4] and the seed locations can be determined from the fluoroscopic images. A number of groups have addressed the reconstruction of 3D seed locations from multiple projection images Citation[5–12]. Tubic et al. Citation[13] and Todor et al. Citation[14] observed the seed overlap in projection images and proposed the use of cluster analysis to resolve the overlapping seeds from one another. In addition, Gong et al. Citation[15] proposed the use of needle tips as fiducials for the registration of ultrasound images to fluoroscopy, while Todor et al. Citation[14] reported a registration method using fiducials attached to the TRUS probe holder. Based on the observation that a portion of the seeds can be visualized by TRUS Citation[16], the hypothesis that these seeds can be used as fiducials for registration was tested. The present study reports the integrated approach combining fluoroscopy-based seed identification with seed-based fluoroscopy-to-TRUS registration for intraoperative dosimetry. In addition, a graphical user interface (GUI) was provided for interactive control of key image analysis parameters and for operator inspection of image analysis results, as well as for visualization of the dose distribution relative to the anatomy.
Materials and methods
Seed detection
The first stage in determining 3D seed locations is the detection of seed images in each projection. This can be divided into two consecutive steps: (1) segmentation of the radiographic images to generate binary images containing only seeds; and (2) determination of the number and location of seeds in each independent cluster.
The presence of radio-opaque objects in a fluoroscopic image other than the implanted seeds requires processing of the digital images such that they contain only seeds that subsequent automated seed localization can readily recognize. For the image preprocessing, two segmentation methods were developed and tested.
The first method was based on morphological techniques similar to those described previously Citation[13–15]. Three grayscale morphological erosion operations followed by grayscale reconstruction Citation[17] were applied to the original image, then the difference image between the original image and the grayscale reconstructed image was thresholded to obtain an initial binary image, displayed as black and white. The size of the independent components in the binary image was then analyzed, and small structures (<60 pixels) or large structures (>400 pixels) were removed, as neither was likely to represent seeds. Typically, such structures are prostatic calcifications, phleboliths, bony structures, fluoroscopic graticules, or radio-opaque Foley or rectal catheters with liquid contrast.
In the second method, a predefined filter was convolved with the original image to enhance the contrast between the seeds and the background. Grayscale levels were then interactively selected to threshold both the original and convolved images. The results of the two thresholded images were combined by a logical AND operation to form the segmented images. As in the first method, size analysis was applied to the independent components to remove small and large components. For both of these segmentation methods, the resulting binary image was reviewed by an experienced operator to verify that the seeds or clusters of seeds were efficiently identified and provide manual correction if indicated.
Once the radiographic images had been segmented, each seed cluster required analysis in order to determine the number and location of the seeds it contained. As described previously Citation[18], a statistical classifier was constructed based on the distribution of the number of pixels in a given cluster. In this method, the number of seeds in a cluster was determined using the normalized pixel count as the criteria for selection. Seed image locations in multi-seed components were then estimated by partitioning the major axis of the cluster. A grayscale averaging technique was used to estimate the actual size of the cluster and then the number of seeds it contained Citation[19]. The object size was estimated by considering the binary component and its surrounding area. The following equation was then used to estimate the cluster size (S):where G is the sum of gray values of all the pixels inside and surrounding the cluster, L is the mean gray value of the pixels in the surrounding area, N is the total number of pixels, and M is the maximum gray value inside the cluster. This statistical classifier method was shown to have an average error rate of less than 0.5% in terms of accurately predicting the number of seeds in a given cluster in the 12,670 cases evaluated Citation[18].
Seed reconstruction
The reconstruction algorithm to determine 3D seed locations from several projection images has been described previously Citation[18]. This algorithm is a modified version of the fast cross-projection algorithm reported by Narayanan et al. Citation[11]. The algorithm begins by analyzing the fluoroscopic projection having the least number of detected seeds and finds matches for all the seed images in this projection in the other projections. During this initial step, each seed image is used only once. When all of the seed images in this projection have been matched to seed images in the other projections, the unused seed images in the other projections are then matched. At this point, a single seed image may be used again to account for those overlapped seeds that were not detected in the segmentation step. A major advantage of this modified algorithm is the capability to handle projections with different numbers of detected seeds, which occurs when seeds have varying degrees of overlap with one another in a 2D image. The algorithm was tested in both simulation and phantom studies as described previously Citation[18] and shown to be able to effectively reconstruct the 3D location of the seeds with an error within 1 mm in the simulated cases.
TRUS-fluoroscopy fusion
The method of image fusion, also known as image registration, has been described previously Citation[20]. Although TRUS is not the optimal modality for seed detection because of the reduced signal backscatter at varying seed orientations and other factors, a portion of the seeds can nevertheless be identified Citation[16], Citation[21], Citation[22]. In this registration method, seeds identified in the TRUS images are used as fiducial markers for the registration with fluoroscopic projections. Since information that could directly establish the correspondence between seeds identified in TRUS images and seeds reconstructed from fluoroscopy is not available, the transformation between the two coordinate systems cannot easily be established. The registration method minimizes the sum of the squared distance between TRUS seeds and their closest neighbors in reconstructed seed locations using a downhill simplex algorithm Citation[23]. A simulation study was performed to test the effectiveness of this registration approach at different percent seed visibility levels and different uncertainty levels for seed location Citation[20].
Graphical user interface
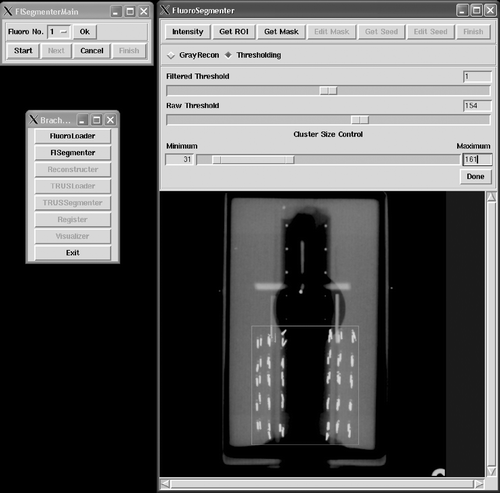
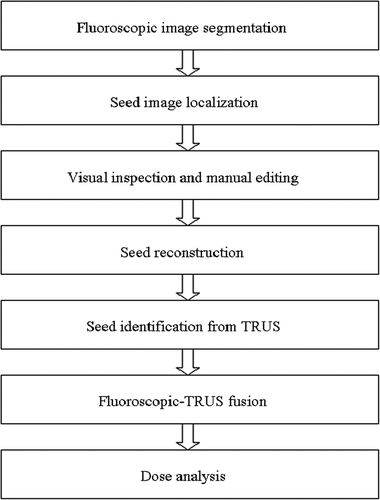
A graphical user interface (GUI) () was implemented which integrated the above-mentioned steps. The image data was processed and dose analysis was performed based on the workflow illustrated in . The entire process was divided into seven steps: (1) loading fluoroscopic images; (2) segmentation of fluoroscopic images to locate individual seeds on each projection image; (3) reconstruction of 3D seed locations based on the segmentation result from the previous step; (4) loading TRUS images; (5) identification of seeds from the TRUS images; (6) registration of fluoroscopic images to TRUS using the two sets of seed coordinates; and, finally, (7) dose calculation and display of the isodose contours superimposed on the TRUS images. Each of these seven steps corresponds to a button in the main control interface shown on the left of . The large GUI window in illustrates the GUI for fluoroscopic image segmentation. Critical parameters for the segmentation algorithm, such as thresholds, may be interactively controlled by the user for optimal segmentation results, while the binary masks produced from the segmentation algorithm are superimposed on the original fluoroscopic images. Once the fluoroscopic images are segmented, the GUI is automatically switched to the seed detection mode, in which individual seeds are identified based on the binary masks. The reconstruction button is activated when seeds have been identified from all three fluoroscopic images to determine the 3D location of seeds. Following the seed reconstruction, the TRUS loader and segmenter is activated to load TRUS images and identify seeds from TRUS images that are intended to serve as fiducials for registration of fluoroscopic images with the TRUS images. After this image registration, the dose volume statistics relevant to interpreting the quality of the seed implant are computed. In addition, the radiation isodose contours are displayed superimposed on the TRUS images.
Simulation study
A simulation study was performed to compare the radiation dosimetry based on the TRUS-fluoroscopy registration approach described in this paper with CT-based dosimetry. Seed locations were extracted from post-implant CT data from a patient who underwent PPB at our institution with 122 Iodine-125 seeds implanted. Simulated projection images were created based on the seed coordinates from this implant, then these simulated projection images were used to reconstruct the 3D locations of the implanted seeds using the method described previously. Forty percent of the CT seed coordinates were randomly selected to be transformed and perturbed with positional uncertainty to create the simulated TRUS seed locations. The positional uncertainty applied was up to 2 mm in each dimension and was uniformly distributed. The same transformation parameter was then applied to the original CT data to create the simulated TRUS image dataset. Subsequently, the reconstructed seed locations were registered to the simulated TRUS dataset using the fusion method described above. The prostate was manually segmented from the simulated TRUS images by the treating radiation oncologist. After registration, dosimetry analysis was performed using the reconstructed seed locations registered with the simulated TRUS prostate volume. Detailed dosimetry analysis was performed for this technique and compared to the result of the CT-based dosimetry analysis.
Phantom study
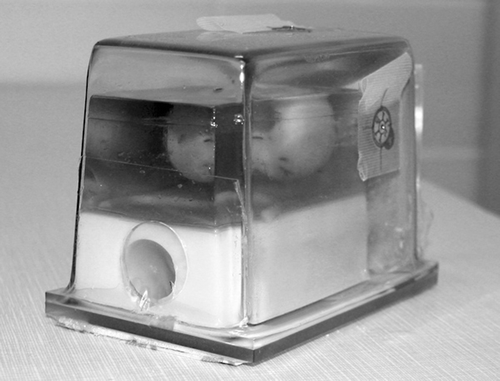
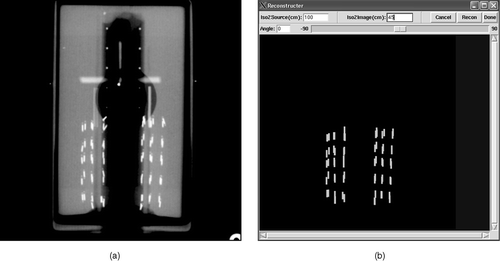
A prostate phantom, as shown in , with 64 implanted seeds was also used to test the reconstruction and registration approach. Fluoroscopic images of the phantom were taken on a radiation therapy simulator (Varian Ximatron CX) and projections from −90° to 90° were taken at 30° intervals. The films were then digitally scanned for computer analysis. Three-dimensional coordinates of the implanted seeds were reconstructed from the projection images using the fast cross-projection-based method Citation[18]. CT scans at 1.5-mm slice intervals were acquired and analyzed to extract the seed coordinates. Step-section ultrasound images were acquired at 2.5-mm slice intervals for the phantom at 6.5 MHz using a TRUS probe and stepper used for PPB. Seed positions identified from the TRUS images and the prostate contours were traced manually. While searching for seeds in the TRUS images, every other slice was used to reduce the possibility of counting a seed more than once since the seeds are longer than the 2.5-mm step-section thickness used to generate the TRUS data. Manual segmentation was also performed on the CT data to delineate the prostate. The reconstructed seed coordinates from the fluoroscopic images were registered with the seeds identified in the TRUS images using the seed-based registration approach. To evaluate the effectiveness of the registration algorithm, the CT images were fused to the TRUS images by using the seed coordinates in both sets of images as reference fiducials. The overlap of prostate volume in these two image sets was then determined. In the phantom study, the dosimetry calculation was not performed and compared with CT-based dosimetry because the phantom implantation was not planned as a mock PPB procedure with dosimetry representative of a clinical case.
Results
Seed detection
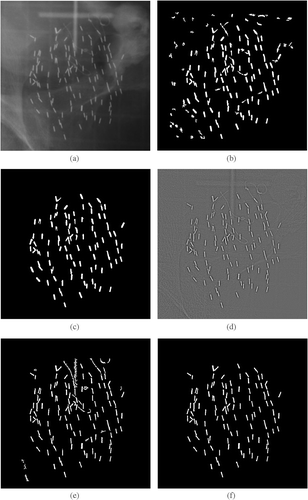
is an example of a radiographic image of a patient after seed implantation. and show the segmentation results obtained using the morphological approach without and with size analysis and manual editing, respectively. shows the filtered image, and and show the segmentation results obtained using the filtering-based method. During the automatic cluster analysis, all structures with a pixel count of less than 60 or greater than 400 were rejected as non-seed structures. The threshold for cluster rejection is dependent on the resolution of the imaging system and the size of the implanted seeds. Computation time is less than one second for both methods using a standard personal computer with processor speed of 1 GHz or greater and random access memory of 512 MB. Without conducting the size analysis, the segmented results generated by both methods may contain up to 30 false-positive seeds. In practice, the automated size analysis step can generally reduce the presence of false positive seeds to less than 10. Manual editing requiring less than 1 minute permits elimination of the remaining structures that are not true seeds.
Figure 4. (a) Original radiograph of a patient implant. (b) Automatic segmentation result using morphological techniques without size analysis. (c) Result from (b) after size analysis and manual editing. (d) Filtered image using the predefined point spread function (PSF). (e) Segmentation result by interactive thresholding of both (a) and (d). (f) Result after size analysis and manual editing.
Simulation study
shows the seed coordinates reconstructed from the projection images and extracted from CT data at registration. In this example, 40% of the actual seeds are randomly chosen to be visible in the TRUS image. The total number of seeds reconstructed was 121 using this algorithm, as compared to 122 actual seeds in the implant (99% sensitivity). The mean distance between the two sets of seed coordinates is 1.1 mm. compares the dosimetry parameter computed based on the image-fusion-based approach and CT-based dosimetry. It is evident that the dose parameters computed from the two approaches are in close agreement. For instance, there is only −0.1% difference in the parameter prostate D90. Although the percentage difference for some other parameters, such as the bladder V100, is high (57%), the actual difference is small (0.36 cc) in terms of its clinical significance.
Figure 5. Reconstructed seed locations (×) compared with “gold standard” CT seed locations (o) at registration.
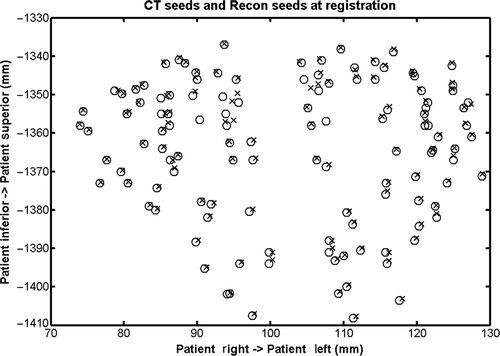
Table I. Dosimetry parameters calculated using the image-fusion-based approach and compared to the results from CT-based dosimetry for the simulation study. Prostate D90 is the minimum dose delivered to 90% of the prostate volume; Prostate D50 is the minimum dose delivered to 50% of the prostate volume; and V parameters are the volume of the corresponding anatomical structure that is exposed to the noted percentage dose. For example, Prostate V150 is the volume of the prostate that was exposed to 150% of the prescribed dose. In this particular case, the prescribed dose was 145 Gy.
Phantom study
The number of seed images identified from the projections at 0, 30 and 60 degrees was 57, 64 and 64, respectively. The reconstruction algorithm was able to determine implanted seed locations with only three false-positive seeds (). The mean distance between TRUS seeds and the reconstructed seeds was 3 mm at registration. The prostate volume determined from the CT images was 51.5 cc, and the volume determined from TRUS imaging was 54.2 cc: a 5% difference. At registration, the portion of the prostate that was found in both the TRUS and CT datasets was 90% of the prostate volume found in the CT images (46.2 cc). The distance between the centroids of the two volumes was 3 mm. The isodose contours superimposed on the TRUS images are shown in .
Discussion
We have developed a method to localize the 3D coordinates of seeds in a permanent prostate brachytherapy implant from multiple fluoroscopic images where the number of seeds identified in each image is unequal. In addition, two image-processing techniques have been employed which automate seed identification from the fluoroscopic images. The seed localization method is then combined with a registration approach using those seeds identified from the TRUS images as fiducials. With the registration of the two imaging modalities, dosimetry parameters such as D90 are calculated and compared to CT-based post-implantation dosimetry. The main advantage of the seed-based registration approach is that no extra intervention or device is needed to establish the registration between the fluoroscopy and TRUS images, although extra imaging analysis, including manual editing and segmentation, is necessary. A previous simulation study indicates that registration accuracy using the seed-based approach is improved when compared to an approach using four points as fiducials, e.g., that which would be used with four needle tips inserted into the prostate Citation[15].
Considerable human interaction is needed for the seed image identification process to remove false positives in the segmentation results. False-positive seed images identified from the fluoroscopic images will cause false positives in the reconstructed 3D seeds. Although the seed reconstruction algorithm can compensate for the undetected seeds due to overlapped seed images, it does not have the capability to eliminate false positives. Another source of false positives arises from the action of the seed reconstruction algorithm whereby a single seed image may be reused more than once. A more advanced technique is needed to reduce the likelihood of generating false positives and detect all the implanted seeds. However, it should be noted that unless a significant number of seeds are undetected or a large number of false positives are generated, the resulting dosimetry parameters will not be significantly affected Citation[24].
In the initial simulation study, a 0.14% deviation of D90 was observed using the fusion-based technique as compared to the CT-based dosimetry. Similar efforts combining fluoroscopy-based seed localization and TRUS-fluoroscopic fusion have been reported by Gong et al. Citation[15] and Todor et al. Citation[14]. In the study by Gong et al., four needle tips were used as fiducials to achieve registration and a 4.2% deviation of D90 was observed as compared to the CT-based dosimetry. This deviation is attributed to the registration error and the uncertainty in prostate boundary determination. Such differences in the D90 computation from these two approaches are small and may reflect the sensitivity of D90 to prostate boundary definition. Nevertheless, it should be apparent from the limited phantom and simulation studies reported here that the seed-based registration is an approach worthy of further investigation, preferably in a clinical setting.
It should be noted that our seed-based registration approach is based on the assumption that a reasonable portion of the seeds can be identified using TRUS. If the portion of seeds detectable by TRUS is less than 20%, or if the uncertainty in seed localization is significant, e.g., greater than 3 mm in standard deviation, our simulations suggest that the registration will become unreliable. The internal gel portion of the prostate ultrasound phantom shown in had decreased in size due to repeated exposure to air and desiccation. Consequently, it had become pliable within its acrylic housing. Therefore, the registration accuracy between the fluoroscopy and TRUS image sets may have been influenced by the less-than-rigid condition of the phantom at the time of the experiments. In a certain respect, however, this feature of the phantom may have been more realistic in simulating actual clinical conditions; it can be compared to prostate deformation during and after the procedure due to edema or other factors that may also cause inaccurate dosimetry. The inevitable change in prostate shape during the acquisition of TRUS images is another source of error, as a rigid prostate model is assumed in our registration approach. Nonetheless, and in spite of these potential limitations, the method described here is unique and of interest as a means to facilitate intraoperative dosimetry that relies upon seed position as determined by two commonly employed PPB imaging modalities: trans-rectal ultrasonography and C-arm fluoroscopy.
Conclusion
An intraoperative dosimetry method for permanent prostate brachytherapy based on TRUS-fluoroscopy fusion using seeds as fiducial points for registration was developed. The method was tested in both simulation and phantom studies, with preliminary results demonstrating that the method is sufficiently accurate to provide clinically meaningful intraoperative dosimetry.
Acknowledgments
This research was supported in part by National Institute of Health grant R33 CA107933 and by Oncura, Inc.
References
- Stock RG, Stone NN, Tabert A, Iannuzzi C, DeWyngaert JK. A dose-response study for I-125 prostate implants. Int J Radiat Oncol Biol Phys 1998; 41(1)101–108
- Potters L, Cao Y, Calugaru E, Torre T, Fearn P, Wang XH. A comprehensive review of CT-based dosimetry parameters and biochemical control in patients treated with permanent prostate brachytherapy. Int J Radiat Oncol Biol Phys 2001; 50(3)605–614
- Ghanei A, Soltanian-Zadeh H, Ratkewicz A, Yin FF. A three-dimensional deformable model for segmentation of human prostate from ultrasound images. Med Phys 2001; 28(10)2147–2153
- Shen D, Zhan Y, Davatzikos C. Segmentation of prostate boundaries from ultrasound images using statistical shape model. IEEE Trans Med Imaging 2003; 22(4)539–551
- Amols HI, Rosen II. A three-film technique for reconstruction of radioactive seed implants. Med Phys 1981; 8(2)210–214
- Biggs PJ, Kelley DM. Geometric reconstruction of seed implants using a three-film technique. Med Phys 1983; 10(5)701–704
- Altschuler MD, Findlay PA, Epperson RD. Rapid, accurate, three-dimensional location of multiple seeds in implant radiotherapy treatment planning. Phys Med Biol 1983; 28(11)1305–1318
- Siddon RL, Chin LM. Two-film brachytherapy reconstruction algorithm. Med Phys 1985; 12(1)77–83
- Altschuler MD, Kassaee A. Automated matching of corresponding seed images of three simulator radiographs to allow 3D triangulation of implanted seeds. Phys Med Biol 1997; 42(2)293–302
- Todor DA, Cohen GN, Amols HI, Zaider M. Operator-free, film-based 3D seed reconstruction in brachytherapy. Phys Med Biol 2002; 47(12)2031–2048
- Narayanan S, Cho PS, Marks RJ, 2nd. Fast cross-projection algorithm for reconstruction of seeds in prostate brachytherapy. Med Phys 2002; 29(7)1572–1579
- Tubic D, Zaccarin A, Beaulieu L, Pouliot J. Automated seed detection and three-dimensional reconstruction. II. Reconstruction of permanent prostate implants using simulated annealing. Med Phys 2001; 28(11)2272–2279
- Tubic D, Zaccarin A, Pouliot J, Beaulieu L. Automated seed detection and three-dimensional reconstruction. I. Seed localization from fluoroscopic images or radiographs. Med Phys 2001; 28(11)2265–2271
- Todor DA, Zaider M, Cohen GN, Worman MF, Zelefsky MJ. Intraoperative dynamic dosimetry for prostate implants. Phys Med Biol 2003; 48(9)1153–1171
- Gong L, Cho PS, Han BH, Wallner KE, Sutlief SG, Pathak SD, Haynor DR, Kim Y. Ultrasonography and fluoroscopic fusion for prostate brachytherapy dosimetry. Int J Radiat Oncol Biol Phys 2002; 54(5)1322–1330
- Han BH, Wallner K, Merrick G, Butler W, Sutlief S, Sylvester J. Prostate brachytherapy seed identification on post-implant TRUS images. Med Phys 2003; 30(5)898–900
- Vincent L. Morphological grayscale reconstruction in image analysis: applications and efficient algorithms. IEEE Trans Image Processing 1993; 2(2)176–201
- Su Y, Davis BJ, Herman MG, Robb RA. Prostate brachytherapy seed localization by analysis of multiple projections: identifying and addressing the seed overlap problem. Med Phys 2004; 31(5)1277–1287
- Su Y, Davis BJ, Robb RA. A method for size estimation for small objects and its application in brachytherapy seed identification. Proceedings of SPIE Medical Imaging 2004: Image Processing, JM Fitzpatrick, M Sonka. 2004; SPIE Vol 5370: 1679–1684
- Su Y, Davis BJ, Herman MG, Robb RA. Fluoroscopy to ultrasound image registration using implanted seeds as fiducials during permanent prostate brachytherapy. Proceedings of SPIE Medical Imaging 2004: Visualization, Image-Guided Procedures, and Display, RL Galloway, Jr. 2004; SPIE Vol 5367: 371–378
- Davis BJ, Kinnick RR, Fatemi M, Lief EP, Robb RA, Greenleaf JF. Measurement of the ultrasound backscatter signal from three seed types as a function of incidence angle: application to permanent prostate brachytherapy. Int J Radiat Oncol Biol Phys 2003; 57(4)1174–1182
- Davis BJ, LaJoie WN, McGee KP, Geyer SM, King BF, Wilson TM, Mynderse LA, Herman MG, Robb RA. Seed identification rates as a function of imaging modality in permanent prostate brachytherapy using CT-MR-TRUS image fusion. Proceedings of the American Brachytherapy Society 2002. 2002, 42
- Press WH, Teukolsky SA, Vetterling WT, Flannery BP. Numerical Recipes in C: The Art of Scientific Computing. Cambridge University Press, CambridgeUK 1992
- Su Y, Davis BJ, Herman MG, Manduca A, Robb RA. Examination of dosimetry accuracy as a function of seed detection rate in permanent prostate brachytherapy. Med Phys 2005; 32(9)3049–3056
