Abstract
Innovative methods for morphological and functional analysis of bones have become a primary objective in the development of planning systems for total knee replacement (TKR). These methods involve the interactive identification of clinical landmarks (reference points, distances, angles, and functional axes of movement) and the determination of the optimal implant size and positioning. Among the functional axes used to estimate the correct alignment of the femoral component, the Whiteside line, namely, the anterior-posterior (AP) direction, is one of the most common. In this paper, we present a computational framework that allows automatic identification of the Whiteside line.
The approach is based on geometric analysis of the saddle shape of the intercondylar fossa to extract the principal line in the AP direction. A plane parallel to the frontal plane is moved in the AP direction to obtain the 2D profiles of the intercondylar fossa. Each profile is fitted to a fifth-order polynomial curve and its maximum curvature point computed. The point set collected across all the profiles is then processed to compute the principal direction. The 2D profile-fitting and 3D line-fitting residual errors were analyzed to study the relationship between the intercondylar fossa aspect and the nominal saddle surface. The method was validated using femur specimens from elderly subjects reconstructed from CT scans. The repeatability of the method was evaluated across five different femur surface resolutions.
For comparison, three expert orthopaedic surgeons identified, by virtual palpation, the Whiteside line on the same 3D femur models. The repeatability (median angular error) of the Whiteside lines computed by the automated method and by manual virtual palpation, was approximately 1.0° and 3.5°, respectively. The angular skew error between the two axes, measured on the axial plane, averaged approximately 4.00° (SD: 2.64°) with no statistical difference. The automated method therefore proved more reproducible and was in agreement with the manual method. We conclude that operator-independent methods, such the one presented in this paper, can be favorably introduced into orthopaedic surgical planning systems.
Introduction
During total knee replacement (TKR), several instruments are used to remove the damaged bone and cartilage, to verify implant sizing, and to set up proper implant positioning. Additionally, traditional TKR uses intramedullary and extramedullary instruments to assist with implant alignment Citation[1]. To avoid the need for such invasive instruments, computer-aided knee navigation, requiring optical or electromagnetic 3D tracking systems and tracker tools rigidly connected to the patient and to the surgical instruments, has been introduced into clinical practice. By measuring in real time the relative position of the tools with respect to the patient's bones, these systems allow accurate positioning of the jigs, enable the femoral component rotation to be correctly established, provide instantaneous feedback on overall alignment, and are able to prevent implantation of malpositioned components Citation[2], Citation[3]. Overall, computer assistance results in decreased variability and the sensible reduction of outliers Citation[4], Citation[5].
Recently, 2D- and 3D-based innovative methods for surgical planning and simulation systems have emerged, allowing interactive or semi-automatic identification of clinical landmarks, i.e., anatomical points, lines and regions, on the patient's individual virtual bone anatomy. These methods allow determination of the optimal implant size and positioning according to the computed clinical landmarks, visualization of the virtual bone resections, and simulation of the entire intervention prior to surgery Citation[6–16]. As an added value, they provide functionalities, based on bone surface analysis, for designing and modeling personalized resection guides that can be used during the TKR procedure, substituting for the traditional jigs and avoiding the need for any other alignment instrument or navigation support Citation[17–19].
From the technical point of view, one of the critical points of this last approach is that the reliability of the surgical outcome is strongly dependent on the correct alignment and anatomical coupling of the personalized resection guides with the patient's bones. Both the measurement quality and reproducibility of the clinical landmarks, which directly affects correct prosthesis alignment, and the morphological interface modeling of the jigs, which directly affects the accurate and unique coupling of the guides with the patient anatomy, are therefore significant issues. In particular, it has been shown that virtual palpation in CAD environments on both 2D images and 3D shape bone models is time-consuming and suffers from low inter-observer repeatability Citation[10], Citation[20–22].
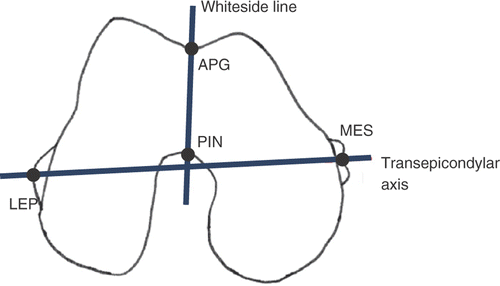
In this paper, we address the problem of the quality and repeatability of the clinical landmark measurements performed on 3D femur models and propose a computational framework to automatically identify the Whiteside line (WL), i.e., the anterior-posterior axis of the distal femur (). The WL, defined as the line connecting the deepest part of the anterior patellar groove (APG) to the center of the posterior intercondylar notch (PIN), is traditionally used in TKR as a reference for assessment of the femoral component rotation Citation[23–25] as an alternative to the transepicondiylar axis (TEA). While the TEA has been largely used to approximate the optimal flexion-extension axis of the knee Citation[26–31], the WL has been shown to be a valuable alternative to the TEA in severely valgus knees Citation[32].
Figure 1. Diagram of the Whiteside line and transepicondylar axis along with the four point landmarks, namely, the deepest part of the anterior patellar groove (APG), the center of the posterior intercondylar notch (PIN), the lateral epicondylar prominence (LEP) and the median sulcus of the medial epicondyle (MES), conventionally considered to trace the two axes.
In earlier publications Citation[13], Citation[14], we proposed a computational framework to process the 3D shape model of the femur and extract the shaft, distal and proximal parts. A method based on geometric-based analysis allowed the extraction of the femoral head and neck from the proximal femur, and a sphere-fitting algorithm was used to compute the center and radius of the femoral head Citation[13]. The automatic processing of the distal femur surface allowed 3D segmentation of the condyles and intercondylar fossa Citation[14]. Building on these earlier results, we here propose a method that uses a cutting plane, parallel to the frontal plane, to obtain the 2D profiles of the intercondylar fossa. Each profile is fitted to a fifth-order polynomial curve and its maximum curvature point is computed. The point set collected across all the profiles is then processed through robust 3D line-fitting to compute the WL. The performance of the method was evaluated using mesh surfaces reconstructed from CT scans of 20 cadaveric femora. A reference axis set was obtained by manual analysis of the 3D femur models, performed by three medical experts, and used to compare the reproducibility of the automated method with the inter-observer reproducibility.
Methods
Whiteside line
The starting point of our procedure is an available 3D shape model of the distal femur, segmented in the medial and lateral compartments. Estimation of the WL is done by cross-sectioning the intercondylar fossa through planes parallel to a conventional frontal plane, which we consider to be equidistant from the two posterior condyles. This plane is automatically computed starting from an initial guess that we assume to be parallel to the frontal images digitally reconstructed from the original axial scans. The position of the plane is considered fixed to the projection of the geometric center of the distal femur on the shaft axis. The plane orientation is iteratively adjusted, within an evolution strategy-based optimization Citation[33], through two angles, φ and κ, in the two directions orthogonal to the plane normal, until the lateral and medial condyles, in the posterior direction, are equidistant from the plane. The corresponding fitness function is set up as follows:where
and
are the distances from the points on the lateral and medial posterior condyles to the current frontal plane, respectively ().
Figure 2. Frontal plane computed through the evolution strategy-based algorithm. The plane orientation is iteratively adjusted through two angles, φ and κ, in the two directions orthogonal to the plane normal .
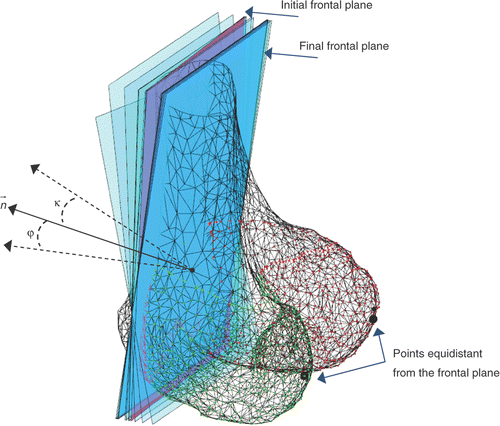
The optimization method evaluates a posteriori the quality of the actual solution (fitness) and, consequently, adapts the mutation function in the parameter space (φ, κ) in such a way as to minimize the fitness, finding more and more effective solutions as the evolution progresses. The procedure involves the generation of offspring parameter sets by mutating the actual parameter set (φt, κt) at evolution step t. We adopted the (1, λ) evolution strategy (ES) paradigm, which implies that a single parameter set (father) generates λ sons in the offspring, of which only one is selected to become father to the next evolution step. Two nested cycles are considered: the outer one is related to the fitness computation for all the parameter sets in the offspring population; the inner one is related to the fitness computation (area of the neck cross-section) corresponding to the current parameter set. For all elements in the population (one element is a parameter set), fitness is computed and accumulated for the following selection process. The parameter set associated with the lowest fitness is selected to become the parent in the next epoch of the evolution process. The mutation function is adapted according to the covariance matrix adaptation (CMA) method Citation[33]. The evolutionary optimization stops when either the step size of the mutation function falls below a predefined convergence threshold (0.05°) or the fitness falls below 0.1 mm.
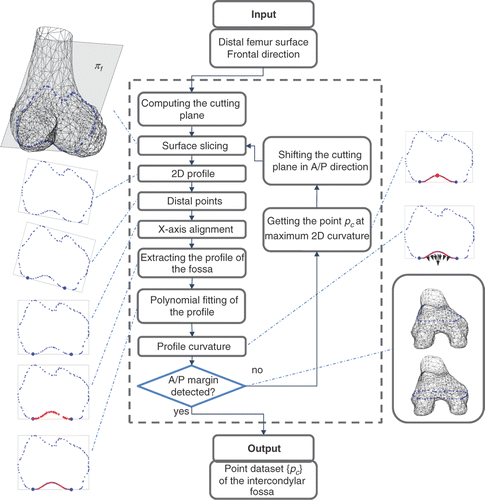
Once the frontal plane has been computed, the cross-sectioning of the distal femur can be exploited. Starting from the central part of the fossa, the plane is moved along its normal direction, alternately in the anterior and posterior directions, by a step size of 0.5 mm. This is repeated until the margins of the fossa are detected. For each cross-section, the algorithm first extracts the contour and determines the distal points pl and pm in the lateral and medial condyles. It then aligns the 2D profile along the X-axis determined by the pl - pm segment and separates the 2D profile of the fossa from the overall profile, computing the high-order polynomial fitting of the profile as
In conclusion, it determines the point pc corresponding to the maximum point of the polynomial function (). The anterior margin is automatically detected by using a lower threshold for the maximum curvature of the profile (10% with respect to the maximum curvature measured on the central profiles) as the fossa becomes progressively smoother moving in the anterior direction. The posterior margin is automatically detected by using a lower threshold (1 mm) on the residual error of the polynomial fitting with respect to the profile points. The WL lt was then computed by fitting a 3D line to the point set {pc} ().
Figure 3. Processing of the intercondylar fossa surface. The frontal plane πf is iteratively shifted in the anterior and posterior direction to obtain the cross-sections of the femur surface. For each cross-section, the algorithm extracts the contour, determines the distal points in the lateral and medial condyles, aligns the 2D profile along the X-axis, separates the 2D profile of the fossa from the overall profile, computes the fifth-order polynomial fitting of the profile, and finally determines the point pc corresponding to the maximum curvature. The anterior margin is automatically detected by using a lower threshold for the maximum curvature of the profile (10% with respect to the maximum curvature measured on the central profiles) as the fossa becomes progressively smoother in the anterior direction. The posterior margin is detected by using a lower threshold (1 mm) on the RMS residual of the polynomial fitting with respect to the profile points. The collected point set {pc} is then used for 3D fitting the WL.
The optimal order n of the polynomial fitting was found by considering the minimum a posteriori residual fitting error ef, which was computed on a target femur model as follows:where ycm and
are the mth ordinates of the points on the intercondylar fossa profile and the polynomial function, respectively. m (1:M) is the number of points in the cth profile (1:C) sliced on the intercondylar fossa. Increasing orders of the polynomial function were used starting from the 2nd order.
Data collection
Eleven embalmed cadavers (9 male, 2 female) with a mean age of 77 years (range: 61–95 years) underwent CT axial acquisition using a Siemens Somatom Sensation 64 scanner (Siemens AG, Erlangen, Germany) with a field of view of 38 cm × 38 cm, set to 140 kV and 48 mAs. A total of 635 contiguous axial slices (512 × 512 pixels) were acquired at 1-mm scan intervals. As two subjects in the study group had undergone a total hip arthroplasty on the left and right side, respectively, only 10 left and 10 right image datasets were considered. Three-dimensional models of the femoral outer surface were manually created for all CT datasets using a Mimics software application (Materialise NV, Leuven, Belgium). The femur was separated from the pelvis, tibia and patella by manual editing followed by a region-growing operation. Articular cartilage was excluded from the segmentation. Holes in the voxel masks, which connected the endosteal cavity to the outside, were removed using 3D morphological closing. In some cases, manual editing was necessary to close the remaining holes. Cavity fill was then used to remove all cavities from the mask. Finally, 3D morphological opening was applied to smooth the surface.
Repeatability
The performance of the method was first expressed in terms of the repeatability of the WL direction. While the determination of the parameters from the femoral surface is fully automated, the quality of the manually obtained mesh can affect the repeatability of the method. Five different surface quality levels, corresponding to different numbers of surface faces – 20,000, 15,000, 10,000, 5000 and 3000 – were obtained using the Amira software package (Visage Imaging, Inc., San Diego, CA). Considering that the original femur surface consisted of approximately 75,000 faces, the corresponding Hausdorff distances to the five smoothed surfaces were approximately 0.03 mm, 0.05 mm, 0.06 mm, 0.10 mm and 0.15 mm, respectively. (Given two surfaces A and B with differing numbers of points, the Hausdorff distance between A and B is obtained as H(A, B) = max(h(A, B), h(B, A)) where h(A, B) = max(min(d(a, b)) for all a in A, b in B, where d(a, b) is an L2 norm.) The mesh with 20k faces was considered to be representative of a high-quality surface (reference mesh) and the other lower-resolution meshes were compared to it. This selection was also motivated by the fact that we verified a good compromise between surface detail and computational load.
Median values and lower- and upper-quartile ranges were considered. To compare the results across different mesh qualities, statistical analysis was performed using a Kruskall-Wallis test with a 5% significance level.
Relation between WL uncertainty and intercondylar fossa morphology
To evaluate the quality of the WL assessment, we considered the 3D line-fitting error e3D corresponding to the 20k surface mesh. This value, consisting of the RMSE of the residual error distance distribution of the points {pc} from the fitted WL, was determined as follows:with
where pc is the cth fitting point (corresponding to the maximum curvature in the cth 2D profile) and
is the orthogonal projection of pc on the WL line. We assumed that the e3D could be related to the intercondylar fossa morphology. The normal intercondylar fossa is shaped like a saddle surface, which is characterized by a principal direction. As evidenced in reference Citation[34], systematic deviations from normality due to osteoarthritis can correspond to increased smoothness at the intercondylar notch level. Also, the smoothness of the fossa can vary due to morphological variability. The e3D error was compared to the qualitative evaluation of the intercondylar fossa aspect, which was carried out by the same orthopedic surgeon who performed the virtual landmark palpation.
Comparison to clinical knowledge
The agreement of the results with clinical knowledge was ascertained by comparing the WL direction obtained by the automatic method to that obtained by manual detection. Three orthopedic surgeons possessing the same level of expertise in radiological images analyzed the original CT images and the reconstructed high-resolution femur surfaces using Amira. The spatial location of the four specific anatomical landmarks (the lateral epicondylar prominence [LEP], the median sulcus of the medial epicondyle [MES], the anterior patellar groove [APG] and the posterior intercondylar notch [PIN]) used to trace the TEA and WL, was determined by virtual palpation. The experts analyzed all 20 datasets four times. For each expert, the mean value of one point landmark and the corresponding error distance were computed as follows:
The overall intra-observer variability in the landmark identification for each observer was represented by the median of the value distribution across all 20 specimens. The inter-observer variability was computed as the distance
of the three averaged point landmarks
(where j = 1,2,3 represents the observer) from the mean point
as follows:
The WL direction, averaged across observers, was used as a reference for comparison with the corresponding direction computed by the automated method. The statistical comparison was performed using a Kruskall-Wallis test with 5% significance level. The TEA direction, averaged across observers, was used to evaluate the perpendicularity in the axial plane between the TEA direction and the two WL directions.
Results
The automatic processing of a single femur surface (with 20k faces) took approximately 10 seconds. The WL detection algorithms converged to consistent results for all the surfaces.
Polynomial fitting of the intercondylar fossa profile
The fifth-order polynomial proved to be the best fitting function for the profiles sliced on the intercondylar fossa according to the fitting error (). The sixth-order polynomial was inapplicable because of over-fitting.
Table I. Fitting error ef (in mm) across the different polynomial orders.
Repeatability
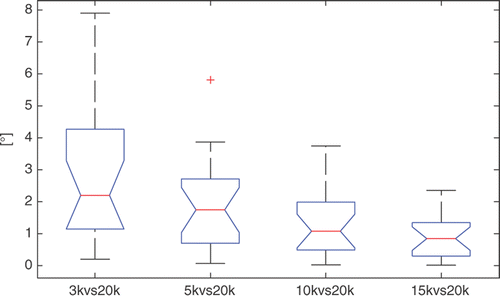
The repeatability of the WL was good, with a minimum relative median error of less than 1.0° for 15k versus 20k. As expected, the repeatability decreased with decreasing surface detail. The variability around the median value was in the region of approximately 7.5° for 3k versus 20k, 3.8° for 5k versus 20k, 3.7° for 10k versus 20k, and 2.2° for 15k versus 20k (). The maximum error was less than 8° in correspondence with the 3k versus 20k distribution. The 10k versus 20k and 15k versus 20k error distributions were both statistically different (p < 0.009) from the 3k versus 20k error distribution.
Figure 4. Box-plots of the repeatability results (angular deviation on the axial plane) for the WL. On each box, the central mark is the median, the edges of the box are the 25th and 75th percentiles, and the whiskers extend to the most extreme data points not considered outliers, excluding outliers that are plotted individually as red crosses.
Relation between WL uncertainty and intercondylar fossa morphology
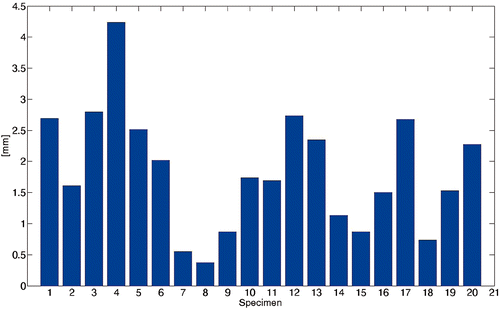
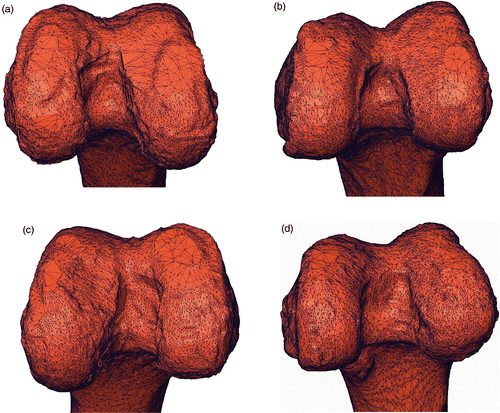
The variations in the e3D error ranged from 0.30 mm to 4.50 mm (). The e3D error distribution was in agreement with aspects of the corresponding intercondylar fossa. For instance, the intercondylar fossa of specimen #4 was quite irregular, and the corresponding e3D error was approximately 4.50 mm, whereas specimen #8 had a sharp and regular fossa with a corresponding e3D of approximately 0.30 mm (). The intercondylar fossae of specimens #12 and #13 were quite regular but smooth, leading to e3D values of approximately 2.70 mm and 2.40 mm, respectively.
Figure 6. Four representative surfaces of test specimens. The four specimens are (a) #4, (b) #8, (c) #12 and (d) #13 From visual inspection, it is easy to see that the intercondylar fossa of specimen #8 (b) is sharper than those of the other three specimens. As expected, the corresponding 3D fitting error is lower than for the other three specimens.
Comparison to clinical knowledge
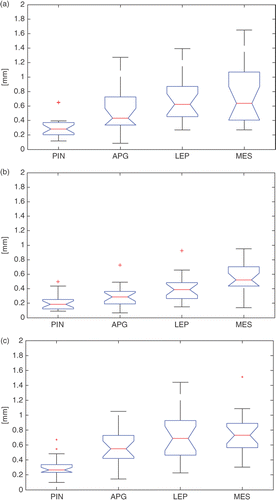
Manual identification of the point landmarks for a single femur took approximately 35 seconds on average. The intra-observer results showed differing variability (median of the values across the 20 specimens) for the three observers; however, the variation was less than 1 mm for all four point landmarks ().
Figure 7. Box-plots of the intra-observer variability {} across the 20 specimens for the four landmarks, namely, the PIN, the APG, the LEP, and the MES, for each of the three expert observers (a, b, c). On each box, the central mark is the median, the edges of the box are the 25th and 75th percentiles, and the whiskers extend to the most extreme data points, excluding outliers that are plotted individually as red crosses.
The inter-observer variability (point landmarks), expressed as the median of the values, was less than 2 mm, with a maximum of approximately 3.5 mm for the APG landmark (). The inter-observer variability for the PIN was significantly better that that for the LEP (p < 5e−6) and MES (p < 5e−5). The inter-observer variability for the APG (p < 0.020) was significantly worse than that for the other three landmarks.
Figure 8. Box-plots of the inter-observer variability for the four landmarks (PIN, APG, LEP, MES) and the corresponding WL and TEA. On each box, the central mark is the median, the edges of the box are the 25th and 75th percentiles, and the whiskers extend to the most extreme data points, excluding outliers that are plotted individually as red crosses.
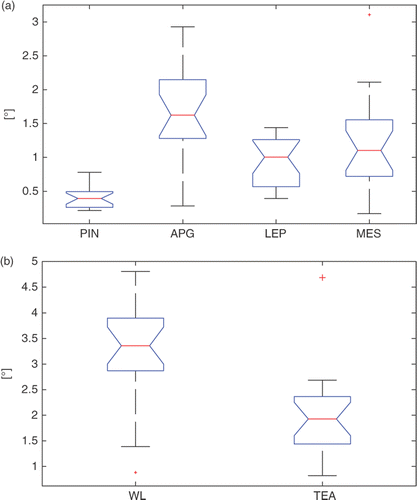
The inter-observer variability (axis directions) for the TEA (median error: ∼2°) was lower than that for the WL (median error: ∼3.5°) (). The difference between the two error distributions was statistically significant (p < 5e−4).
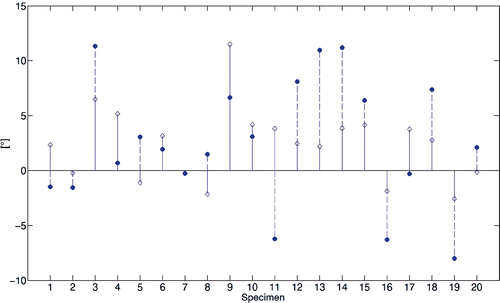
The comparison of the WL direction computed by the automated method with the corresponding direction computed by virtual palpation of the PIN and APG showed an angular skew error (mean ± SD), measured on the axial plane, of approximately 4.00° (SD: 2.64°) (). This difference was not statistically different (p < 0.60). The perpendicularity angle of the two WL axes with respect to the TEA ranged from approximately 92° to 78° and from 98° to 78°, respectively ().
Figure 9. Stem diagram of the angular skew between the two WL axes computed by virtual palpation and with the automated method.
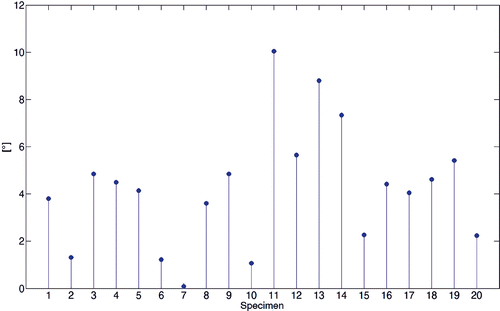
Figure 10. Stem diagram of the perpendicularity between the WL axes and the TEA. Diamond and dot marks refer to the WL computed by the automated method and the virtual palpation, respectively. Values greater than 0° indicate an external rotation of the WL relative to the TEA; smaller values indicate a relative internal rotation.
Discussion and conclusion
The Whiteside line in the distal femur is one of the traditional axes, along with the TEA and the posterior condylar line, used to assess the correct rotational alignment of the femoral component in TKR. The WL was proposed in the literature as an alternative to the TEA and has expanded its surgical role for a number of clinical and technical reasons.
Clinically, the use of the WL for establishing correct rotational alignment was reported to avoid patello-femoral and femoro-tibial problems Citation[22], Citation[30], Citation[35]. In fact, the patello-femoral joint is supposed to be addressed by orientation according to the WL, as it is the connection between the lowest points of the trochlea Citation[21], Citation[36]. Rotation of the femoral component perpendicular to the WL has the aim of bringing the trochlea of the implant into the same position as the preoperative natural trochlea. On non-arthrotic cadaver specimens, it was possible to show that an orientation according to the Whiteside line leads to a balanced mediolateral femoro-tibial pressure distribution across the range of motion Citation[37].
Technically, intra-operative identification of the landmarks (LEP and MEP) used to trace the TEA is difficult, due to the soft tissue underlying the epicondyles, and highly observer-dependent Citation[27], Citation[38], Citation[39]. While intra-operative identification of the WL is easier than for the TEA, as the intercondylar fossa is anatomically well-defined, it is also prone to inter-observer variability. Criticism of the use of the WL asserted that it is a very short landmark, and therefore even small uncertainties in palpation can lead to relevant (10°) rotational errors Citation[40], Citation[41]. In the pre-operative stage, virtual palpation of the two epicondyles in 2D images was also shown to suffer from low reproducibility Citation[42–44]. Taking advantage of improvements in imaging technologies and image processing techniques, easier manual analyses of the 3D geometry of the distal femur have recently been undertaken Citation[41], Citation[45–48]. Nonetheless, manual detection is still subjective and inevitably entails low (4.5 mm) reproducibility of the point landmarks, easily leading to angular skew of approximately 3–4° Citation[10], Citation[14].
Many studies of TKR have reported that alignment errors of the femoral component greater than 3.0°, as measured in the axial plane, are associated with less satisfactory function and accelerated rates of failure Citation[43], Citation[49–52]. This clearly means that any landmark axis used to determine such an alignment should be measured with an uncertainty of less than 3.0° with respect to the nominal value Citation[40], Citation[42]. In general, however, the nominal value is not known and the reproducibility of the measurement is used as a factor for assessing the measurement quality. This is acknowledged for anatomical and clinical measurements with regard to the functional axes of the distal femur.
To overcome subjectivity of the measurements, automatic methodologies, applied to CT images and bone surface models, have recently been proposed. Worz and Rohr Citation[7] presented a method, based on 3D parametric intensity models fitted to CT images, for the accurate localization of 3D anatomical point landmarks as bony protuberances. Analytic intensity models based on the Gaussian error function have been introduced to efficiently model tip-like, saddle-like, and sphere-like anatomical structures. They also provide an automated optimization method for adapting a particular model to a specific region of interest (ROI). However, the optimization can be disrupted by local minima, and global convergence has not been demonstrated for tiny landmark structures. Subburaj et al. Citation[10] proposed an automatic method for the detection of the anatomical landmarks of the distal femur and proximal tibia based on surface curvature analysis, including a priori knowledge of bone morphology. However, surface curvature estimation was shown to be sensitive to mesh quality and manual shape refinement is required. Li et al. Citation[53] presented an automatic method for computing a flexion-extension axis of the distal femur, as an alternative to the transepicondylar axis, based on 3D analysis of the medial and lateral condylar shapes. However, this method still required manual initialization of the sagittal cutting plane.
The present work followed this research approach and focused on the automatic identification of the WL with high reproducibility. The main result was that automatic detection of the WL on the 3D femur model is more repeatable than when the WL is traced through virtually palpated APG and PIN point landmarks and is in agreement with clinical knowledge. The algorithmic procedure involved the cross-sectioning of the surface through planes parallel to the frontal plane, the extraction of the 2D profile of the intercondylar fossa in each cross-section, the fitting of a fifth-order polynomial function to each profile, the computation of the point at the maximum curvature in each profile, and finally the robust fitting of a 3D line to the maximum curvature point dataset. The fifth-order polynomial function was found to be an optimal choice that avoided over-fitting. The method was validated using femur specimens from elderly subjects reconstructed from CT scans. The CT slicing resolution employed reflected on the overall measurement accuracy, and significantly higher errors might occur in the measurements if thicker slices are used. This would probably be true for both automated and manual methods, as the accuracy of the surface reconstruction depends on the original image resolution and slice thickness. In the present study, we took this effect into account by considering five different femur surface qualities specified in terms of the number of mesh faces (3k, 5k, 10k, 15k and 20k), which were used to test the repeatability of the algorithms. The 20k surface was considered as the reference for the others. As expected, we obtained better repeatability results for higher surface qualities than for lower surface qualities (). We provided an uncertainty measure of WL estimation that is related to the geometrical information concerning the aspect of the intercondylar fossa and its deviation from a regular sharp saddle shape. As shown, higher uncertainties correspond to irregular or smooth shapes ( and ).
The inter-observer variability of the LEP and MES point landmarks () was in a range comparable with results (2.6°, 3.6°) presented in the literature Citation[10], Citation[42], Citation[54]. The inter-observer variability of the PIN was significantly better than that of the other landmarks. In fact, the PIN represents an example of a well-defined morphological area that should be little affected by the image segmentation and surface reconstruction processes. In contrast, we found in some specimens that the medial and lateral epicondyles were quite smooth and that the LEP and MEP were very difficult to identify in accordance with the literature Citation[55]. The cross-checking analysis performed on the original CT images confirmed these results. While for the APG we obtained high intra-observer variability for each operator, the corresponding inter-observer variability was significantly worse than that for the other three landmarks. As the APG is an uncommon landmark, such a result can be explained by differing anatomical considerations of the deepest part of the patellar groove in the anterior direction among the three surgeons. The corresponding inter-observer variability of the WL confirmed such results (), consistent with assertions Citation[40], Citation[41] that uncertainties in palpation of the PIN and APG can lead to relevant rotational errors. The angular error between the two WL directions, using automated and manual methods, showed differences greater than 3.0° on average (). The orientation of the WL with respect to the TEA showed a trend towards external rotation () consistent with the literature Citation[27], Citation[40], Citation[41].
Some issues related to the overall approach have to be considered. The method required a 3D surface model of the femur, and it is relevant to note that relatively thin-slice (1-mm) CT scans were used in this study. This would require intense radiation exposure for the subjects of in vivo applications, which may prevent the immediate translation of the overall method to the clinical realm. In this study we showed that even low resolution of the femur surface, which can be obtained using thick-slice CT exams, provides repeatability of the WL lower than 2.5° (median error). In order to sensibly reduce the exposure, MRI acquisition can be considered as an alternative diagnostic technique that can be used for data collection according to ad hoc acquisition protocols for increasing the bone-tissue contrast. However, accurate reconstruction of bone morphology from MRI is still an issue as it requires at least 1.5-T scanners, which are not usually available in orthopaedic hospitals, and ad hoc acquisition protocols to increase the signal-to-noise ratio of the cortical bone Citation[15]. On the other hand, the model reconstruction is not straightforward, but it should be noted that some recent studies on automated methodologies for bone surface reconstruction from CT scans Citation[12], Citation[56–58], and even from low-dose digital stereoradiography Citation[59], showed that high accuracy and high speed were achievable.
The specimen dataset for the present study consisted of cadaveric specimens, which were evaluated by means of standard AP radiographs. The knee cartilage was examined for any degenerative changes and the distal femur bone was inspected for any obvious anatomic aberrations. No relevant degenerative modifications of the knee cartilage were detected. Slight early arthrosic damage was found in five specimens, and marginal osteophytes were found in 60% of the specimens, though only within the intercondylar notch region. Accordingly, the proposed method proved successful for all the specimens and the uncertainty distribution was quite effective in characterizing the morphological differences of the fossa across the specimens ( and ). However, larger morphological deviations of the fossa could require extension of the algorithm.
In conclusion, we can assert that the quantitative results show that the automated method is more repeatable than manual detection for Whiteside line determination. As demonstrated, the automated method is an operator-independent approach that can favorably assist the surgical planning, enabling reduced planning time by eliminating the need for manual landmark identification and increasing repeatability. The proposed methodological framework can be considered feasible for incorporation into a computerized planning system for TKR and may be extended to the design and modeling of personalized resection guides. While the use of personalized resection guides can avoid the need for other alignment instruments, it cannot account for intra-operative ligament balancing. Therefore, if a re-cut is necessary, the surgeon must switch to a traditional intervention with intramedullary instrumentation, thereby losing all the benefits of the custom resection guides. However, in resurfacing interventions limited to one or even two compartments (e.g., with the Journey Deuce implant from Smith & Nephew), where the anterior and posterior ligaments are spared, the use of personalized resection guides could be of genuine benefit and automated planning systems could be used more extensively.
References
- Lee K, Goodman SB. Current state and future of joint replacements in the hip and knee. Expert Rev Med Devices 2008; 5(3)383–393
- Siston RA, Giori NJ, Goodman SB, Delp S. Surgical navigation for total knee arthroplasty: A perspective. J Biomechanics 2007; 40: 728–735
- Pearle AD, Kendoff D, Musahl V. Perspectives on computer-assisted orthopaedic surgery: Movement toward quantitative orthopaedic surgery. J Bone Joint Surg Am 2009; 91(Suppl 1)7–12
- Stulberg SD, Loan P, Sarin V. Computer-assisted navigation in total knee replacement: Results of an initial experience in thirty-five patients. J Bone Joint Surg Am 2002; 84(2)90–98
- Seon JK, Song EK. Navigation-assisted less invasive total knee arthroplasty compared with conventional total knee arthroplasty. A randomized prospective trial. J Arthroplasty 2006; 21(6)777–781
- Davila JA, Kransdorf MJ, Duffy GP. Surgical planning of total hip arthroplasty: Accuracy of computer-assisted EndoMap software in predicting component size. Skeletal Radiol 2006; 35(6)390–393
- Worz S, Rohr K. Localization of anatomical point landmarks in 3D medical images by fitting 3D parametric intensity models. Med Image Anal 2006; 10: 41–58
- Niu Q, Chi X, Leu MC, Ochoa J. Image processing, geometric modeling and data management for development of a virtual bone surgery system. Comput Aided Surg 2008; 13(1)30–40
- Kao FC, Hsu KY, Tu YK, Chou MC. Surgical planning and procedures for difficult total knee arthroplasty. Orthopedics. 2009; 32(11)810
- Subburaj K, Ravi B, Agarwal M. Automated identification of anatomical landmarks on 3D bone models reconstructed from CT scan images. Comput Med Imaging Graph 2009; 33(5)359–368
- Suero EM, Hüfner T, Stübig T, Krettek C, Citak M. Use of a virtual 3D software for planning of tibial plateau fracture reconstruction. Injury 2010; 41(6)589–591
- Baldwin MA, Langenderfer JE, Rullkoetter PJ, Laz PJ. Development of subject-specific and statistical shape models of the knee using an efficient segmentation and mesh-morphing approach. Comput Methods Programs Biomed 2010; 97(3)232–240
- Cerveri P, Marchente M, Bartels W, Corten K, Simon JP, Manzotti A. Automated method for computing the morphological and clinical parameters of the proximal femur using heuristic modeling techniques. Ann Biomed Eng 2010; 38(5)1752–1766
- Cerveri P, Marchente M, Bartels W, Corten K, Simon JP, Manzotti A. Towards automatic computer-aided knee surgery by innovative methods for processing the femur surface model. Int J Med Robotics Comput Assist Surg 2010; 6(3)350–361
- Cerveri P, de Momi E, Marchente M, Baud-Bovy G, Scifo P, Barros RM, Ferrigno G. Method for the estimation of a double hinge kinematic model for the trapeziometacarpal joint using MR imaging. Comput Methods Biomech Biomed Eng 2010; 13(3)387–396
- Jun Y, Choi K. Design of patient-specific hip implants based on the 3D geometry of the human femur. Advances in Engineering Software 2010; 41(4)537–547
- Harrysson OL, Hosni YA, Nayfeh JF. Custom-designed orthopedic implants evaluated using finite element analysis of patient-specific computed tomography data: Femoral-component case study. Musculoskelet Disord 2007; 13(8)91
- Howell SM, Kuznik K, Hull ML, Siston RA. Results of an initial experience with custom-fit positioning total knee arthroplasty in a series of 48 patients. Orthopedics 2008; 31(9)857–863
- Matthews F, Messmer P, Raikov V, Wanner GA, Jacob AL, Regazzoni P, Egli A. Patient-specific three-dimensional composite bone models for teaching and operation planning. J Digit Imaging 2009; 22(5)473–482
- van Sint Jan S. Introducing anatomical and physiological accuracy in computerized anthropometry for increasing the clinical usefulness of modeling systems. Crit Rev Phys Rehabil Med 2005; 17(4)249–274
- Yau WP, Leung A, Liu KG, Yan CH, Wong LL, Chiu KY. Interobserver and intra-observer errors in obtaining visually selected anatomical landmarks during registration process in non-image-based navigation-assisted total knee arthroplasty. J Arthroplasty 2007; 22(8)1150–1161
- Taddei F, Ansaloni M, Testi D, Viceconti M. Virtual palpation of skeletal landmarks with multimodal display interfaces. Med Inform Internet Med 2007; 32(3)191–198
- Whiteside LA, Arima J. The anteroposterior axis for femoral rotational alignment in valgus total knee arthroplasty. Clin Orthopedics 1995; 321: 168–172
- Manili M, Muratori F, Fredella N. Whiteside line as the reliable surgical landmark for femoral rotation in total knee arthroplasty. Radiological validation. Eur J Orthop Surg Traumatol 2007; 17(6)599–602
- Siston RA, Cromie MJ, Gold GE, Goodman SB, Delp SL, Maloney WJ, Giori NJ. Averaging different alignment axes improves femoral rotational alignment in computer-navigated total knee arthroplasty. J Bone Joint Surg Am 2008; 90(10)2098–2104
- Churchill DL, Incavo SJ, Johnson CC, Beynnon BD. The transepicondylar axis approximates the optimal flexion axis of the knee. Clin Orthop Relat Res 1998, 356: 111–118
- Blaha JD, Mancinelli CA, Simons WH. Using the transepicondylar axis to define the sagittal morphology of the distal part of the femur. J Bone Joint Surg Am 2002; 84: S48–S55
- Luo C-F, Zeng B-F, Koshino T. Transepicondylar line and condylar line as parameters for axial alignment in knee arthroplasty. Knee 2004; 11(3)213–217
- Siston RA, Patel JJ, Goodman SB, Delp SL, Giori NJ. The variability of femoral rotational alignment in total knee arthroplasty. J Bone Joint Surg Am 2005; 87: 2276–2280
- Stoeckl B, Nogler M, Krismer M, Beimel C, de la Barrera JL, Kessler O. Reliability of the transepicondylar axis as an anatomical landmark in total knee arthroplasty. J Arthroplasty 2006; 21(6)878–882
- van der Linden-van der Zwaag HM, Valstar ER, van der Molen AJ, Nelissen RG. Transepicondylar axis accuracy in computer assisted knee surgery: A comparison of the CT-based measured axis versus the CAS-determined axis. Comput Aided Surg 2008; 13(4)200–206
- Picard F, Gregori A, Dean F, Mennessier A, Dillon J. Computer-assisted dynamic total knee arthroplasty using Whiteside's line for alignment. Orthopedics 2006; 19 (10 Suppl)S104–S107
- Cerveri P, Pedotti A, Borghese NA. Combined evolution strategies for dynamic calibration of video-based measurement systems. IEEE Trans Evol Comput 2001; 5: 271–282
- Shepstone L, Rogers J, Kirwan J, Silverman B. Shape of the intercondylar notch of the human femur: A comparison of osteoarthritic and non-osteoarthritic bones from a skeletal sample. Ann Rheum Dis 2001; 60(10)968–973
- Berger RA, Crossett LS, Jacobs JJ, Rubash HE. Malrotation causing patellofemoral complications after total knee arthroplasty. Clin Orthop Relat Res 1998, 356: 144–153
- Akagi M, Matsusue Y, Mata T, Asada Y, Horiguchi M, Iida H, Nakamura T. Effect of rotational alignment on patellar tracking in total knee arthroplasty. Clin Orthop Relat Res 1999, 366: 155–163
- Hanada H, Whiteside LA, Steiger J, Dyer P, Naito M. Bone landmarks are more reliable than tensioned gaps in TKA component alignment. Clin Orthop Relat Res 2007; 462: 137–142
- Jenny JY, Boeri C. Low reproducibility of the intra-operative measurement of the transepicondylar axis during knee replacement. Acta Orthop Scand 2004; 75(1)74–77
- Robinson M, Eckhoff DG, Reinig KD, Baugur MM, Bach JM. Variability of landmark identification in total knee arthroplasty. Clin Orthop Relat Res 2006; 442: 57–62
- Middleton FR, Simon H, Palmer SH. How accurate is Whiteside's line as a reference axis in total knee arthroplasty?. Knee 2007; 14(3)204–220
- Victor J, van Doninck D, Labey L, van Glabbeek F, Parizel P, Bellemans J. A common reference frame for describing rotation of the distal femur. A CT-based kinematic study using cadavers. J Bone Joint Surg Br 2009; 91-B(5)683–690
- Nagamine R, Miura H, Inoue Y, Urabe K, Matsuda S, Okamoto Y, Nishizawa M, Iwamoto Y. Reliability of the anteroposterior axis and the posterior condylar axis for determining rotational alignment of the femoral component in total knee arthroplasty. J Orthop Sci 1998; 3(4)194–198
- Kinzel V, Ledger M, Shakespeare D. Can the epicondylar axis be defined accurately in total knee arthroplasty?. Knee 2005; 12(4)293–296
- Yan CH, Yau WP, Ng TP, Lie WH, Chiu KY, Tang WM. Inter- and intra-observer errors in identifying the transepicondylar axis and Whiteside's line. J Orthop Surg 2008; 16(3)316–320
- Guy P, Krettek C, Mannss J, Whittall KP, Schandelmaier P, Tscherne H. CT-based analysis of the geometry of the distal femur. Injury 1998; 29(3)S-C16–S-C21
- Eckhoff DG, Bach JM, Spitzer VM, Reinig KD, Bagur MM, Baldini TH, Flannery BS. Three-dimensional mechanics, kinematics, and morphology of the knee viewed in virtual reality. J Bone Joint Surg Am 2005; 87A: 71–80
- Iwaki H, Pinskerova V, Freeman MA. Tibiofemoral movement 1: The shapes and relative movements of the femur and tibia in the unloaded cadaver knee. J Bone Joint Surg Br 2000; 82B: 1189–1195
- Martelli S, Pinskerova V, Visani A. Anatomical investigations on the knee by means of computer-dissection. J Mech Med Biol 2006; 6: 55–73
- Jeffery RS, Morris RW, Denham RA. Coronal alignment after total knee replacement. J Bone Joint Surg 1991; 73B: 709–714
- Oswald MH, Jakob RP, Schneider E, Hoogewoud HM. Radiologic analysis of normal axial alignment of femur and tibia in view of total knee arthorplasty. J Arthroplasty 1993; 8(4)419–426
- Ritter MA, Faris PM, Keating EM, Meding JB. Postoperative alignment of total knee replacement: Its effect on survival. Clin Orthop Relat Res 1994, 299: 153–156
- Dorr LD, Boiardo RA. Technical considerations in total knee arthroplasty. Clin Orthop Relat Res 1986, 205: 5–11
- Li K, Tashman S, Fu F, Harner C, Zhang X. Automating analyses of the distal femur articular geometry based on three-dimensional surface data. Ann Biomed Eng 2010; 38(9)2928–2936
- Victor J, van Doninck D, Labey L, Innocenti B, Parizel PM, Bellemans J. How precise can bony landmarks be determined on a CT scan of the knee?. Knee 2009; 16(5)358–365
- Yoshino N, Takai S, Ohtsuki Y, Hirasawa Y. Computed tomography measurement of the surgical and clinical transepicondylar axis of the distal femur in osteoarthritic knees. J Arthroplasty 2001; 16(4)493–497
- Schmutz B, Reynolds KJ, Slavotinek JP. Development and validation of a generic 3D model of the distal femur. Comput Methods Biomech Biomed Eng 2006; 9: 305–312
- Gelaude F, Vander Sloten J, Lauwers B. Accuracy assessment of CT-based outer surface femur meshes. Comput Aided Surg 2008; 3(4)188–199
- Bryan R, Mohan PS, Hopkins A, Galloway F, Taylor M, Nair PB. Statistical modelling of the whole human femur incorporating geometric and material properties. Med Eng Phys 2010; 32(1)57–65
- Laporte S, Skalli W, de Guise JA, Lavaste F, Mitton D. A biplanar reconstruction method based on 2D and 3D contours: Application to the distal femur. Comput Methods Biomech Biomed Eng 2003; 6(1)1–6
