Abstract
A CT-based imaging technique to investigate ulnohumeral joint congruency of elbows undergoing physiologic flexion is introduced. This technique, which employed landmark registration and a previously developed inter-bone distance algorithm, was validated experimentally. Results obtained with this imaging technique were validated in a single specimen by comparing the resulting joint congruency maps to results obtained with experimental casting in a static position. Additionally, the accuracy of the registration technique was assessed in four specimens using fiducial and target registration error to evaluate the positional and angular accuracy. Preliminary data from an intact cadaveric elbow was shown to demonstrate the utility of this technique. The overall accuracy of the registration was better than 1 mm, and the congruency maps showed excellent correspondence with the casting, validating the use of a CT-based imaging technique to examine the congruency of joints undergoing quasi-static flexion.
Introduction
Understanding of joint contact mechanics is important when considering the etiology of various degenerative joint diseases such as osteoarthritis. Osteoarthritis commonly occurs as a result of a traumatic event to an articulation; however, the mechanism and sequence of this interaction is not well understood[Citation1–5. The injury could be an articular surface fracture, joint dislocation, or disruption of the ligaments. While direct articular cartilage trauma can result in arthritis, it is hypothesized that altered cartilage contact patterns and forces due to abnormal joint kinematics as a consequence of mal-alignment or instability are a more common cause of osteoarthritis in a genetically predisposed joint Citation[1], Citation[3], Citation[6]. Currently, no appropriate techniques have been developed to quantify articular mechanics in joints undergoing physiologic motion, and certainly not in pathologic and surgically treated scenarios. This consideration is of extreme clinical importance, as joint instability typically manifests itself with symptoms emanating from the joint. Amongst the many potential applications of such a technique would be the investigation of functional anatomy, providing assistance in intra-operative joint alignment, and – most importantly – investigation of the etiology of various joint articular diseases following injury.
In vivo studies of joint surface interactions have either been limited to a truncated range of motion[Citation7–9, or have involved patients undergoing repeated motion, as is the case when using cine MRI Citation[10]. Surface markers can be attached to patients undergoing motion in gait laboratories and when using various stereometric analysis systems Citation[9], Citation[11–13]. However, surface trackers introduce skin artifacts and therefore limit the accuracy of such techniques. Recently, markerless radiostereometric analysis (RSA) techniques have been developed, but these techniques are also limited to a small field of view, and therefore range of motion, and additionally yield data sets which are tedious and time-consuming to analyze Citation[11], Citation[12], Citation[14].
The objective of this study was to develop and validate a non-destructive imaging approach to examine joint contact mechanics of the ulnohumeral joint undergoing simulated elbow flexion. An inter-bone distance algorithm has been previously developed in our laboratory using reconstructed bone models obtained from X-ray computed tomography Citation[15]. This technique has so far only been used to examine statically loaded joints. Therefore, the objective of the present study was to develop a registration technique that would allow physiologic motion to be tracked and registered to 3D reconstructions. The inter-bone distance algorithm is then applied to these rendered motions to assess joint congruency of joints undergoing continuous motion. Using the technique described in this study, joint congruency can be quantified non-invasively and during continuous elbow flexion, as the technique does not rely on direct access to the joint and uses motion data collected during testing. The capability of this registration and congruency algorithm was validated using the gold standard, experimental casting Citation[16]. We also assessed the accuracy of the registration technique employed, with fiducial and target registration error metrics being used to evaluate the positional and angular accuracy of the registration technique.
Materials and methods: Elbow simulator experimental protocol
Volumetric image acquisition: X-ray computed tomography
Four intact cadaveric upper extremities (from males aged 77 ± 3 yrs) were employed in this study. A CT scan of each specimen was obtained prior to testing (the pre-testing CT) using a 64-slice scanner (GE Discovery CT750 HD, Waukesha, WI). Approximately 350 slices were acquired for each specimen, with a field of view set at 20 × 20 cm and a 512 × 512 reconstruction matrix (200 mA, 120 kVp). The size of the voxels was approximately 0.6 × 0.6 × 0.625 mm.
Specimen preparation
Prior to testing, each specimen was thawed at room temperature for 20 hours. The mid-diaphysis of the humerus was clamped to the base of an elbow simulator after being denuded of soft tissue. The tendons of the relevant muscles used in elbow flexion and extension were exposed, and sutures were secured to each tendon. Using cables, servomotors were attached to the triceps (TRI), biceps brachii (BIC) and brachialis (BRA) tendons, while pneumatic actuators were attached to the tendons of the brachioradialis, pronator teres, and supinator and wrist flexors/extensors. All skin incisions were closed using #2 Vicryl skin suture, and the specimen was kept hydrated throughout testing using normal saline.
Elbow motion simulator
Elbow joint flexion was simulated using the aforementioned computer-controlled actuators and motors Citation[17]. Flexion was examined by selecting frames of motion that corresponded to 15°, 30°, 45°, 60°, 75°, 90°, 105° and 120° of elbow flexion. Active motion in this study was achieved with the elbow in the valgus gravity-dependent position (). Throughout elbow flexion, the ulna articulated and tracked around a stationary humerus. To track the motion of the ulna with respect to the humerus, 3D optical position sensors were used (Optotrak Certus®, Northern Digital Inc., Waterloo, ON, Canada). The Optotrak motion-capture system is an infrared-based tracking system. The position sensors themselves are “active” trackers which emit infrared light, allowing the camera to accurately track the sensors’ position. For the humerus, two position sensors were attached to the simulator near the humerus. The motion of the humerus with respect to the simulator was constant. For the ulna, two position sensors were rigidly attached to the bone using a bone mount that was securely fixed to the distal-dorsal region of the ulna. Two markers were fixed to allow the camera to track the motion of the ulna throughout flexion. To maintain an in-plane accuracy of 0.1 mm and 0.15 mm perpendicular to the camera, a direct line of sight between the camera and the position sensors was maintained and kept within 2.5 m.
Fiducial configuration/placement
Subsequent to testing, all soft tissues were removed and the elbows were disarticulated for the target registration experiment. Four fiducial markers (19-mm optically reflective nylon spheres attached to threaded screws) were secured to the denuded bones. Care was taken to ensure that two fiducials were placed distally and two proximally as well as medially and laterally. To assess the target registration error (TRE), a fifth fiducial was positioned anteriorly on the articulation (region of interest) of the humerus and ulna (). The center of each fiducial marker was localized using a calibrated cupped stylus.
Figure 1. Fiducial configuration. (A) Four fiducial markers were attached to the humerus, two medially and two laterally, both proximally and distally around the joint articulation. A fifth fiducial was positioned on the articulation (region of interest) to measure TRE. (B) Four fiducial markers were attached to the ulna, one on the olecranon, one on the coronoid, and two distal markers on the medial and lateral side. A fifth fiducial was also positioned on the greater sigmoid notch (area of interest) to measure TRE.
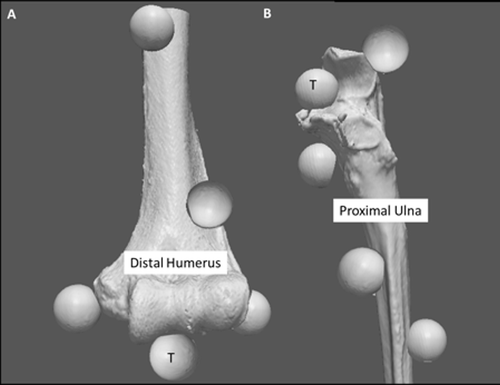
Image acquisition – post-experimental testing
A second volumetric image of each specimen was acquired after testing with the fiducial markers mounted. Approximately 350 slices were acquired using the same CT scanning parameters as employed in the pre-testing scan.
Materials and methods: Experimental cast validation
Image acquisition
A CT scan of an additional single cadaveric specimen (from a 69-year-old male) was obtained prior to testing (the pre-testing CT) using a 64-slice scanner (GE Discovery CT750 HD). Approximately 350 slices were acquired for each specimen, with the field of view set at 20 × 20 cm and a 512 × 512 reconstruction matrix (100 mA, 140 kVp). The size of the voxels was approximately 0.6 × 0.6 × 0.625 mm. The overall joint space was manually measured from this pre-testing CT. Using custom software, points were manually identified across the two subchondryl bone surfaces in a volumetric CT image using two orthogonal planes. The distance between these two sets of points (two opposing subchondral bone surfaces) was used to approximate the overall thickness of the joint space for this particular specimen. This value was then inserted into the inter-bone distance algorithm to measure the surface area across the joint, which was compared to the experimental cast.
Specimen preparation
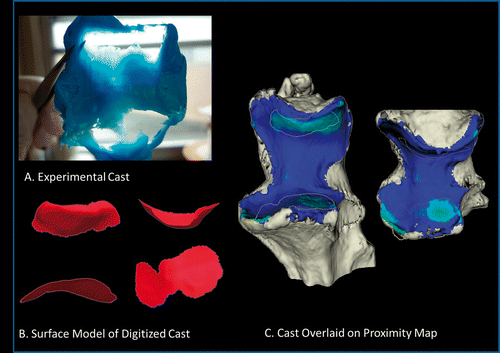
The specimen was completely denuded of all soft tissue. Prior to testing, both the humeral and ulnar articular surfaces were submerged in saline to ensure that all surfaces were well hydrated. The humerus was clamped into the simulator and position trackers were attached to the simulator and ulna as described above. Four fiducial markers were rigidly fixed to the denuded bone in a configuration similar to that described previously for the TRE experimental protocol. Experimental casting material (Reprosil Medium Body Vinyl Polysiloxine Impression Material, DENTPLY International, Inc., York, PA) was prepared and placed in the greater sigmoid notch of the proximal ulna. The ulna was positioned on the humerus in a reduced fashion and rigidly held until the cast set. A recording of the static position was acquired once the cast had solidified. The ulna was then removed from the humerus and the cast positioned on the proximal ulna. Using an optically tracked calibrated pen-point stylus, the region of the experimental cast which was vacant (corresponding to the area of joint contact) was digitized. A 3D surface model of the resulting contact patch was constructed using MATLAB (MathWorks, Inc., Natick, MA), and the surface area of this patch, corresponding to the total contact area, was calculated. The cast was then photographed using a digital camera, with the cast placed in front of a light source to visualize regions where the surfaces were in close proximity, but not necessarily in contact. Adjacent to the cast, a stepped calibration phantom was used to calibrate the relative thickness of the casting material. Additionally, to compare the computational and cast techniques, an edge filter was used to extract the surface of the digitized cast, which was then overlaid onto the proximity map. The measured joint space was used as a threshold in the inter-bone distance algorithm to compare the results obtained using the cast and the algorithm.
Subsequent to the casting, 20 recordings of each fiducial marker/target were digitized with respect to the corresponding bone position sensor, using a cupped stylus. The geometric center of the fiducial/target was found by averaging the position recordings.
A post-testing CT scan was acquired with the fiducial markers secured to the humerus and ulna using the same CT scanning techniques as for the pre-testing CT.
Materials and methods: Data analysis
Three-dimensional reconstruction
The CT images were processed using custom software, and surface models were created using the Marching Cubes algorithm within the VTK Version 4.2.1 (Visualization Toolkit, Kitware, Clifton Park, NY) Citation[18]. A manually set segmentation threshold was chosen to visualize only the bony aspects of the cadaveric specimen. This threshold was verified by viewing the 2D slice data overlaid with the reconstructed 3D bone to ensure that the selected threshold corresponded accurately to the outer surface of the imaged osseous anatomy. The subchondral regions below the articular surface of the humerus and ulna were manually segmented into separate 3D models. Additionally, planes were created to divide the ulnar subchondral bone surface into medial-superior, medial-inferior, lateral-superior and lateral-inferior zones (). To create these zones, a sagittal plane was created which intersected the olecranon and coronoid process, and a transverse plane was created along the transverse ridge of the ulna (typically devoid of cartilage) on the greater sigmoid notch.
Figure 2. Ulnar subchondral zones. Four zones were created by dividing the ulnar subchondral bone medially and laterally down the ridge of the greater sigmoid notch (extending from the olecranon to the coronoid process). A second plane was created along the transverse ridge dividing the ulna into superior and inferior regions.
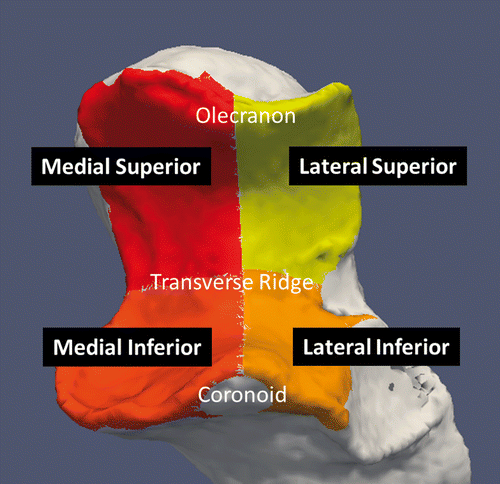
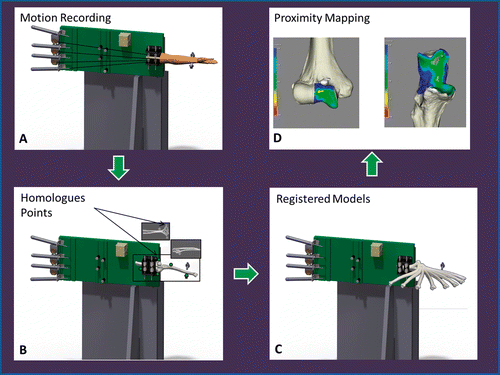
Figure 3. Registration schematic and implementation of proximity mapping. (A) Simulated elbow flexion is achieved using cadaveric specimens and the upper extremity motion simulator (shown here in the valgus gravity-dependent position). (B) Subsequent to testing, all soft tissues are removed and fiducial markers are secured for registration purposes. A second volumetric CT scan is acquired of the humerus and ulna, and homologous points are used for registration. (C) The result of this registration is a visualization of the 3D rigid-body motion of the ulna, with respect to the humerus, throughout elbow flexion. (D) Subsequent to registration of the rigid bodies, the proximity mapping technique is applied to the registered models, and the overall joint congruency can be identified for the humerus and ulna.
Registration
Subsequent to testing, anatomical landmarks were digitized using a calibrated pointed stylus. On the humerus, a trace of the capitellum, the trochlear groove, and the perimeter of the humeral shaft was obtained using the tracked pointed stylus. A sphere was fitted to the digitized capitellum using a least-squares algorithm to determine its center. The trochlear groove and humeral shaft trace were also circle-fitted in a similar manner to determine the center of each trace. Orthogonal planes to the flexion/extension axis for the humerus and ulna were oriented proximally and anteriorly. The center of the capitellum and trochlea defined the flexion/extension axis of the humerus. On the ulna, a trace of the greater sigmoid notch ridge was digitized and circle-fitted, and a single point on the distal ulnar styloid was digitized as well as a medial point, not on the anatomy, near the proximal end of the ulna. The perpendicular plane of the center of the greater sigmoid notch defined the flexion/extension axis of the ulna. Orthogonal planes to the flexion/extension axis for the humerus and ulna were oriented proximally and anteriorly. Kinematic data obtained from the tracking system were then transformed to the anatomic coordinate systems to express the motion of the ulna with respect to the humerus throughout elbow flexion. For the post-hoc analysis, the position of each fiducial was transformed using the tracked motion obtained during testing.
Bone surface models from the pre-testing CT were registered to the post-testing CT (containing the fiducial markers) using the Iterative Closest Point (ICP) surface-based registration algorithm Citation[19]. To ensure optimal alignment, three anatomical landmarks were initially selected on each surface model and a paired-point registration was performed for coarse alignment. Using the 3D reconstructions of the fiducials, the centers of each fiducial were localized with respect to the CT coordinate system using a least-squares sphere-fit algorithm.
Homologous fiducial markers in both the CT coordinate system and the laboratory coordinate system () were used in the landmark transform to produce a registration transformation matrix relating the CT to the laboratory coordinate system. This transform was applied to the 3D bony models of the humerus and ulna separately, allowing their relative positions to be rendered according to the tracked motion ().
Similarly for the validation, paired-point landmark registration was also used to register the position and orientation of the 3D reconstructed bones to their relative positions. However, no coordinate system was used in this registration.
Registration error
The fiducial registration error (FRE) was obtained to measure the overall correspondence between these homologous rigid-body landmarks. The FRE was determined by measuring the root mean squared distance between homologous fiducial markers after registration (expressed in mm). In addition to determining the FRE, the target registration error (TRE) was also examined. Four fiducial markers were attached to each rigid body being registered, and a fifth fiducial (target) was also secured to each bone on the articulation. The TRE is the difference in position of a target marker located on the region of interest (other than the fiducials) after registration Citation[20]. The configuration of the fiducial markers was optimized to be consistent with previously reported guidelines Citation[21].
Proximity mapping
To measure the joint congruency, a previously developed inter-bone distance algorithm was used Citation[15]. The algorithm uses vertices of polygonal surfaces as points to measure relative distances between two surfaces defined by polygonal meshes. The overall proximity of the opposing bone surfaces can be visualized using a proximity map (inter-bone distance less than 4 mm). Additionally, “levels of proximity” corresponding to levels of inter-bone distance values were employed to measure the surface area of the subchondral bone within high proximity (<0.5 mm), medium proximity (<1.5 mm), low proximity (<2.5 mm) and ultra-low proximity (<3.5 mm). shows the final step in the overall technique with the implementation of the proximity mapping. For visualization, inter-bone distances were displayed using an iso-contoured proximity map (assigning distances a unique colour) that was then projected onto the surface of the articulation. A scale (0 mm: red; 4 mm: blue) was chosen to display all of the inter-bone distances that are less than 4 mm, while all distances greater than 4 mm are displayed as dark blue. The inter-bone distance algorithm can be used to investigate the joint congruency of the humeral or ulnar subchondral bone, and likewise for each of the four zones on the ulnar subchondral bone, during any frame of motion throughout elbow flexion.
Results
Elbow motion simulation
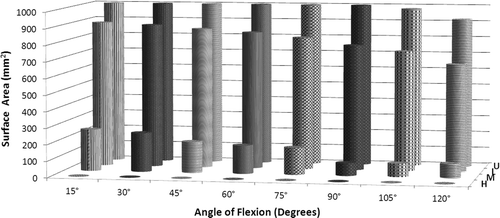
To illustrate the capabilities of this technique, simulated active elbow flexion was analyzed in a single specimen using the inter-bone distance algorithm to measure overall joint congruency at 15°, 30°, 45°, 60°, 75°, 90°, 105° and 120° of elbow flexion in the valgus gravity-dependent position. This congruency was measured for each level of proximity across the entire humeral/ulnar bone surface and within each zone. The implementation of the proximity map and inter-bone distance algorithm in the registration algorithm is shown for this one specimen in ; however, the data presented are representative of the type of information regarding joint congruency that can be obtained using the described technique. Proximity maps for the humerus were also obtained, but are not shown here. In this single specimen, it appears that the total surface area of the close-proximity region decreases with increasing flexion. Proximity levels for high, medium, low and ultra-low proximity on the entire ulnar surface are shown in . The area of the proximity region (<4 mm) did not exceed 1000 mm2 throughout elbow flexion. The total surface area of the ulnar subchondral bone was 1511.1 mm2. Also, for the single specimen shown, there is an overall decrease in the size of the proximity region with increasing flexion for each level of proximity. The exception to this is the high-proximity region, which increases in late flexion, corresponding to the orange-yellow contour noted on the proximity map.
Figure 4. Proximity maps for the ulna throughout elbow flexion. Anterior view of the ulna showing the regions of close proximity (less than 4 mm).
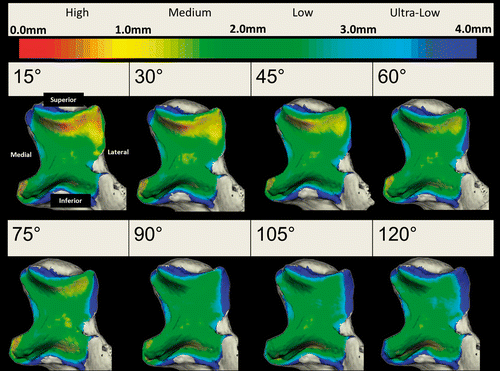
Figure 5. Surface area values for each level of proximity (high, medium, low and ultra-low) are shown throughout elbow flexion.
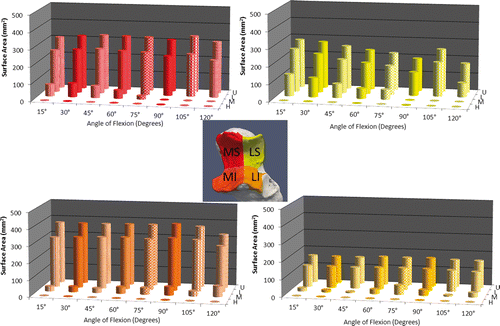
Proximity levels were also examined for each of the four ulnar zones in this single specimen, as shown in . Medium-level proximity (<1.5 mm), which corresponds to the yellow-green contour interface, exhibited the most difference between zones.
Figure 6. Surface area values for each zone at each level of proximity (high, medium, low and ultra-low) are shown as a function of elbow flexion.
Target registration error
The mean TRE was 0.24 ± 0.1 mm for the distal humerus and 0.88 ± 0.3 mm for the proximal ulna. The mean fiducial registration error (FRE) was 0.25 ± 0.1 mm for the humerus and 0.29 ± 0.1 mm for the ulna. shows the individual TRE and FRE values for each specimen.
Table I. Fiducial and target registration error. Registration values are given for each specimen for the humerus and ulna, respectively.
Experimental casting validation
shows a comparison of the proximity map obtained using the technique as described and the gold-standard experimental cast. The vacant regions in the cast correspond to regions of joint contact. Comparing the proximity map with the casting technique, these two representations of the surface articular interactions are very coincidental. The total contact area of the cast was 362.10 mm2, and the average joint space distance as measured for this specimen was 2.87 mm. shows the cast contact area overlaid on the proximity map, displaying the surface area across the ulna that was within 2.87 mm of proximity. Using this value as a threshold in the inter-bone distance algorithm, the resulting surface area was 429.06 mm2. This value deviated from the contact area as determined by the cast by 17.35%.
Figure 7. Proximity mapping validation using experimental casting. The proximity maps are shown and compared to the experimental cast. The overall qualitative similarity of the cast and proximity map was assessed and used to validate the implementation of the proximity mapping technique with the registration developed in this study to examine joint surface interactions.
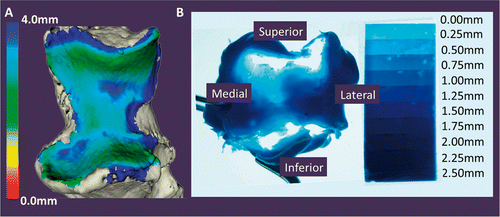
Figure 8. Comparison of experimental cast and proximity map. (A) Experimental cast. (B) The vacant regions of the cast, corresponding to regions of joint contact, were digitized using a tracked stylus. A surface model was created from this point cloud. An edge extraction filter was used to obtain the perimeter of this digitized surface. (C) The digitized cast is overlaid onto a proximity map showing the surface area on the ulna. The threshold used to generate this map is 2.87 mm, as measured from the pre-operative CT. There is 17.35% difference between the experimental cast digitization and the surface area obtained from the computational method.
Discussion
In both in vivo and in vitro studies, repeatable motion must be achieved in order to detect possible changes in articular tracking that may occur following injury or reconstruction of a joint. In vivo studies often lack accuracy and repeatability of the measured motion, making it difficult to detect subtle changes in motion pathways. In vitro studies take place in a controlled environment and typically investigate joint mechanics using simplified non-physiologic loading protocols[Citation22–24. In general, any static simplified motion does not inherently represent true physiologic motion because dynamic stabilizers and inertial effects are ignored. Therefore, new techniques must be developed to accurately examine joint surface interactions in joints undergoing large ranges of motion in continuous physiologic motion.
The registration technique developed in this study allowed the position and orientation of the two rigid bodies (reconstructed 3D bone models of the humerus and ulna obtained from CT data) to be rendered according to the tracked continuous motion generated by a repeatable elbow motion simulator. Using this approach, any frame of tracked motion can be isolated, registered and rendered using the bony surfaces and landmark fiducials for registration. It is therefore possible to investigate the effect of bony and soft tissue injuries on joint congruency, and ultimately to evaluate the efficacy of various reconstructive procedures in restoring joint tracking to that of the intact, uninjured state. Visualization of mal-alignment caused by various injuries/traumatic events can predict the likelihood of excess cartilage wear and the locations on the articulating surface where it might occur.
In this study, intact motion of a single cadaveric specimen undergoing simulated elbow flexion was examined to show the utility of the described technique. However, these results may not be representative of the typical ulnohumeral joint congruency patterns of a larger population.
The implementation of the inter-bone distance algorithm was validated using the experimental casting approach at a single static angle of flexion. The overlaid regions of the cast on the proximity map show good correspondence. For this validation, the computational method overestimated the contact area by 17.35%. Digitizing the vacant regions of the cast is error-prone, because it is tedious and difficult to define the boundary of the contact region on the cast. There are regions on the cast that are not entirely vacant, but are “thin” regions corresponding to regions that are in “close” but not “full” contact. Additionally, the vacant regions were digitized on the articular surface of the ulna; however, the proximity map is shown on the subchondral bone of the ulna model. Therefore, this could introduce a shift in the location of the contact, as well as explain why in some regions it appears as though the cast outline is on the edge of the bone. Finally, a single value of 2.87 mm was used as a threshold to joint space. However, regional variations in the thickness of the cartilage, especially near the transverse ridge, cause the thickness of the overall joint space to change. Therefore, by assuming a uniform joint space, an error may be introduced into the calculated contact area.
The mean fiducial registration error was less than 0.30 mm. The FRE is used to ensure that the experimental set-up and data acquisition software and tracking accurately collected data. In this study, the locations of the fiducials were accurately identified and corresponded to the CT fiducial markers. Additionally, the fiducials were properly segmented and sphere-fitted in the CT model, and corresponded to the digitized fiducial markers in the laboratory. The overall target registration error for this study for the humerus and ulna was less than 1 mm. Since the average joint space found in this elbow was approximately 2.87 mm, we believe that a registration error of 1 mm is acceptable when designing a registration algorithm.
The TRE for the humerus was smaller than that for the ulna. During simulation, the ulna tracks around a stationary humerus. The tracking accuracy of the optical tracking system is anisotropic, with the highest error being found in the axis perpendicular to the camera (a difference in tracking accuracy of 0.05 mm between the in-plane and out-of-plane directions). As it tracks around the humerus, the ulna moves in the plane perpendicular to the camera as well as in-plane, and this might reduce the overall registration accuracy of the ulna as compared to the stationary humerus. This may explain why there is a discrepancy in the registration error found between the humerus and ulna. Additionally, during the post-hoc kinematic analysis used to generate the positional transformation matrices of the humerus and ulna, the relationship of the ulna is examined with respect to the humerus. Therefore, any errors in the tracking of the two rigid bodies are compounded in this transformation, reducing the registration accuracy for the ulna to become less than that for the humerus.
compares the registration accuracy values reported in previous studies by other groups[Citation24–27 to the results of the current study. Sadowsky et al. used paired-point registration and obtained registration values less than 0.5 mm Citation[27]. However, that study used a simplified phantom, and such a level of accuracy might be difficult to achieve in an experimental protocol examining bony surfaces with more complex geometries. In the current study, it was difficult to position the fiducials such that the centroid of the configuration corresponded to the articulation, because the joint (area of interest) is located at the end of the long bones. Surface-based registration was employed in several of these studies, but with accuracy values lower than that of the current study. The use of surface-based registration is essential when using non-invasive approaches for registration, but this method has insufficient accuracy to examine joint articular tracking as reported in this in-vitro study Citation[26], Citation[27]. To achieve the level of accuracy of the current study, a large region of the bony surface would be required for the registration, making the surface-based technique also invasive.
Table II. Comparison of registration error to previously developed techniques.
The techniques employed in the present study are limited by the accuracy of the registration. It has been shown that registration employing both point-based and surface-based methods can significantly increase the accuracy of registration compared to using landmark- or surface-based registrations in isolation Citation[28]. Therefore, future applications of this registration approach will include some surface digitizations to increase its accuracy. Additionally, refined approaches to attaching the fiducial markers will be examined, as the current technique is both time-consuming and tedious, requiring complete disarticulation and dissection of the bones. For example, implanting tantalum or brass beads (0.5–1.5 mm in diameter) may reduce the overall time required to fixate the fiducial markers and ensure that the fiducials themselves will not be deflected during transportation between the laboratory and the CT suite. Currently, the registration and data analysis occur post-experimentation. Therefore, future investigations using this technique will aim at improving it such that real-time examination of the articular surface interactions can be achieved.
A novel approach for examining joint articular tracking has been developed and validated in this study. The accuracy of this registration was also assessed under experimental conditions similar to the actual in vitro experimental protocol. This technique is accurate and robust, and can be applied to any joint undergoing tracked simulated motion in vitro. This technique can be used to examine the effect of various injuries and the resulting mal-alignment on the joint cartilage surface, and can therefore be used to develop and evaluate new surgical techniques and rehabilitation approaches.
Acknowledgments
The authors would like to acknowledge Donna Findlay for her assistance as an X-ray CT technologist.
Declaration of interest: The authors report no declarations of interest.
References
- Hunter DJ, Sharma L, Skaife T. Alignment and osteoarthritis of the knee. J Bone Joint Surg Am 2009; 91(Suppl 1)85–89
- Hunter DJ, Zhang Y, Niu J, Tu X, Amin S, Goggins J, Lavalley M, Guermazi A, Gale D, Felson DT. Structural factors associated with malalignment in knee osteoarthritis: The Boston osteoarthritis knee study. J Rheumatol 2005; 32(11)2192–2199
- Felson DT, Lawrence RC, Dieppe PA, Hirsch R, Helmick CG, Jordan JM, Kington RS, Lane NE, Nevitt MC, Zhang Y, et al. Osteoarthritis: New insights. Part 1: The disease and its risk factors. Ann Intern Med 2000; 133(8)635–646
- Honkonen SE. Degenerative arthritis after tibial plateau fractures. J Orthop Trauma 1995; 9(4)273–277
- Buckwalter JA, Lane NE. Athletics and osteoarthritis. Am J Sports Med 1997; 25(6)873–881
- Van de Velde SK, Bingham JT, Hosseini A, Kozanek M, DeFrate LE, Gill TJ, Li G. Increased tibiofemoral cartilage contact deformation in patients with anterior cruciate ligament deficiency. Arthritis Rheum 2009; 60(12)3693–3702
- Anderst WJ, Tashman S. A method to estimate in vivo dynamic articular surface interaction. J Biomech 2003; 36(9)1291–1299
- Li G, Wan L, Kozanek M. Determination of real-time in-vivo cartilage contact deformation in the ankle joint. J Biomech 2008; 41(1)128–136
- Boyer PJ, Massimini DF, Gill TJ, Papannagari R, Stewart SL, Warner JP, Li G. In vivo articular cartilage contact at the glenohumeral joint: Preliminary report. J Orthop Sci 2008; 13(4)359–365
- Sheehan FT, Zajac FE, Drace JE. Using cine phase contrast magnetic resonance imaging to non-invasively study in vivo knee dynamics. J Biomech 1998; 31(1)21–26
- Bey MJ, Kline SK, Zauel R, Lock TR, Kolowich PA. Measuring dynamic in-vivo glenohumeral joint kinematics: Technique and preliminary results. J Biomech 2008; 41(3)711–714
- Bey MJ, Zauel R, Brock SK, Tashman S. Validation of a new model-based tracking technique for measuring three-dimensional, in vivo glenohumeral joint kinematics. J Biomech Eng 2006; 128(4)604–609
- Kedgley AE, Jenkyn TR. RSA calibration accuracy of a fluoroscopy-based system using nonorthogonal images for measuring functional kinematics. Med Phys 2009; 36(7)3176–3180
- Bey MJ, Kline SK, Tashman S, Zauel R. Accuracy of biplane x-ray imaging combined with model-based tracking for measuring in-vivo patellofemoral joint motion. J Orthop Surg Res 2008; 3: 38
- Lalone EA, McDonald CP, Ferreira LM, Peters TM, King GJW, Johnson JA, Development of an image-based technique to examine joint congruency at the elbow. Comput Methods Biomech Biomed Engin 2012 (In press)
- Stormont TJ, An KN, Morrey BF, Chao EY. Elbow joint contact study: Comparison of techniques. J Biomech 1985; 18(5)329–336
- Ferreira LM, Johnson JA, King GJ. Development of an active elbow flexion simulator to evaluate joint kinematics with the humerus in the horizontal position. J Biomech 2010; 43(11)2114–2119
- Schroeder W, Martin K, Lorensen B. The Visualization Toolkit. Prentice-Hall PTR, New Jersey 1998
- Besl PJ, McKay ND. A method for registration of 3-D shapes. IEEE Trans Pattern Anal Machine Intell 1992; 14: 239–256
- Maurer CR, Jr, Fitzpatrick JM, Wang MY, Galloway RL, Jr, Maciunas RJ, Allen GS. Registration of head volume images using implantable fiducial markers. IEEE Trans Med Imaging 1997; 16(4)447–462
- West JB, Fitzpatrick JM, Toms SA, Maurer CR, Jr, Maciunas RJ. Fiducial point placement and the accuracy of point-based, rigid body registration. Neurosurgery 2001; 48(4)810–816
- Eckstein F, Löhe F, Hillebrand S, Bergmann M, Schulte E, Milz S, Putz R. Morphomechanics of the humero-ulnar joint: I. Joint space width and contact areas as a function of load and flexion angle. Anat Rec 1995; 243(3)318–326
- Brechter JH, Powers CM. Patellofemoral joint stress during stair ascent and descent in persons with and without patellofemoral pain. Gait Posture 2002; 16(2)115–123
- Fischer KJ, Manson TT, Pfaeffle HJ, Tomaino MM, Woo SL. A method for measuring joint kinematics designed for accurate registration of kinematic data to models constructed from CT data. J Biomech 2001; 34(3)377–383
- McDonald CP, Brownhill JR, King GJ, Johnson JA, Peters TM. A comparison of registration techniques for computer- and image-assisted elbow surgery. Comput Aided Surg 2007; 12(4)208–214
- Sugano N, Sasama T, Sato Y, Nakajima Y, Nishii T, Yonenobu K, Tamura S, Ochi T. Accuracy evaluation of surface-based registration methods in a computer navigation system for hip surgery performed through a posterolateral approach. Comput Aided Surg 2001; 6(4)195–203
- Sadowsky O, Yaniv Z, Joskowicz L. Comparative in vitro study of contact- and image-based rigid registration for computer-aided surgery. Comput Aided Surg 2002; 7(4)223–236
- Maurer CR, Aboutanos GB, Dawant BM, Maciunas RJ, Fitzpatrick JM. Registration of 3-D images using weighted geometrical features. IEEE Trans Med Imaging 1996; 15(6)836–849