Abstract
Objective: To develop an image visualization system based on graphic processing unit (GPU) hardware acceleration for clinical use in hepatocellular carcinoma (HCC) interventional planning.
Methods: We developed a liver tumor planning tool to assist the physician in providing patient-specific analysis and visualization. We employed a spatial distance computation algorithm to determine the spatial location of tumors and their relation to the main hepatic vessels. GPU hardware acceleration was implemented for rapid calculation of the spatial distance from the tumor surface to the surrounding vascular territories.
Results: The algorithm for spatial distance provided an accurate minimum value for the distance from the tumor surface to the surrounding duct system as well as the region of interest (ROI). Analyzing the data (mean CPU time = 43.14 ± 29.34; mean GPU time = 0.41 ± 0.38) using an independent samples t-test, the result showed a remarkable difference (p < 0.001). Thus, GPU hardware acceleration performed the distance arithmetic at higher rates than conventional CPUs.
Conclusions: The visual assistance tool performs as an intuitive and objective module in clinical cases, and is expected to help physicians achieve a more reliable treatment in liver tumor patients. As such, we believe it represents an improvement in image guided preoperative planning.
Introduction
Over the past few years, with the recent advances in medical imaging, image guided ablation therapies have been developed as an alternative treatment for liver tumors [Citation1–3]. To ensure secure probe trajectories, maximum destruction of cancerous cells, and minimum damage to healthy tissues, preoperative planning of the area around the tumor should be evaluated.
The many surgical and other interventions in the liver that are now planned on the basis of computed tomography (CT) or magnetic resonance imaging (MRI) data have led to an increasing number of 3D visualization approaches. For example, Numminen et al. [Citation4] presented a 3D imaging technique for liver tumor treatment; Scheuering et al. [Citation5] developed an intraoperative augmented-reality system (IARS) that can project planning information and structures onto the real laparoscopic video images of the liver; and Radtke et al. [Citation6] described a computer-assisted planning tool for the 3D reconstruction and calculation of liver volume. Much research has also been conducted on image visualization in preoperative planning [Citation7–9].
The above studies provided a variety of preoperative schemes. However, in the field of liver oncologic ablation, current studies rarely include a quantification analysis of the relationship between the tumors and the surrounding hepatic vessels. The success of an operation depends mostly on the surgeon’s experience in practical treatment, and analysis of the tumor and surrounding vasculature is therefore increasingly important. In view of this, we developed a 3D image visualization system to assist surgeons in conducting accurate patient-specific analysis.
The Graphics Processing Unit (GPU) is a hardware coprocessor that can accelerate computations for computer graphics applications. With its programmable features, we implemented a computing spatial distance algorithm on a commodity GPU using an acceleration scheme. The computing spatial distance algorithm based on GPU hardware acceleration can directly display the spatial relation and minimum distance value from the tumor surface to the surrounding intrahepatic vessels.
Materials and methods
To reveal the spatial relationship of the intrahepatic vessels clearly and ensure the feasibility of planning the ablation region, we developed a calculation method for distance based on GPU hardware acceleration to present the relationship between the tumor and the intrahepatic vessels.
Image segmentation and 3D reconstruction
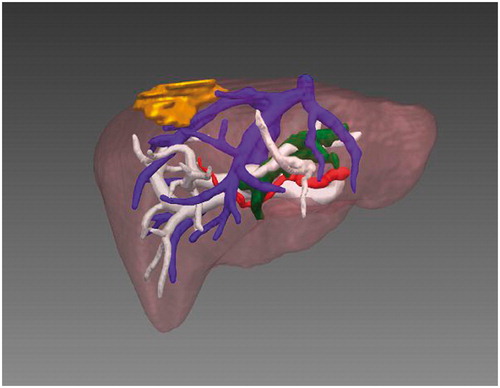
The first step was to perform segmentation of the image data and establish the 3D tumor and vessel model. For this purpose, we have developed 3D visualization software which can be used on both Linux and Windows platforms. The CT data were imported to our software in DICOM format, and the vessel was segmented, as shown in , using semi-automatic segmentation (e.g., a region-growing algorithm [Citation10]). Generally, a seed point was chosen for segmentation of the tumor; for segmentation of the vessel, seed points were selected from the trunk and large branches in general. Active Shape Model (ASM) [Citation11] was used for segmentation of the organ. After segmentation, the Marching Cubes (MC) algorithm [Citation12] was applied, being chosen for its good performance in 3D reconstruction. Surface models of the tumor, vessels and liver were created from the segmented structures and visualized (see ).
Figure 1. The segmented 2D plane based on CT images. The red area indicates segmented hepatic blood vessel.
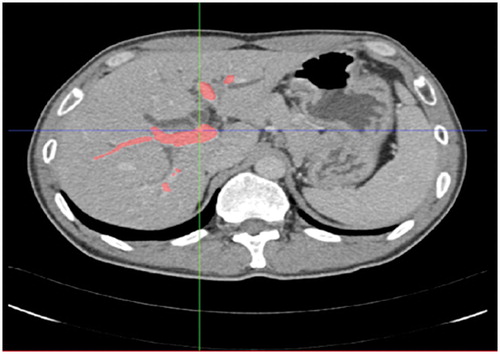
Figure 2. The 3D reconstructed image including the tumor (yellow), portal vein (white), hepatic vein (blue), artery (red) and gall bladder (green).
GPU acceleration
In our research, an image contains a large quantity of data. For example, the surface models of a tumor usually contain 10,000 points, and the actual computation amount for the distance will reach approximately 1 × 10⁸. Therefore, we structured the graphic hardware GPU to accelerate the effect of the computation algorithm described in the next section.
To prove GPU acceleration of performance, we randomly chose 5 patients (4 males and 1 female, aged 38-75 years with a mean age of 55) with pathologically proven hepatocellular carcinoma and compared the times needed for the distance computation process. Since distance computation involves traversing all points of the tumor and main hepatic vessels to obtain the smallest distance value, we compared the times based on CPU and GPU, respectively, for tumors of different maximum diameters and for differing numbers of iterations. In this experiment, we processed two sets of data with different hepatic vessels for every patient. Results of the performance comparison are shown in ; the time value was obtained directly from the software, and the speedup value was the ratio of the CPU to GPU run times.
Table I. Comparison of GPU and CPU running times in the computation process.
Distance calculation method
We developed the algorithm for spatial distance calculation based on GPU hardware acceleration to present the relationship between a tumor and the surrounding vasculature. Since the shape models of vascular territories have been extracted, the guideline and emphasis is to obtain the nearest distance value by traversing all points on the tumor surface and on the surface of the hepatic artery, hepatic vein and portal vein, as well as the surrounding organs (e.g., the bile duct), based on GPU hardware acceleration. By traversing the points of the tumor, its maximum diameter and the minimum distance from the tumor to the surrounding vessels can be computed. In this process, the minimum value is summarized as being the distance from the point to the plane. Assuming the equation plane is Ax + By + Cz + D = 0, the point’s coordinator value is x0, y0 and z0. The formula is as follows:
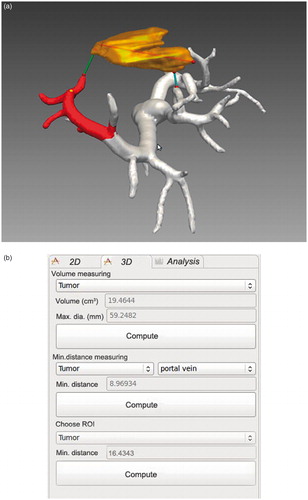
Based on this formula, the maximum diameter and volume of the tumor were computed, along with the minimum distance from the tumor to the portal vein. shows the anatomical relationship between the tumor and the portal vein, and shows the results display. Volume and maximum diameter values are displayed in the “Volume measuring” selection area of the display; and the minimum distance value from the tumor to the portal vein is displayed in the “Min. distance measuring” selection area. On choosing a region of interest (ROI), the minimum distance value from the tumor to the region is computed and displayed in the “Choose ROI” selection area.
Figure 3. (a) The anatomical relationship between the tumor and portal vein. (b) The computation results for the tumor’s volume, maximum diameter and minimum distance from tumor to portal vein. On choosing an ROI in (a), the minimum distance from the tumor to that ROI is computed and displayed.
Results
From the results shown in , we take cases 1 and 2 as an example. The data for these two cases are for a single patient. The maximum diameter of the patient’s tumor was 38.76 mm; the numbers of iterations were 4862*15438 and 4862*17196 for different vessels. The speedup value is the ratio of the CPU to GPU run times (case 1: 15.63/0.11; case 2: 17.41/0.12). We can see that the average computing speed for GPU can be 43.14 times faster than that for CPU. The mean ± SD value of the CPU time is 43.14 ± 29.34 seconds, while the GPU time is 0.41 ± 0.38 seconds. Analyzing the data using an independent samples t-test, the results show a remarkable difference (p < 0.001).
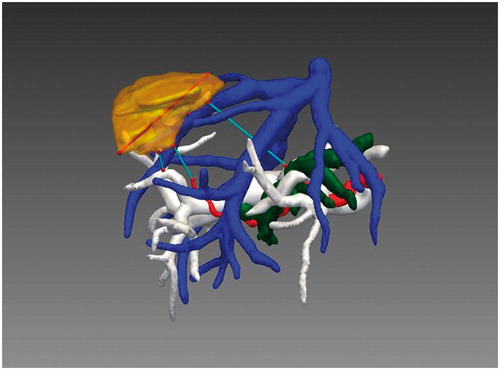
In our present study, we employed a computing spatial distance algorithm based on GPU hardware acceleration to directly display the spatial relationship and compute the minimum distance value from the tumor surface to the surrounding intrahepatic vessels. By applying GPU hardware acceleration, running time is reduced significantly and system performance is vastly improved. With the spatial distance computation method, the maximum diameter of the tumor, the minimum distance from the tumor to the surrounding vessels, and the minimum distance from the tumor to the ROI can all be computed. In , the volume and maximum diameter of the tumor are approximately 19.46 cm3 and 59.25 mm, respectively, and the minimum distances from the tumor to the portal vein and ROI are approximately 8.97 mm and 16.43 mm, respectively. displays the minimum distance from the tumor to the surrounding vessels. By choosing different vessels, we can obtain the values directly from the software. In this case, the distance values from the tumor to the portal vein, hepatic vein, hepatic artery and bile duct were approximately 8.97 mm, 0.23 mm, 17.84 mm and 38.47 mm, respectively.
Figure 4. The minimum distance from the tumor to the surrounding vasculature. From the software, distance values from the tumor to the portal vein, hepatic vein, artery and gall bladder were approximately 8.97 mm, 0.23 mm, 17.84 mm and 38.47 mm, respectively.
Discussion
We have developed an algorithm for computing spatial distance based on GPU hardware acceleration to help the surgeon determine the relationship between the tumor and surrounding vessels. The application of GPU hardware acceleration effectively reduces the running time and meets the real-time performance requirements. The computing speed of a GPU can be 43.14 times faster than that of a CPU on average. However, in some cases computation can be influenced by objective factors (e.g., limited computer memory) when the amount of calculation required is very great, as in case 10. On analyzing the data using an independent samples t-test, the results show a remarkable difference (p < 0.001). Thus, GPU acceleration performs the distance arithmetic at higher rates than conventional CPUs.
From , the spatial location of the tumor and its relation to the main hepatic vessels and parenchyma can be clearly understood. The 3D reconstructed models and knowledge of relationships in the duct system allow the surgeon to avoid dangerous probe trajectories and excessive ablation during an interventional treatment. In this example, since the distances from the tumor to the portal vein and hepatic vein are 8.97 mm and 0.23 mm, respectively, particular care must be exercised to avoid excessive ablation of the portal vein and hepatic vein.
We developed the visual assistance tool including both the spatial distance computation algorithm and GPU hardware acceleration. This provides not only the relationship between a tumor and the surrounding vessels, but also the minimum distance values. Based on GPU hardware acceleration, the running time is reduced to approximately 1.0 second, and system performance is vastly improved. The real-time capability is validated with hardware acceleration. Clinicians can perform preoperative planning more rapidly and effectively with GPU hardware acceleration, and this also assists surgeons in achieving a more reliable liver tumor ablation. If, during an actual ablation procedure, the surgeon discovers he has wrongly estimated the surgery, and must therefore adjust the operation plan by determining the location of the hepatic vessels and related distance values, the reduction in associated computing time is essential. With the image guidance tool, clinicians can obtain a more perspicuous understanding of the patient-specific liver tumor than is possible in a 2D CT image, and improved accuracy of the probe trajectories in the ablation treatment.
The presented visual assistance tool performs as an intuitive and objective 3D model in clinical cases, and we believe it represents an improvement in image guided preoperative planning. We will continue our research to explore the potential for integrating image guidance to improve a variety of surgical interventions.
Declaration of interest
The authors report no declarations of interest. This research is supported by two grants from the National Scientific Foundation Committee of China (30825010 and 81071210).
References
- Kuvshinoff BW, Ota DM. Radiofrequency ablation of liver tumors: influence of technique and tumor size. Surgery 2002;132(4):605–11; discussion 611–612
- Curley DA. Radiofrequency ablation of malignant liver tumors. Ann Surg Oncol 2003;10(4):338–47
- Padma MD, Martinie DB, Iannitti DA. Liver tumor ablation: percutaneous and open approaches. J Surg Oncol 2009;100(8):619–34
- Numminen K, Sipilä O, Mäkisalo H. Preoperative hepatic 3D models: virtual liver resection using three-dimensional imaging technique. Eur J Radiol 2005;56(2):179–84
- Scheuering M, Schenk A, Schneider A, et al. Intraoperative augmented reality for minimally invasive liver interventions. In: Galloway RL Jr, editor. Proceedings of SPIE Medical Imaging 2003: Visualization, Image-Guided Procedures, and Display, San Diego, CA, February 2003. Proc SPIE 2003;5029:407–17
- Radtke A, Nadalin S, Sotiropoulos GC, et al. Computer-assisted operative planning in adult living donor liver transplantation: a new way to resolve the dilemma of the middle hepatic vein. World J Surg 2007;31(1):175–85
- Khajanchee YS, Streeter D, Swanstrom LL, Hansen PD. A mathematical model for preoperative planning of radiofrequency ablation of hepatic tumors. Surg Endosc 2004;18(4):696–701
- Yao S, Li JY, Liu FD, Pei LJ. Significance of measurements of herniary area and volume and abdominal cavity volume in the treatment of incisional hernia: application of CT 3D reconstruction in 17 cases. Comput Aided Surg 2012;17(1):40–5
- Shirinifard A, Gens JS, Zaitlen LB, et al. 3D multi-cell simulation of tumor growth and angiogenesis. PLoS ONE 2009;4(10):e7190
- Moltz JH, Bornemann L, Kuhnigk J-M, et al. Advanced segmentation techniques for lung nodules, liver metastases, and enlarged lymph nodes in CT scans. J Sel Topics Signal Processing 2009;3(1):122–34
- van Ginnecken B, Frangi AF, Staal JJ, et al. Active shape model segmentation with optimal features. IEEE Trans Med Imaging 2002;21(8):924–33
- Shekhar R, Fayyad E, Yagel R, Cornhill JF. Octree-based decimation of marching cubes surfaces. In: Proceedings of IEEE Visualization ’96, San Francisco, CA, October 27-November 1, 1996. pp 335–42