
Abstract
Optical coherence tomography (OCT) has been shown to be of clinical value in imaging basal cell carcinoma (BCC). A novel dual OCT-video imaging system, providing automated registration of OCT and dermoscopy, has been developed to assess the potential of OCT in measuring the degree of sub-clinical spread of BCC. Seventeen patients selected for Mohs micrographic surgery (MMS) for BCC were recruited to the study. The extent of BCC infiltration beyond a segment of the clinically assessed pre-surgical border was evaluated using OCT. Sufficiently accurate (<0.5 mm) registration of OCT and dermoscopy images was achieved in 9 patients. The location of the OCT-assessed BCC border was also compared with that of the final surgical defect. Infiltration of BCC across the clinical border ranged from 0 mm to >2.5 mm. In addition, the OCT border lay between 0.5 mm and 2.0 mm inside the final MMS defect in those cases where this could be assessed. In one case, where the final MMS defect was over 17 mm from the clinical border, OCT showed >2.5 mm infiltration across the clinical border at the FOV limit. These results provide evidence that OCT allows more accurate assessment of sub-clinical spread of BCC than clinical observation alone. Such a capability may have clinical value in reducing the number of surgical stages in MMS for BCC. There may also be a role for OCT in aiding the selection of patients most suitable for MMS.
Introduction
Basal cell carcinoma (BCC) is a slow-growing, locally invasive malignant skin tumor with a highly irregular infiltration pattern. Whilst rarely life-threatening, the high incidence and local invasiveness of BCC make it a major public health concern [Citation1, Citation2]. The malignant extensions of BCC are often not clinically detectable due to the microscopic nature of the tumor spread [Citation3]. In standard surgical excision (SSE), therefore, a predetermined margin (typically 3–5 mm) ensures that, in most cases, all sub-clinical spread will be excised [Citation4]. Where there is a high risk of recurrence, particularly in large lesions, those with poorly defined borders, and those occurring on the face, Mohs micrographic surgery (MMS) is preferred [Citation5, Citation6]. In MMS, staged excisions are controlled intraoperatively by histological analysis, providing a low recurrence rate (<2%) and optimum sparing of healthy tissue, although at a greater cost than SSE [Citation5].
Non-invasive imaging technologies offer the potential for more accurate assessment of the pre-surgical border of a BCC by revealing sub-clinical spread. Dermoscopy, for example, is an established clinical aid [Citation7] that offers some improvement in defining a preoperative border in SSE that otherwise relies wholly on effective visual assessment [Citation8]. However, pre-surgical assessment with dermoscopy has not been shown to lead to any reduction in the total number of MMS stages required for complete excision [Citation9]. Similarly, high-resolution ultrasound generally provides insufficient contrast in subtle areas of tumor extension to be of significant clinical value in preoperative mapping of BCC [Citation10, Citation11].
The emerging high-resolution, non-invasive optical imaging technologies, including reflectance confocal microscopy (RCM) and optical coherence tomography (OCT) [Citation12, Citation13], offer increased potential for identifying sub-clinical spread of BCC [Citation14]. Clinical RCM, for example, has demonstrated promise in mapping cellular-level features of residual BCC in shave biopsy wounds [Citation15] and in a small clinical study of preoperative BCC margin mapping [Citation16]. However, RCM can image only as deep as the superficial dermis and requires skin contact and a coupling fluid, making it difficult to image surfaces that are not flat. By contrast, OCT, a cheaper technology, can provide contact-free imaging to a depth of approximately 1.5 mm in skin and has been widely shown to provide reasonable correspondence with histological features of BCC [Citation17–20]. An initial attempt to map a BCC border in the clinic using OCT has been presented as a single case study [Citation21]. This showed qualitative agreement between the OCT-imaged lateral margins of a single BCC and the corresponding histologically confirmed margins.
The study presented here examines the extent of BCC infiltration across the pre-surgical clinical border using OCT. The OCT-defined border is compared with the final MMS defect. Dermoscopy has been employed to record the position of the clinical border of the BCC. A novel software algorithm, based on an interpolating thin-plate spline transformation [Citation22], has been developed to register this border with the corresponding 3D OCT image data. Automated registration of OCT and dermoscopy offers the advantages of speed and accuracy over the manual registration of surface features as used by Pomerantz et al. [Citation21].
Methods
Imaging and registration
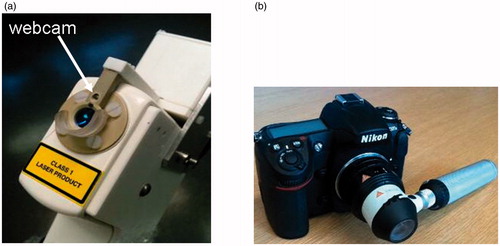
Optical coherence tomography was performed using a commercial system, the VivoSight 1500 OCT system [Citation23] (Michelson Diagnostics Ltd., Orpington, UK). With this system, the lateral and axial optical resolutions achieved in tissue are nominally 7.5 μm and 10 μm, respectively. The VivoSight hand-held probe was fitted for this study with a miniature webcam by the manufacturer (). The webcam is rigidly mounted in the rim of the scanning head with its viewing axis lying at an angle (24°) to the OCT beam axis. It both serves as an aid in locating the OCT probe over a lesion under visual guidance and provides an image of a fiducial marker on the skin to aid registration of the OCT and dermoscopy images. Digital dermoscopy was performed using the Heine Delta 20 dermoscopic attachment (Heine Optotechnik, Herrsching, Germany) fitted to a Nikon DS300 digital camera ().
Figure 1. (a) The hand-held OCT probe from the VivoSight 1500 OCT system fitted for this study with a miniature webcam (arrowed), and (b) the Heine Delta 20 dermoscopic attachment to the Nikon DS300 digital camera.
For this study, 3D OCT datasets were obtained at 6 fps, in the form of a stack of 250 “B-scan” OCT images of 1,338-pixel width, spaced at 20 μm and covering a 5 mm × 5 mm area of skin to a depth of 1.5 mm in a single 40-second scan. Registration of this 3D dataset with a dermoscopic image of the skin surface was carried out off-line using a software algorithm described in the Appendix to this paper. Briefly, the algorithm involves first rectifying the webcam image to correct for the 24° offset from the OCT beam axis. The rectified image provides a view of the skin as if the webcam had been directed along the OCT beam axis. The digital dermoscopic image of the lesion is then rotated, translated and stretched so that the image of the fiducial marker coincides with that from the rectified webcam image. The result is a dermoscopic image registered with the 3D OCT dataset. A 3D skin surface is then obtained from the OCT dataset by suitable thresholding, and the registered dermoscopic image is fused onto the 3D surface of the OCT dataset. The resulting combined OCT-dermoscopy dataset is rendered in 3D in an open-source software package (Paraview®).
Clinical study
A preliminary clinical evaluation of the dual OCT-dermoscopy imaging system was carried out by comparing the OCT-assessed and visual pre-surgical borders. These borders were then compared with the final MMS defect. Seventeen patients, 7 females and 10 males with a mean age of 67 years (range: 46–86 years), were recruited opportunistically from any willing adults (>18 years old) with histologically confirmed BCC attending Guy’s & St. Thomas’ NHS Hospital Foundation Trust for MMS. Patients were excluded only if the skin at and around the BCC was broken. The surgeon marked the pre-surgical clinical border of the BCC in ink on the patient’s skin. A circular fiducial marker was then located at a position straddling an arbitrarily selected segment of this pre-surgical border. The skin and the associated marker were then imaged by placing the hand-held OCT probe and dermatoscope in turn at the site of the border. The pre-surgical OCT and dermoscopy images were then registered and fused (see Appendix). A dermatologist inspected the 2D OCT images selected from the 3D rendered image in a plane that allowed measurement of the extent of any infiltration of BCC beyond the clinical border. After surgery, a clinical image was then obtained to record the extent of the surgical defect. The clinical image of the defect and the dermoscopic image of the lesion were registered by suitable rotation and magnification to match common surface features.
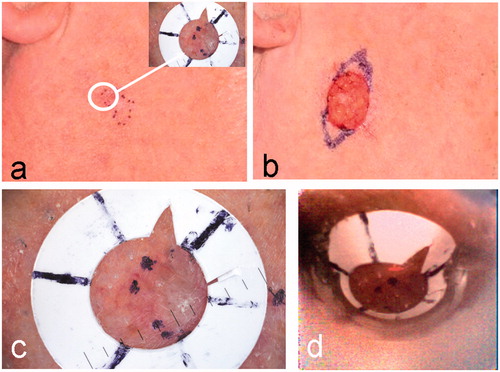
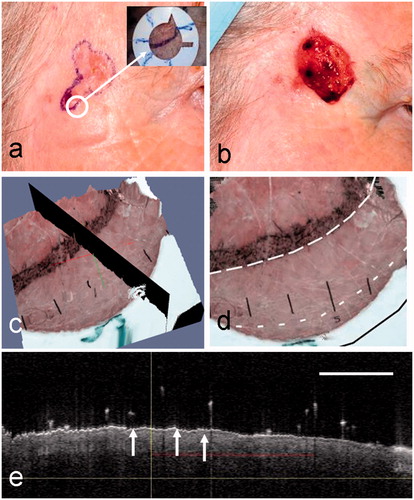
illustrates the positioning of the white fiducial ring over the pre-surgical margin of a nodular BCC, showing the dermoscopy image of the marker (inset). The surgical wound following the first stage of MMS is shown in the clinical image (). Inked markings of the new margin for the planned second stage of MMS are also visible in this image. An enlarged version of the dermoscopy image of the fiducial marker is shown in . The webcam image of the same fiducial ring before rectification () appears distorted in comparison to the dermoscopic image (). The algorithm, described in the Appendix, is used to register and fuse the OCT dataset and dermoscopy image.
Figure 2. A nodular BCC on the cheek of patient 1 (see ). (a) Clinical image showing the pre-surgical border marked in ink dots on the skin. Inset is the dermoscopy image of the fiducial ring after it has been placed over a small segment of the pre-surgical border in the position indicated by the white circle. (b) Clinical image after one stage of MMS. Extended inked marking indicates the pre-surgical border for the planned second MMS stage. (c) An enlargement of the dermoscopy image of a segment of the lesion border and fiducial marker. (d) The webcam image in the registration before rectification.
Results
Comparison of tumor borders
Surgical margins in MMS are typically ∼2 mm: A useful level of accuracy for delineating tumor borders is assumed, therefore, to be ±0.5 mm. Errors from the rectification of the webcam image are negligibly small (<50 µm) because these systems are rigidly fixed to each other. The main source of errors affecting registration arises from the transformation of the dermoscopy and webcam images. This error can be assessed directly from comparison of the transformed and overlaid clinical images of the fiducial marker from the webcam and dermatoscope. Nine of the 17 cases had a maximum registration error of less than ±0.5 mm. The 8 cases with larger errors were excluded from the analysis presented here. The 9 retained cases () were assessed to have an average maximum registration error of ±0.25 mm (range: 0.12–0.49 mm). Registration of the clinical image of the final MMS with the OCT border was assessed to have an error of ∼1.0 mm
Table I. Comparison of clinical, OCT and final MMS defect borders.
The 9 cases summarized in are classified according to BCC subtype. The number of MMS stages required to complete the resection is given in the third column. The final three columns of give the mean values (in mm) for the distance between (i) the clinically assessed and OCT-assessed pre-surgical borders, (ii) the clinically assessed border and the border of the final surgical defect, and (iii) the OCT-assessed border and the final surgical defect border.
The first of the final three columns in represents the degree of OCT-identified infiltration across a segment of the clinical border. The > symbol (patients 5–7) is used to indicate that, in these cases, the BCC extended beyond both the clinically assessed border and the FOV of the OCT system. BCC infiltration across the clinically assessed border of the BCC was noted in all cases except patients 3 and 4. In patient 3, there was no disease noted either side of the clinical border, so no OCT border could be defined within the FOV of the scanner, while in patient 4 the clinical and OCT borders were coincident.
The extent of the surgical defect beyond the pre-surgical clinical border following MMS is given in the penultimate column of . In patient 5, for example, there was a particularly large difference (17.8 mm) between the pre-surgical border and the final MMS defect. In this case the OCT system identified infiltration at least 2.5 mm beyond the clinical border, although the extent of infiltration could not be fully assessed because of the limited FOV. In the remaining cases, MMS resulted in resection of 2–4 mm of tissue beyond the clinical border of the lesion.
The difference between the final MMS defect and the OCT-defined pre-surgical border is given in the final column of . These values, where available, are all less than 2 mm, with the OCT border remaining within the defect. Since the MMS defect includes a 2-mm margin of normal tissue, these results indicate that using the OCT-defined border with a 2-mm margin added would have resulted in a clear margin, at least at the segments analyzed, in all five cases. Indeed, four cases (patients 1, 2, 4 and 8) would have had at least one less MMS stage than they actually received. In cases 5, 6 and 7 at least one MMS stage may have been avoided.
Five cases (patients 1-5 in ) are discussed in more detail in the following sections. These cases provide practical examples of the registration process, and also illustrate the variation in the OCT appearance of the lesion border in different BCC subtypes.
Nodular infiltrative BCC (Case 1)
A surface view of the 3D rendered image of the registered and fused OCT-dermoscopy dataset for the mixed nodular infiltrative BCC from patient 1 is shown in . This corresponds to the same lesion shown in . Using this 3D rendered image, the dermatologist can evaluate sub-clinical spread of BCC by selecting a suitable plane (shown in black in ) to extract an OCT image that straddles the clinical border of the BCC. The ink marks delineating the clinical border can be seen in , which also shows some edema. The OCT image from the selected plane is shown in . The vertical line indicates the position of the clinical border on the dermoscopy image; the two arrows point to ovoid shapes that are characteristic OCT features of BCC, representing BCC cell nests. The horizontal red line indicates the dermatologist’s assessment of the extent of infiltration beyond the clinical border of the BCC. The OCT-assessed border is shown in as a dashed line (short dashes). Also superimposed on this image are the clinical border (long dashes) and the final MMS defect border (solid line). The MMS defect is registered manually from clinical images with reference to landmarks on the skin surface.
Figure 3. (a) A surface view of the 3D OCT-dermoscopy dataset from a mixed nodular/infiltrative BCC. A clinician-selected plane straddling the clinical border is shown in black. (b) A different view of the 3D dataset showing segments of the pre-surgical border, the OCT-defined border and the final surgical defect as large-dashed, small-dashed and solid lines, respectively. (c) The OCT image from the clinician-selected plane showing ovoid structures interpreted as BCC cell nests (arrowed). The vertical line represents the pre-surgical border and the horizontal line the extent of infiltration of BCC assessed by a dermatologist. The OCT image scale bar corresponds to 1 mm.
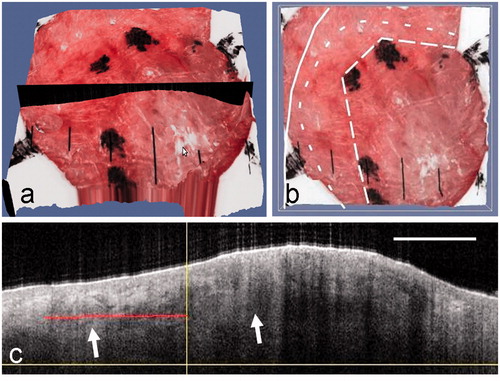
In this case, OCT indicates a small amount of sub-clinical spread (∼1.2 mm) beyond this segment of the clinical border. This is within the final MMS defect, which lies 2 mm beyond the clinical border. A margin of 2 mm beyond the clinical border would have included the observed sub-clinical spread, and only one stage of MMS would have been needed if this degree of spread was seen over the whole lesion border.
Nodular BCC (Case 2)
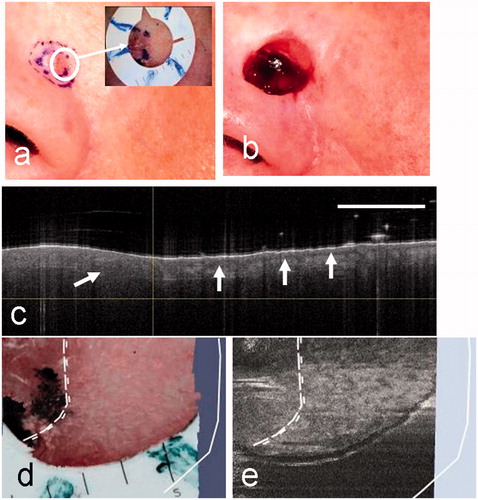
Images used in the analysis of a nodular BCC, this time close to the eye (patient 2), are shown in . The clinical image () shows a pale translucent lesion that appears raised and well-demarcated from surrounding tissue. The final surgical defect () extends closer to the eye. The surrounding tissue shows some edema after surgery. The 3D rendered OCT-dermoscopy image () shows the raised lesion, the inked pre-surgical margin, and a selected plane through the pre-surgical margin (in black). The OCT image from the selected plane () shows the surface contour of the skin and regions (arrowed) that are identified as BCC cell nests to the right and left of the clinical pre-surgical margin. The pre-surgical margin (long-dashed line), the OCT-defined margin (short-dashed line) and the final surgical defect (solid line) are shown in . The pre-surgical border is drawn simply to follow the ink marks on the skin.
Figure 4. Clinical images of a nodular BCC on the cheek of patient 2 before (a) and after (b) MMS. The dermoscopy image is inset in (a), with the fiducial marker placed across a segment of the pre-surgical border. (c) The selected OCT plane that straddles the clinical border is shown in black on the 3D rendered OCT-dermoscopy image. (d) The pre-surgical border, OCT-defined margin and final MMS defect are superimposed on the 3D rendered image following the line style convention used in . (e) The OCT image corresponding to the selected plane shows a BCC cell nest (left arrow) extending beyond the pre-surgical margin (vertical line). A large cell nest can also be seen largely within the pre-surgical margin (right arrow). The red line indicates the infiltration as assessed from this image. The OCT image scale bar corresponds to 1 mm.
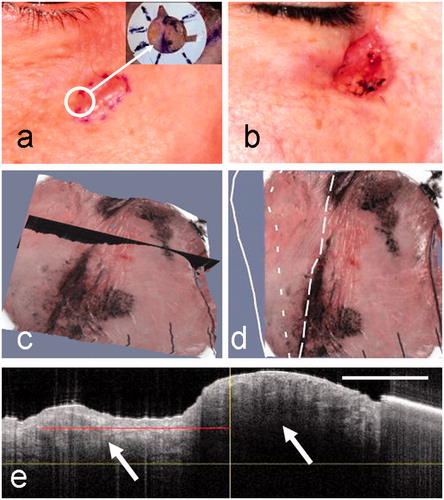
In this case, infiltration is clearly identified from the OCT image beyond the clinical margin. The final surgical defect lies 2.3 mm from the clinical border and ∼1.4 mm from the OCT-defined border. Again, the degree of sub-clinical spread is small and would have been included within a standard 2-mm MMS margin at this segment of the border.
Nodular BCC (Case 3)
Another nodular BCC, this time on the temple of patient 3, is shown in . The clinical images reveal an ulcerated nodular plaque () and a surgical defect () that is somewhat larger than the pre-surgical clinical border. The OCT image () of the selected plane, illustrated in the 3D rendered image (), shows few clinical features other than the presence of a particularly thin epidermis (arrowed) that is present across the entire FOV. The thinness of the epidermis, whilst a feature of superficial BCCs, is more likely related in this case to the location of this lesion on the temple. Hairs can be identified in the image as white dots above the skin surface that cast vertical line artefacts extending down from the dots into the OCT-imaged tissue, degrading parts of the image. It is not possible, from this image, to confirm the presence of sub-clinical spread of BCC or even to confirm the presence of BCC within the clinical border. Similarly, no information concerning the true extent of BCC infiltration can be inferred from the extent of the final MMS defect since this lies 2.3 mm beyond the clinical border, which simply represents the first MMS stage including a margin. It seems likely, in this case, that the clinical border was placed well beyond the true BCC border and the OCT scan therefore included only normal tissue.
Figure 5. The clinical images of a nodular BCC from patient 3 before (a) and after (b) surgery, showing the clinical border and MMS defect, respectively. The dermoscopy image (inset) shows the fiducial marker in a selected position on a segment of the pre-surgical margin. (c, d) Corresponding 3D rendered dual OCT-dermoscopy images illustrating the selected plane (c) and the position of the clinical border (dotted lines) and surgical defect (black solid line) (d). (e) In this case, the OCT image from the selected plane shows few features of BCC either side of the clinical border apart from a thin epidermis (arrowed) throughout. Artefacts from hairs appear as vertical lines above the skin.
Micronodular BCC (Case 4)
A case of micronodular BCC located on the nose of patient 4 is shown in . The clinical image () shows two inked regions containing a slightly raised pale area within two inked margins. The inner margin is the clinical border of the lesion and the outer inked ring simply represents the 2-mm margin of healthy tissue included in the first MMS stage. The final surgical defect is seen in . In this case, the selected OCT image, straddling the pre-surgical margin (), has a relatively homogeneous region with no sign of the dermal-epidermal junction (DEJ) to the left of the clinical border. Disruption of the DEJ is a characteristic feature seen in OCT images of BCC. To the right of the pre-surgical margin the normal appearance of the epidermal junction is seen (arrowed). The clinical and OCT borders are thus taken to be coincident in this segment of the lesion. The final MMS defect lies 3.5 mm beyond the clinical border, but follows closely the inked margin for the first stage. In this case, therefore, OCT has simply confirmed that there is no sub-clinical spread beyond the clinical border.
Figure 6. Clinical images of a micronodular BCC from patient 4 before surgery (a) and after surgery showing the MMS defect (b). In this case, the surgeon has marked two borders (a): the clinical border and the normal 2-mm margin around this representing the first MMS stage. The dermoscopy image (inset) shows the fiducial marker in a selected position on a segment of the pre-surgical margin. (c) The OCT image showing normal skin to the right of the clinical border (vertical line) with the DEJ (arrowed). To the left of the clinical border, within the lesion, a single ovoid BCC cell nest may be visible. The clinical and OCT borders are coincident in this case. (d) An enlargement of the dermoscopy image showing the position of the clinical and coincident OCT borders (dotted lines) and the surgical defect (solid white line). (e) The corresponding en face OCT view with the same superimposed borders.
Micronodular BCC (Case 5)
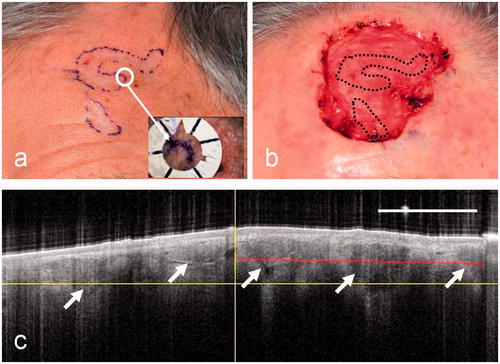
The final example is another micronodular BCC, in this case on the forehead of patient 5 (). Two separate inked regions containing flat, pale tissue are shown in the clinical image (). The final surgical defect () is, clearly, considerably larger than the visible lesion, which is illustrated for comparison in the form of a superimposed dotted line. This BCC, therefore, shows extensive sub-clinical spread that required more than three MMS stages for treatment. A selected OCT image that straddles the pre-surgical border () shows irregularly sized ovoid regions with bright borders, as well as large irregular dark regions (arrowed). These features extend both to the left and right of the clinical border (vertical line in ). It is concluded from the OCT imaging of this lesion that features characteristic of BCC cell nests extend to the limit of the FOV of the OCT system. No OCT lesion border can be defined in this case, and the OCT extent of this lesion is therefore represented as >2.5 mm. In this case, OCT has shown that there is sub-clinical spread throughout its FOV. Only by scanning the probe could the OCT border have been delineated in this case.
Figure 7. Clinical images of patient 5 before (a) and after (b) surgery for a micronodular BCC. This case shows a particularly large surgical defect relative to the clinical border (black dotted lines). (c) A clinician-selected OCT image straddling the pre-surgical border. In this case the OCT image shows irregularly sized ovoid regions with bright borders (arrowed) and large dark regions (arrowed). These extend throughout the image and well beyond the clinical border (vertical line).
Discussion
This clinical study demonstrates the value of automated registration of OCT and dermoscopy images of the same lesion. The system allowed identification of sub-clinical spread of BCC across the visually assessed pre-surgical margin of BCCs with an accuracy of around 0.5 mm.
The key finding of the study is that OCT can be used to assess the degree of sub-clinical spread prior to MMS. Such spread of BCC was identified in 7 of the 9 analyzed cases. In one case, the clinical and OCT borders were coincident and in another no OCT border could be seen. The degree of infiltration, in the cases where it could be assessed within the FOV limitations, was less than ∼2.0 mm in all but one case. In these cases, OCT would have added relatively little clinical value, since a 2.0-mm surgical margin would have included any infiltration in the first MMS stage. However, in at least one case, there was a large discrepancy between the clinical border and the final surgical defect. The use of OCT would have raised concern over the accuracy of the clinical border in this case, and would have led to a reassessment of this border with a consequent reduction in the number of MMS stages.
Visual registration was used to compare the OCT border of the BCC with the final MMS defect. It is interesting to note that there were no instances where the OCT-assessed border exceeded the final MMS defect. Indeed, in those cases that could be assessed, the OCT border was within ∼2 mm of the final MMS defect. The clinical borders, by contrast, ranged between approximately 2 mm and 18 mm from the defect. Such a result, if repeated in a larger clinical study without the FOV limitations, would suggest a valuable role for OCT in assessing a more accurate pre-surgical border with the aim of limiting the number of MMS stages.
Most of the cases included in this study showed only a small amount of sub-clinical spread in the segment analyzed by OCT. If this degree of spread was seen around the entire border, then these lesions could have simply been treated by SSE with a 3-mm margin. Case 5, however, with extensive spread, was clearly only suitable for MMS, since the likelihood of incomplete resection and recurrence was high. Large lesions and those with more poorly defined margins have a higher risk of recurrence. It seems feasible that OCT, as well as offering the potential to map preoperative margins, may have a role as a screening tool to assist in selecting the type of surgical treatment: either SSE or MMS.
The present study was limited by the relatively small number of cases analyzed and by the fact that the OCT probe was static, rather than being scanned manually under the dermatologist’s control. The small size of the study is partly the result of the long scan time used (40 s), which resulted in the exclusion from the analysis of just under half of the recruited patients due to poor registration accuracy resulting from excessive movement. The study was also limited by the relatively small FOV of the OCT system, which, because of time constraints, made it feasible for only one segment of the border to be rapidly imaged in the clinical setting. However, neither the FOV limitation nor the scan time represent insurmountable technical obstacles to OCT border delineation. Finke et al. [Citation24], for example, have achieved a larger FOV (16 × 12.5 mm) by scanning the OCT beam in a system designed for intraoperative imaging. A more immediately practical option would be to scan a larger region manually in real time using rapid 2D rather than slow 3D OCT imaging.
A more fundamental limitation of OCT in mapping the tumor border may be the inherently low contrast of clinical features in OCT images. Nodular BCC is typically well characterized in OCT images, with the border of the cell nests having a relatively high contrast. However, the clinical features of nodular BCC on the skin surface are also quite distinct, with pearly white, dome-shaped papules having prominent telangiectatic surface vessels and, frequently, an elevated shiny border. As a result, OCT may not add much to the visual assessment of the border in these cases. The greatest value is likely to be in cases where the BCC infiltrates widely and deeply, with relatively little change in the overlying skin surface appearance. This is common in the more aggressive BCC subtypes, including “infiltrative” and “micronodular” BCCs, which constitute approximately 20% of all BCCs and which are most appropriately treated by MMS. These lesions can appear as flat, ill-defined areas of skin where the texture and color changes can be subtle, making the clinical border difficult to define. Whilst subtypes can be identified on OCT [Citation25], it remains to be demonstrated whether the lesion borders can always be easily delineated on OCT and to what extent OCT adds value if borders are not precisely delineated.
Improved visualization of BCCs may be obtained using “high-definition” OCT systems. A recent study has shown that these are capable of providing more detailed features of infiltrative and other BCC subtypes [Citation26]. The same study also confirmed that the OCT borders of the more aggressive subtypes are less well defined. Although such OCT systems offer approximately three times the axial and lateral resolution (3 μm) of the VivoSight system used here, they provide only a third of the penetration (∼0.5 mm) and a reduced FOV (1.8 × 1.5 mm). It remains to be seen which specification of system proves the most valuable in mapping borders of the range of BCC subtypes.
Conclusion
This study demonstrates the value of using an adapted OCT system with automated OCT-dermoscopy image registration. The system was able to measure with adequate accuracy (<0.5 mm) the degree of sub-clinical spread of BCC. The results of this preliminary clinical study support the conclusion that OCT may have the potential to influence the selection of patients for MMS, and may be able to influence the duration of MMS by reducing the number of surgical stages. The study was limited by the constraints involved in seeking highly accurate automated registration. This limited the scope to examining the entire border of the BCC or scanning the OCT probe free-hand across the lesion. An OCT probe that can be manually scanned whilst also providing registration is being developed as the next phase of this work.
Declaration of interest
This research was supported by the National Institute for Health Research (NIHR) Biomedical Research Centre at Guy’s and St. Thomas’ NHS Foundation Trust and King’s College London. The views expressed are those of the authors and not necessarily those of the NHS, the NIHR or the Department of Health. (REC No. 10/H0718/83). The authors, their immediate families, and any research foundations with which they are affiliated received no financial payments or other benefits from any commercial entity related to the subject of this article.
References
- Lomas A, Leonardi-Bee J, Bath-Hextall FA. 2012. A systematic review of worldwide incidence of nonmelanoma skin cancer. Br J Dermatol 166:1069–80
- Breuninger H, Dietz K. 1991. Prediction of subclinical tumor infiltration in basal cell carcinoma. J Dermatologic Surgery and Oncology 17:574–8
- Batra RS, Kelley LC. 2002. Predictors of extensive subclinical spread in nonmelanoma skin cancer treated with Mohs micrographic surgery. Arch Dermatol 138:1043–51
- Telfer NR, Colver GB, Morton CA. 2008. Guidelines for the management of basal cell carcinoma. Br J Dermatol 159:35–48
- Smeets NWJ, Kuijpers DIM, Nelemans P, et al. 2004. Mohs’ micrographic surgery for treatment of basal cell carcinoma of the face – results of a retrospective study and review of the literature. Br J Dermatol 151:141–7
- Flohil SC, van Dorst AM, Nijsten T, et al. 2013. Mohs micrographic surgery for basal cell carcinomas: appropriateness of “Rotterdam” criteria and predictive factors for three or more stages. J Eur Acad Dermatol Venereol 27:1228–35
- Grin CM, Friedman KP, Grant-Kels JM. 2002. Dermoscopy: a review. Dermatol Clin 20:641–6
- Carducci MM, Bozzetti MM, De Marco GG, et al. 2012. Usefulness of margin detection by digital dermoscopy in the traditional surgical excision of basal cell carcinomas of the head and neck including infiltrative/morpheaform type. J Dermatol 39:326–30
- Guardiano RA, Grande DJ. 2010. A direct comparison of visual inspection, curettage, and epiluminescence microscopy in determining tumor extent before the initial margins are determined for Mohs micrographic surgery. Dermatol Surg 36:1240–4
- Marmur ES, Berkowitz EZ, Fuchs BS, et al. Use of high-frequency, high-resolution ultrasound before Mohs surgery. Dermatol Surg 36:841–7
- Jambusaria-Pahlajani A, Schmults CD, Miller CJ, et al. 2009. Test characteristics of high-resolution ultrasound in the preoperative assessment of margins of basal cell and squamous cell carcinoma in patients undergoing Mohs micrographic surgery. Dermatol Surg 35:9–15
- Patel JK, Konda S, Perez OA, et al. 2008. Newer technologies/techniques and tools in the diagnosis of melanoma. Eur J Dermatol 18:617–31
- Nioka A, Chen Y. 2011. Optical technology developments in biomedicine: history, current and future. Translational Medicine 1:51–150
- Amjadi M, Coventry BJ, Greenwood JE. 2010. Non-invasive tools for improving diagnosis of non-melanoma skin cancer: A review. Internet J Plastic Surg 7:1
- Marra DE, Torres A, Schanbacher CF, Gonzalez S. 2005. Detection of residual basal cell carcinoma by in vivo confocal microscopy. Dermatol Surg 31:538–41
- Pan ZY, Lin JR, Cheng TT, et al. 2012. In vivo reflectance confocal microscopy of basal cell carcinoma: feasibility of preoperative mapping of cancer margins. Dermatol Surg 38:1945–50
- Welzel J. 2001. Optical coherence tomography in dermatology: a review. Skin Res Technol 7:1–9
- Mogensen M, Nürnberg BM, Thrane L, et al. 2011. How histological features of basal cell carcinomas influence image quality in optical coherence tomography. J Biophotonics 4:544–51
- Coleman AJ, Richardson TJ, Orchard G, et al. 2013. Histological correlates of optical coherence tomography in non-melanoma skin cancer Skin Res Technol 19:10–9
- Gambichler T, Orlikov A, Vasa R, et al. 2007. In vivo optical coherence tomography of basal cell carcinoma. J Dermatol Sci 45:167–73
- Pomerantz R, Zell D, McKenzie G, Siegel DM. 2011. Optical coherence tomography used as a modality to delineate basal cell carcinoma prior to Mohs micrographic surgery. Case Rep Dermatol 3:212–8
- Bookstein FL. 1989. Principal Warps: Thin-plate splines and the decomposition of deformations. IEEE Trans Pattern Anal Mach Intell 11:567–85
- Holmes J, Hattersley S, Stone N, Bazant-Hegemark F, Barr H. 2008. Multi-channel Fourier domain OCT system with superior lateral resolution for biomedical applications. Proc. SPIE 6847:68470O
- Finke M, Kantelhardt S, Schlaefer A, et al. 2012. Automatic scanning of large tissue areas in neurosurgery using optical coherence tomography. Int J Med Robotics Comput Assist Surg 8:327–36
- Olmedo JM, Warschaw KE, Schmitt JM, Swanson DL. 2006. Optical coherence tomography for the characterization of basal cell carcinoma in vivo: A pilot study. J Am Acad Dermatol 55:408–12
- Boone MA, Norrenberg S, Jemec GB, Del Marmol V. 2012. Imaging of basal cell carcinoma by high-definition optical coherence tomography: histomorphological correlation. A pilot study. Br J Dermatol 167:856–64
- Hartley R, Zisserman 2003. A. Multiple View Geometry in Computer Vision. Cambridge: University Press
- Yushkevich PA, Piven J, Hazlett HC, et al. 2006. User-guided 3D active contour segmentation of anatomical structures: significantly improved efficiency and reliability. Neuroimage 3:1116–28
Appendix: Image registration and fusion
Coordinate transformations
The webcam is rigidly fixed to the OCT probe such that the angle between the beam axes of the two imaging systems is constant (). A calibration is performed to relate the 2D webcam (u, v)T and 3D OCT (x, y, z)T coordinate systems. This calibration provides the components of a 3 × 4 calibration matrix PW, where PW is defined by
where λ is a scaling factor. The calibration is obtained in practice by imaging a plane rectangular grid inscribed on a sheet of Perspex. Grid line intersections can be seen in the webcam image and pinholes at the intersection of grid lines can be seen clearly in the OCT images. The plane containing the grid is positioned orthogonal to the OCT beam axis at six different heights between 0 and 2.0 mm with respect to the OCT probe applicator. At each height a webcam image is captured along with a 3D OCT image stack, consisting of 250 B-scan images spaced at 20 µm. Each OCT image stack covers a volume of dimensions 5 × 5 × 1.78 mm. Once the coordinates of pinholes have been located in each OCT stack and associated with the coordinates of grid line intersections in the webcam image, a direct linear transformation algorithm [Citation27] is used to find an initial estimate for PW. This estimate is then decomposed and the parameters used as input into an iterative algorithm. In practice, the mean residual calibration error was 0.64 pixels.
A second calibration is performed to obtain a coordinate transformation, PD, linking the dermoscope and OCT coordinate systems. A similar equation to that shown above (Equation 1) describes this transformation. In this case, the test object consisted of grid lines etched on opposite surfaces of a 1-mm-thick Perspex sheet. The dermatoscope is placed in contact with the top surface of the Perspex and an image of the two grids as seen from this surface is acquired. The upper and lower grid line intersection points can be separately identified in this image. With the dermoscope removed, the test object is then located in a plane orthogonal to the beam axis of the OCT probe and a 3D OCT image stack acquired as before. The OCT image stack can be used to obtain pinhole coordinates at the grid line intersections on both surfaces of the Perspex test object. Again, a direct linear transformation algorithm [Citation27] is used to find an initial estimate for PD. This estimate is then decomposed and the parameters used as input into an iterative algorithm. In practice, the mean residual calibration error was 0.3 pixels.
Any translational and rotational components of PD are specific to the particular calibration set-up and will not apply generally. In the clinic, therefore, a fiducial marker is placed close to the lesion to provide the information necessary to extract the translational and rotational transformations required to register the images. This process is described in the next section. The calibration matrix obtained from calibration alone is, therefore, valid only for an arbitrary dermoscopy image position subject to an additional translation and rotation.
Image registration
A diagram of the main steps in the rectification and fusion algorithm is provided in . A webcam image of the fiducial marker () is first transformed into the dermoscopy coordinate system (D) – a process known as rectification. Rectification is achieved by casting a ray, using PD, from each pixel in D. The intersection of this ray with the particular plane containing the image of the fiducial marker in the OCT space is then found. A ray projected from this intersection point, using PW, is then cast so that it intersects the webcam image space (W). The pixel intensity at this position in W is then acquired and transferred to the corresponding pixel in D to generate a rectified webcam image of the fiducial marker. The result is that both the dermoscopic () and rectified webcam images of the fiducial marker lie in the same plane but are not necessarily registered. An interpolating thin-plate spline transformation [Citation19] is used to non-rigidly register these two separate images, using landmarks picked on the fiducial marker.
Figure 8. A diagram illustrating the main steps in the algorithm including the rectification of the webcam image of the lesion (a), showing the fiducial marker, and the registration of the dermoscopy image with the rectified webcam image (b), followed by fusion with the OCT image stack (c) to form a 3D combined OCT-dermoscopy image (d).
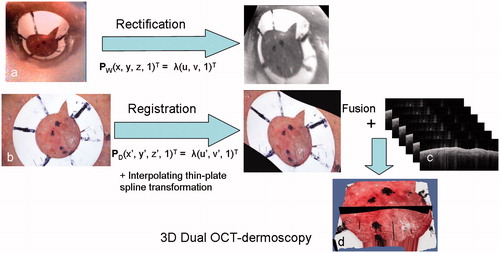
The OCT scans () were segmented into two regions using intensity-based threshold. A rolling window was preferred to a simple intensity threshold as this allowed some smaller artefacts above the skin surface to be ignored. An active contour segmentation was then applied to the segmented dataset using ITK-Snap [Citation28] to create a surface mesh. The images are smoothed, triangulated and decimated. The registered dermoscopy image was then overlaid onto this surface by projecting, using PD, each point from the mesh into the registered dermoscopy image and assigning the corresponding RGB intensity values to the mesh point. The overlaid mesh and the OCT scan were 3D rendered in Paraview® ().