
Abstract
This study describes computer simulation of blood flow and plaque progression pattern in a patient who underwent surgical treatment for infected carotid prosthetic tube graft using carotid–carotid cross-over bypass. The 3D blood flow is governed by the Navier–Stokes equations, together with the continuity equation. Mass transfer within the blood lumen and through the arterial wall is coupled with the blood flow and is modelled by the convection–diffusion equation. Low-density lipoprotein (LDL) transport in lumen of the vessel is described by Kedem–Katchalsky equations. The inflammatory process is solved using three additional reaction–diffusion partial differential equations. Calculation based on a computer simulation showed that flow distribution in the left carotid artery (CA) was around 40–50% of the total flow in the right common CA. Also, the left CA had higher pressure gradient after surgical intervention. Plaque progression simulation predicted development of the atherosclerotic plaque in the position of the right common CA and the left internal CA. A novel way of atherosclerotic plaque progression modelling using computer simulation shows a potential clinical benefit with significant impact on the treatment strategy optimization.
Introduction
Atherosclerosis is a systemic disease which involves large- and medium-sized arteries and commonly affecting the carotid artery (CA) at its bifurcation. In the setting of significant carotid stenosis, ischemic stroke can develop as a result of embolism of atherosclerotic debris or thrombotic material from the plaque into the distal cerebral vasculature.[Citation1] Unlike occlusive disease affecting other locations, CA stenosis is usually asymptomatic. Both patients with symptomatic and asymptomatic carotid bifurcation disease can benefit from carotid revascularization.[Citation2] Carotid endarterectomy is still the most commonly performed revascularization procedure, although the number of performed carotid angioplasty and stenting procedures shows dramatic increase.
Small subset of patients with carotid atherosclerotic disease present with extensive proximal CA disease that calls for replacement of common CA. This is usually achieved with the use of synthetic tube grafts. Although rare, infections are one of the most feared complications after carotid angioplasty using synthetic materials. Different surgical techniques have been described addressing the problem of infected carotid prosthetic patch (ICPP).[Citation3] Use of the retropharyngeal/retroesophageal route for cross-over bypass between the CAs or CA and subclavian artery has been described by Berguer et al.[Citation4] Durability of these cross-over grafts is excellent, with a reported patency rate of 88% at 3 years’ follow-up.[Citation2] El-Sabrout et al. reported mortality and major stroke rates of 9% and 12%, respectively, for surgical reconstruction (excision followed by inline autologous grafting) compared with 50% mortality after CA ligation.[Citation5]
To the best of our knowledge, this is the first study exploring the hemodynamic effects and plaque progression of carotid–carotid cross-over bypass using the computer simulation. Although indications for performing this kind of a procedure are narrow, one of them described in our previous article,[Citation6] potentially large pool of patients may benefit from carotid–carotid cross-over bypass: asymptomatic/symptomatic patients with carotid bifurcation disease and concurrent inflow disease, symptomatic patients with proximal carotid or aortic arch disease, and patients with Takayasu arteritis with cerebrovascular insufficiency.[Citation2]
The focus of this work is the assessment of the effects of surgical treatment of ICCP using carotid–carotid cross-over bypass on the dynamic and geometric factors. Carotid–carotid cross-over bypass implies an arterial reconstruction by retropharyngeal/retroesophageal interposition of a graft that is anastomosed between the two CAs. The main objective was to investigate how the flow field in the CAs and the vein graft was affected by flow condition, shear stress, pressure, force, plaque concentration based on the case of a patient treated by this specific modality.
Several mathematical models have recently been set up for the transport of macromolecules, such as LDLs, from the arterial lumen to the arterial wall and inside the wall.
The paper is organized as follows. The following section describes the basic finite element equations for the blood flow analysis. Some of the results describing postoperative values for shear stress, velocity, pressure, drag forces and plaque concentration are presented, followed by a discussion and conclusions.
In this study, we performed computational study for plaque composition and initial progression. The aim was to connect LDL transport with macrophages and oxidized LDL distribution as well as initial plaque grow model inside the intimal area. We firstly described mass transport of LDL through the wall and the simplified inflammatory process. The Navier–Stokes equations governed the blood motion in the lumen, the Darcy law was used for the blood filtration model, Kedem–Katchalsky equations [Citation7,Citation8] for the solute and flux exchanges between the lumen and the intima. Then, we described the system of three additional reaction–diffusion equations used for modelling the inflammatory process and lesion growth in the intima. This model relies on a matter incompressibility assumption. At the end, conclusion remarks are provided.
Methods
Clinical case description
Using computer simulation, we attempted to analyse the case of a 65-year-old man who underwent a previous replacement of both CAs and coronary artery bypass grafting and who presented with ICPP and pseudoaneurysm 3 years after the initial operation.[Citation6] The written informed consent for participation in the study was obtained from participant.
Due to a delicate circumstances and presence of a massive infection involving prosthetic tube graft, a decision was made to extensively debride all synthetic material on the right side of the neck and to reconstruct the right CA with autologous graft. We decided to perform a carotid–carotid cross-over bypass using the great saphenous vein. After removal of the synthetic graft on the right side, left common CA was dissected bellow the insertion of the prosthesis. Inflow end-to-side anastomosis between vein conduit and left common CA was performed (). Vein graft was routed retroesophageally as an interposition graft. Outflow anastomosis was performed between the vein conduit and right carotid bifurcation in end-to-end fashion, while the right common CA stump has been previously overseen. Computed tomography measurement of the carotid–carotid bypass was used for making a computer model ().
Figure 1. Clinical case: (A) the left and right CA before surgical intervention and (B) post-operative anatomy – carotid–carotid cross-over bypass.
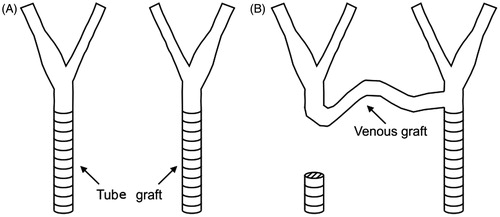
Figure 2. Computed tomography virtualization of the carotid–carotid bypass [Citation6].
![Figure 2. Computed tomography virtualization of the carotid–carotid bypass [Citation6].](/cms/asset/e59e219f-fd6e-45d1-a78f-30a8253d813c/icsu_a_1076036_f0002_c.jpg)
Computational procedure
We modelled mass transfer problem of LDL through the wall plaque formation and development as reaction–diffusion process. The blood flow in the lumen domain was simulated by the three-dimensional Navier–Stokes equations, together with the continuity equation
(1)
(2)
where u
l is blood velocity in the lumen, p
l is the pressure, μ is the dynamic viscosity of the blood and ρ is the density of the blood.
Mass transfer in the blood lumen is coupled with the blood flow and modelled by the convection–diffusion equation as follows:
(3)
in the fluid domain, where c
l is the solute concentration in the blood domain, and D
l is the solute diffusivity in the lumen.
Mass transfer in the arterial wall was coupled with the transmural flow and modelled by the convection–diffusion–reaction equation as follows:
(4)
in the wall domain, where c
w is the solute concentration in the arterial wall, D
w is the solute diffusivity in the arterial wall, k is the solute lag coefficient and r
w is the consumption rate constant.
LDL transport in lumen of the vessel was coupled with Kedem–Katchalsky equations [Citation7,Citation8]:
(5)
(6)
where J
v is the transmural velocity, J
s is the solute flux, L
p is the hydraulic conductivity of the endothelium, Δc is the solute concentration difference across the endothelium, Δp is the pressure drop across the endothelium, Δπ is the oncotic pressure difference across the endothelium, σ
d is the osmotic reflection coefficient, σ
f is the solvent reflection coefficient, P is the solute endothelial permeability, and c is the mean endothelial concentration.
The atherosclerotic process starts with the accumulation of LDL in the intima, where part of them is oxidized and become pathological. In order to remove the oxidized particles, circulating immune cells (e.g. monocytes) are recruited. Once in the intima, the monocytes differentiate and become macrophages that phagocyte the oxidized LDL. Fatty macrophages then undergo transformation into the foam cells. Foam cells are responsible for the growth of a subendothelial plaque which eventually emerges in the artery lumen. In addition, the increase of macrophage concentration induces the production of pro-inflammatory cytokines,[Citation9] that subsequently contribute to recruit more monocytes.
The inflammatory process was solved using three additional reaction–diffusion partial differential equations [Citation10]:
(7)
where Ox is the oxidized LDL or c
w is the solute concentration in the wall from Equation (Equation4
(4) ); M and S are concentrations in the intima of macrophages and cytokines, respectively; d
1, d
2, d
3 are the corresponding diffusion coefficients; λ and γ are degradation and LDL oxidized detection coefficients; and v
w is the inflammatory velocity of plaque growth, which satisfies Darcy’s law and continuity equation [Citation10,Citation11]:
(8)
(9)
in the wall domain. Here, p
w is the pressure in the arterial wall.
Results
Velocity distribution field for pre- and post-operative case is presented in the . It can be seen that flow distribution in the left CA was around 40–50% of the total flow in the right common CA.
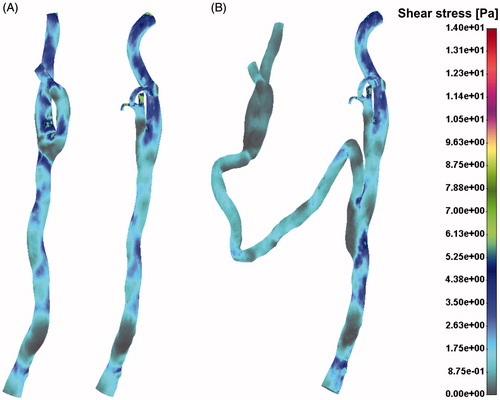
The low shear stress distribution presented in denoted potential position for atherosclerosis development. It is obvious that the left CA had more pronounced zones with low shear stress then the right CA, especially in the segment of internal and external left CA.
Figure 3. Velocity distribution vector field for the pre- (A) and post-operative (B) case.
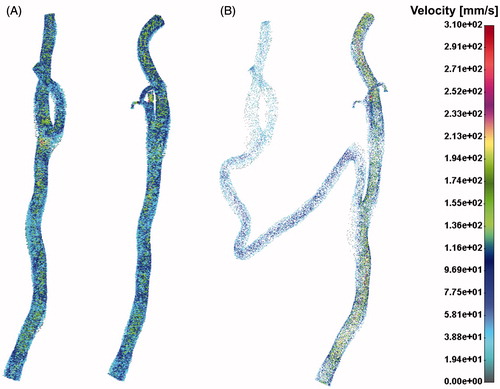
Figure 4. Shear stress distribution field for the pre- (A) and post-operative (B) case.
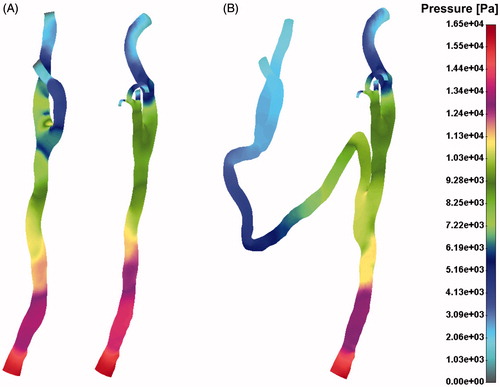
Drag force distribution field for the pre- (A) and post-operative (B) case is presented in . Pressure distribution for the pre- and post-operative case has been shown in . It is obvious that the left CA had higher pressure gradient after surgical intervention. This is due to a long vein graft bypass which connects two CAs.
Figure 5. Drag force distribution field for the pre- (A) and post-operative (B) case.
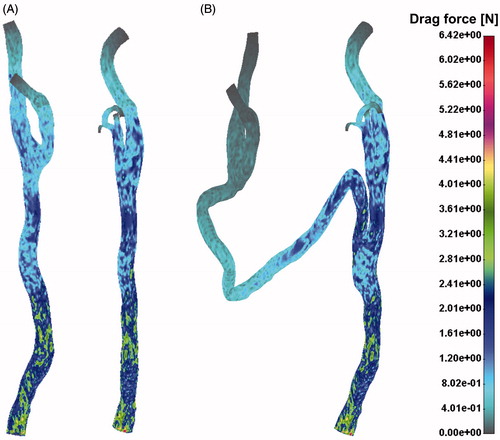
Figure 6. Pressure distribution field for the pre- (A) and post-operative (B) case.
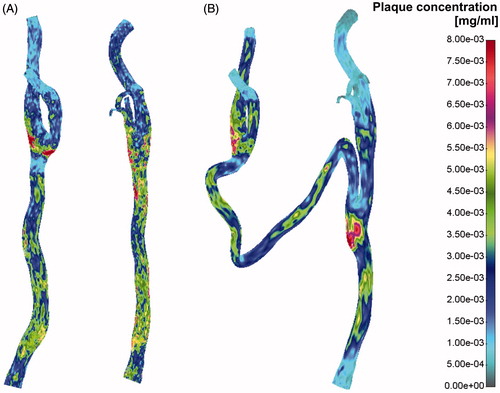
Plaque concentration distribution for the pre- and post-operative case is presented in . Red colour denotes possible plaque location and bar scale possible plaque concentration. It can be seen that the right common CA and the left internal CA are the two locations with the greatest risk of plaque position and concentration.
Figure 7. Plaque concentration for the pre- and post-operative case.
Conclusion
We described an estimation of carotid plaque formation and progression coupled with the blood flow dynamics on a full three dimensional-model derived from the patient with a carotid–carotid cross-over bypass. The Navier–Stokes equations together with the Darcy law for blood filtration model and Kedem–Katchalsky equations for the solute and flux transfer were used. Additionally, the model was coupled with the system of three additional reaction–diffusion equations for simulation of the inflammatory process.
Computer simulation of atherosclerotic plaque development and its progression over time with regards to specific patient profile is a novel approach in modelling atherosclerosis. We estimated the effects of surgical treatment of ICCP using carotid–carotid cross-over bypass on the dynamic and geometric factors. The results for flow condition, shear stress, pressure, force, plaque concentration based on the case of a patient treated by this specific modality have been shown.
This approach may show significant clinical benefit and possible impact on the treatment strategy optimisation.
Declaration of interest
The authors hereby stated that they have no potential conflict of interest related to any for-profit company or institution in any ways. This study was funded by a grant from FP7-ICT-2007 project (grant agreement 224297, ARTreat) and grants from Serbian Ministry of Science III41007 and ON174028.
References
- Mas JL. [Internal carotid artery revascularization]. Rev Esp Cardiol 2007;60:861–871.
- Ozsvath KJ, Roddy SP, Darling RC III, et al. Carotid–carotid crossover bypass: is it a durable procedure? J Vasc Surg 2003;37:582–585.
- Naughton PA, Garcia-Toca M, Rodriguez HE, et al. Carotid artery reconstruction for infected carotid patches. Eur J Vasc Endovasc Surg 2010;40:492–498.
- Berguer R, Morasch MD, Kline RA, et al. Cervical reconstruction of the supra-aortic trunks: a 16-year experience. J Vasc Surg 1999;29:239–246.
- El-Sabrout R, Reul G, Cooley DA. Infected postcarotid endarterectomy pseudoaneurysms: retrospective review of a series. Ann Vasc Surg 2000;14:239–247.
- Kovacevic P, Velicki L, Ivanovic V, Kieffer E. Carotid–carotid bypass as an option in the treatment of infected pseudoaneurysm after prosthetic carotid replacement. Ann Vasc Surg 2013;27:239–236.
- Kedem O, Katchalsky A. A physical interpretation of the phenomenological coefficients of membrane permeability. J Gen Physiol 1961;45:143–179.
- Kedem O, Katchalsky A. Thermodynamic analysis of the permeability of biological membranes to non-electrolytes. Biochim Biophys 1958;27:229–246.
- Ross R. Atherosclerosis: a defence mechanism gone away. Am J Pathol 2003;143:987–1002.
- Filipovic N, Rosic M, Tanaskovic I, et al. ARTreat project: three-dimensional numerical simulation of plaque formation and development in the arteries. IEEE Trans Inform Technol Biomed 2012;16:272–278.
- Filipovic N, Teng Z, Radovic M, et al. Computer simulation of three dimensional plaque formation and progression in the carotid artery. Med Biol Eng Comput 2013;51:607–616.