
ABSTRACT
Background: The ASCOT-ER is an adapted easy-read version of the ASCOT-SCT4, a self-report measure of social care-related quality of life (SCRQoL) for social care evaluation. In this study, we investigated the instrument’s feasibility, construct validity and factor structure.
Method: Data were collected from 264 service users in England. Feasibility was evaluated by missing data and help to complete the questionnaire. Scale dimensionality was assessed using exploratory factor analysis. Construct validity was evaluated by hypothesis testing.
Results: Convergent validity was supported by moderate to strong correlations between ASCOT-ER and personal wellbeing and overall quality of life, as well as with individual characteristics. Exploratory factor analysis indicated that the ASCOT-ER is a unidimensional scale. Low missingness indicates that the instrument is feasible; however, most respondents needed some level of support to complete the questionnaire.
Conclusion: The study provides preliminary evidence of the ASCOT-ER’s feasibility, unidimensionality and construct validity.
In recent decades, there has been a trend towards evidence-based policy and management of public services informed by service user outcomes (Bovaird, Citation2014; Bovaird & Löffler, Citation2002, Citation2003). In England, there has been a shift towards using an outcomes approach in social care (also known as long-term care) with the introduction of the Adult Social Care Outcomes Framework (ASCOF) (Department of Health, Citation2011). The ASCOF is designed to monitor the local and national performance of the long-term care system and promote transparency, accountability and the setting of strategic priorities (Department of Health, Citation2017). Since the goal of social care services is to improve and maintain the quality of life (QoL) (Netten, Citation2011; Netten et al., Citation2012), the ASCOF includes an overarching indicator of the QoL of service users, the Adult Social Care Outcomes Toolkit (ASCOT-SCT4).
The ASCOT-SCT4 is a self-report measure of social care-related QoL (SCRQoL), which is defined as aspects of QoL that may be influenced by social care services (Netten et al., Citation2012) and is collected through the Adult Social Care Survey (ASCS) (NHS Digital, Citation2017). All local authorities with social care responsibilities in England are required to collect ASCOT-SCT4 data from a sample of publicly-funded users of social care services annually via the ASCS to populate the ASCOF indicator set (NHS Digital, Citation2017). As well as being used as an indicator in the ASCOF in England, the preference-weightedFootnote1 ASCOT-SCT4 (Netten, et al., Citation2012; Potoglou et al., Citation2011) has also been recommended for use in economic evaluation (Bulamu, Kaambwa, & Ratcliffe, Citation2015; Makai, Brouwer, Koopmanschap, Stolk, & Nieboer, Citation2014) and to determine the effectiveness of social care (Bauer et al., Citation2017; Callaghan, Brookes, & Palmer, Citation2017). The ASCOT-SCT4 has been used in a number of studies to evaluate the effectiveness of social care policy and interventions (for example, the evaluation of Individual Budgets in England (Netten et al., Citation2011)) and has been translated and culturally adapted for use in other countries (for example, the Netherlands (Van Leeuwen et al., Citation2015)).
The broad concept of QoL includes objective and subjective components (Schalock et al., Citation2002). Within this broad concept of QoL, the ASCOT-SCT4 is designed to capture subjective aspects of SCRQoL valued by social care service users (Netten et al., Citation2012). This is based on the principle of measuring social care outcomes from the service user’s perspective of their needs and preferences. The measurement of subjective QoL for people with intellectual and developmental disabilities (IDD), however, is fraught with methodological and conceptual challenges (Finlay & Lyons, Citation2001; Hatton, Citation1998). The communication difficulties experienced by a large number of people with IDD in understanding information, expressing views and/or social interaction present a significant challenge (Bradshaw, Citation2001; Bunning, Citation2011; Kelly, Citation2017). In general, the more severe the IDD, the greater the likelihood of complex communication challenges (Grove, Bunning, Porter, & Olsson, Citation1999). Adjustments (for example, sign or symbol-based systems, like Makaton (Grove & Walker, Citation1990)) are needed in order to enable communicative opportunities (Goldbart & Caton, Citation2010). The precise prevalence of literacy difficulties amongst adults with IDD is not known (Fajardo et al., Citation2014); however, the Royal College of Speech and Language Therapists (Royal College of Speech and Language Therapists, Citation2013) suggest that fewer than 10% of people with IDD are able to read and understand standard written text.
In the population of social care service users in England, it is estimated that 140,000 people (16%) receive support primarily due to IDD (NHS Digital, Citation2015a). Including their views in the wider context of an outcomes-driven approach is clearly important and is highlighted in Government policy strategy (Department of Health, Citation2009). It is increasingly recognised that some people with IDD are able to provide valid and reliable reports of their subjective experiences, although not every person may be able to due to lack of opportunity, experience, adaptations, cognitive or communication challenges (Emerson, Felce, & Stancliffe, Citation2013). Some approaches have sought to focus on objective aspects of QoL to avoid the issues associated with collecting subjective QoL data; however, subjective and objective reports of QoL are only weakly associated with each other and are not directly comparable (Cummins, Citation2005; Emerson et al., Citation2013). Therefore, the key question in the context of outcomes-based social care research and evaluation is how to promote wider inclusion of people with IDD when collecting subjective QoL data.
In a literature review, Beadle-Brown et al. (Citation2012) found that there has been limited progress on developing methods to support the inclusion of people with IDD in social care research. In particular, there is a notable absence of information on the effectiveness and validity of different approaches to the adaptation of standardised measures for use in research with people with IDD. Emerging research into the issues associated with the production of “accessible” written information has highlighted the diversity of methods and the limited evidence of their effectiveness (Chinn & Homeyard, Citation2016; Sutherland & Isherwood, Citation2016).
Previous research, which involved people with IDD, sought to develop an easy-read version of ASCOT-SCT4 (ASCOT-ER) as a self-report measure of subjective care-related QoL (Turnpenny et al., Citation2018). Easy-read seeks to make information accessible by using plain language, simple layout and images to illustrate key concepts. Guidelines for easy-read information have been produced, for example, (CHANGE, Citation2016; MENCAP, Citation2002). There is limited evidence that adapting text using easy-read principles (e.g., avoiding the passive voice, jargon or complex words, and using larger font, fewer words and short paragraphs) increases comprehension of print or online written information (Karreman, van der Geest, & Buursink, Citation2007; Pothier, Day, Harris, & Pothier, Citation2008). There is mixed evidence for the use of symbols, pictures and images to support comprehension, with some indication that photographs or complex images may potentially confuse rather than improve comprehension (Hurtado, Jones, & Burniston, Citation2014; Sutherland & Isherwood, Citation2016). Despite the paucity of evidence, easy-read is widely used in the UK and it is an acceptable way of seeking to make information more accessible (Hurtado et al., Citation2014; Sutherland & Isherwood, Citation2016).
While the validity of the ASCOT-SCT4 has been established with older adults, younger adults with physical and sensory impairment and adults with mental health problems (Malley et al., Citation2012; Netten et al., Citation2012; Rand, Malley, Towers, Netten, & Forder, Citation2017), the psychometric properties of the adapted the ASCOT-ER have not yet been established. Therefore, this study aims to establish the feasibility of collecting ASCOT-ER data, as well as the construct validity and factor structure of the scale.
Methods
Recruitment of participants
The research team established a partnership with an organisation that provides services to adults with IDD to support the recruitment of participants to the study. A further 10 organisations (9 care providers and 1 local authority) were recruited through an advert on Twitter. The study included sites across 21 local authorities, including metropolitan districts (2), unitary authorities (2), shire counties (15) and London boroughs (2). The care organisations provided a range of services including supported living, domiciliary care, residential care, day opportunities and respite care. Participating organisations distributed study packs to potential participants based on the eligibility criteria: (1) adults aged 18 years or older who used social care services; (2) able to consent to participate; and (3) complete the questionnaire alone or with support. Each pack contained an easy-read information sheet, consent form and questionnaire. The participating organisations were briefed to give a study pack to all potential participants within their organisations. A total of 1,109 study packs were distributed between January and September 2017.
Procedure
Ethical approval for the study was obtained from the Social Care Research Ethics Committee in England (Ref: 16-IEC08-0029) with local research governance approval.
Each potential participant received the study information and questionnaire to complete if s/he wished to do so. (If they did not want to participate, no further action was needed.) Anyone who wanted to participate in the study could ask for help, for example, by reading aloud the questions or writing the answers. Importantly, however, the participating organisations were briefed that questionnaires were not to be completed on behalf of someone. To ensure questionnaires were not completed on someone’s behalf without reference to the person’s views (“by proxy”) the questionnaire included two items to capture whether any help was given and the source or type of help. Where it was reported that the questionnaire had been completed “by proxy”, the data were excluded from the analysis.
Staff at participating organisations were also asked to complete a brief supplementary questionnaire to capture basic information of the context and type of support used by the respondent. (This was designed to reduce the burden on participants by minimising the questionnaire length, which was a consideration raised in ethical and research team review of the original questionnaire with input from a working group of adults with IDD.) The questionnaire and supplementary information were returned to the research team in a pre-paid envelope for data entry. Of the distributed questionnaires, 269 completed questionnaires were returned. Five were excluded from the analysis due to proxy response (n = 4) or duplicate response (n = 1).
Sample
The characteristics of the sample (n = 264) are summarised in . The majority of respondents were aged under 65 years (93.2%) and were not in full- or part-time work (63.4%). The sample included more men than women (54.0%). Of those cases where the supplementary questionnaire was completed (n = 143, 54.2%), the majority of respondents were resident in supported living (n = 88) or registered care homes (n = 36). Only 13.3% of respondents lived in their own home (n = 9) or with family (n = 10). The sample included a balance of those who used residential support only (31.4%), day services only (31.4%), or a combination of residential support and day opportunities (37.3%).
Table 1. Sample characteristics.
Questionnaire
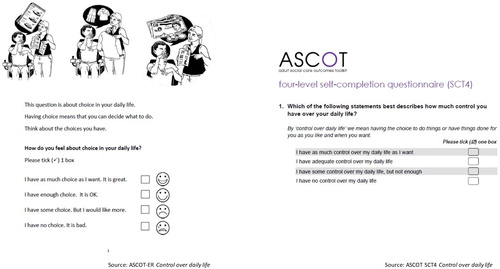
The questionnaire included the easy-read adaptation of the ASCOT-SCT4 (Turnpenny et al., Citation2018). The ASCOT-ER sought to apply easy-read principles while retaining the key concepts and overall structure of the ASCOT-SCT4 (Turnpenny et al., Citation2018): for example, in collecting data from the eight SCRQoL domains in the ASCOT-SCT4 (Netten et al., Citation2012) (see ). The ASCOT-ER also retained the ASCOT-SCT4’s four response levels that correspond to outcome states from the worst (“high-level needs”) through to the best (“ideal state”), where the person’s needs are met to the preferred level (Netten et al., Citation2012). Beyond this, however, substantial changes were applied to the original wording and layout of the ASCOT-SCT4 questionnaire based on in-depth feedback from people with IDD in a working group, focus groups and one-to-one interviews to improve acceptability, face validity, comprehension and ease of response (Turnpenny et al., Citation2018). Images developed in partnership with CHANGE, an organisation that promotes accessible information for people with IDD (www.changepeople.org), were also included to illustrate each domain and the four response options (Turnpenny et al., Citation2018).
Table 2. Definition of ASCOT-ER attributes.
An example of one of the ASCOT-ER items is shown in . (The full questionnaire is available by registering on the ASCOT website, www.pssru.ac.uk/ascot). Although there are English preference weights available for the ASCOT-SCT4 (Netten et al., Citation2012; Potoglou et al., Citation2011), preference weights have not yet been developed for the adapted ASCOT-ER. Therefore, the analysis presented in this paper uses the overall unweighted SCRQoL score derived from the sum of each item. The four response options were scored at the ideal state (3), no needs (2), some needs (1) or high-level needs (0) (Netten et al., Citation2012; Turnpenny et al., Citation2018). By contrast to the ASCOT-SCT4, which has a single Personal safety item that relates overall to feeling safe inside and outside of the home, the ASCOT-ER has two separate items to capture personal safety inside and outside of the home. This was found to improve item comprehension and acceptability (Turnpenny et al., Citation2018). The scoring of the ASCOT-ER uses the lower of the two personal safety item scores (i.e., the worst outcome state) based on the rationale that the ASCOT seeks to identify unmet social care outcome needs, whilst also maintaining comparability with the original ASCOT-SCT4.
Figure 1. Example of ASCOT-ER item by comparison to the equivalent ASCOT-SCT4 item © University of Kent. Reprinted with permission from the University of Kent. All rights reserved.
The questionnaire also contained the Personal Wellbeing Index – Intellectual Disability (PWI-ID) (Cummins & Lau, Citation2005), which has been recommended for the measurement of outcomes for people with IDD using care support services (McGillivray, Lau, Cummins, & Davey, Citation2009; Townsend-White, Pham, & Vassos, Citation2012). This self-report measure of subjective wellbeing includes 7 items for each domain: standard of living; health; life achievement; personal relationships; personal safety; community-connectedness; and future security (Cummins & Lau, Citation2005). In this study, each item was rated on a 5-point scale from very sad (0) to very happy (4). The PWI-ID Index was calculated as the sum of the score for each item converted into a percentage of the maximum score (Cummins & Lau, Citation2005).
The self-report questionnaire collected participants’ age, gender, ethnicity, employment status and whether they lived alone. Other single items in the questionnaire related to satisfaction with support staff, overall QoL, general health, suitability of the home, accessibility of the local area, experience of anxiety or depression, and ability to undertake activities of daily living or instrumental activities of daily living (I/ADLs). Help to complete the questionnaire – and the type of help (if applicable) – was also recorded. These questions were based on the easy-read version of the Adult Social Care Survey in England. There was a supplementary questionnaire to be completed by staff to record the living context (i.e., supported living, registered care home, live with family or in own home) and the type of services used (i.e., residential support, day support, or a combination of residential and day support).
Data analysis
Analyses were conducted in Stata version 13 (Statacorp, Citation2013).
Feasibility
The initial development of the ASCOT-ER explored the acceptability of the format and content of the questionnaire, as well as its feasibility in terms of item comprehension and response (Turnpenny et al., Citation2018). In this study, feasibility was evaluated by the proportion of missing data and help to complete the questionnaire.
Exploratory factor analysis
Exploratory factor analysis (EFA) was conducted to examine the factor structure of the questionnaire. The suitability of the data for EFA was determined by the Bartlett test of sphericity (Bartlett, Citation1954) and by inspection of the Kaiser Meyer-Olkin measure of sampling adequacy (Kaiser, Citation1974). Because Pearson correlation coefficients may lead to incorrect conclusions with categorical variables, like the ASCOT-ER items, polychoric correlations were applied to the EFA (Holgado-Tello, Chacón-Moscoso, Barbero-García, & Ila-Abad, Citation2010; Olsson, Citation1979). Mardia’s test for skewness indicated that the data were not multivariate normal (Mardia, Kent, & Bibby, Citation1979); therefore, principal axis factoring was used for the factor extraction (Fabrigar, Wegener, Maccallum, & Trahan, Citation1999). The number of factors to retain was guided by parallel analysis (Fabrigar et al., Citation1999; Horn, Citation1965; Humphreys & Montanelli, Citation1975) and scree plot inspection (Cattell, Citation1966; Fabrigar et al., Citation1999). We also only retained factors if two or more items loaded onto the factor at a significant level. This was defined as a factor loading of ≥0.40 (Hair, Tatham, Anderson, & Black, Citation1998; Stevens, Citation1992).
Internal reliability
The internal consistency across the items in the ASCOT-ER was assessed using Cronbach’s alpha (Cronbach, Citation1951).
Construct validity
Construct validity refers to the extent to which an instrument measures what it is intended to measure (Hays, Anderson, & Revicki, Citation1993), which may be evaluated by testing whether the measure behaves as expected against hypotheses (Cronbach & Meehl, Citation1955). In this study, we tested the hypothesised direction and strength of Spearman’s rho correlation coefficients between the ASCOT-ER SCRQoL and measures of conceptually-related constructs. In the absence of a gold-standard measure of SCRQoL with which to assess criterion validity (Hays et al., Citation1993), the focus of this study was on the relationships with two measures of related constructs: (1) QoL measured on a single item with 5-levels of response; and (2) personal wellbeing (PWI-ID). We anticipated a moderate to strong positive correlation between ASCOT-ER SCRQoL and overall QoL or personal wellbeing.
Hypothesised associations between ASCOT-ER and PWI-ID attributes were also tested using Fisher’s exact test followed by Cramer’s V to indicate the strength of association based on the rule of thumb of V = 0.1 represents a small effect size, V = 0.3 a medium effect size, and V = 0.5 a large effect size (Cohen, Citation1988). We expected to find moderate to strong correlations between attributes that capture related constructs. Specifically, we expected to observe positive relationships between rating of ASCOT-ER and PWI-ID Personal safety; ASCOT-ER Occupation (doing things you value and enjoy) and PWI-ID life achievement (satisfaction with things you make and learn); and ASCOT-ER Social participation with PWI-ID community-connectedness and personal relationships. The PWI-ID captures aspects of wellbeing that do not overlap with the ASCOT-ER – specifically, the domain of future security – for which we expected to find weak correlation with the ASCOT-ER items. Likewise, the ASCOT-ER captures aspects of SCRQoL that do not correspond to any of the PWI-ID items – specifically, Accommodation, Personal comfort and cleanliness, and Food and drink. Although these ASCOT-ER domains may be related to aspects of health and underlying disability captured by the PWI-ID health, weak correlations were expected with other PWI-ID items.
The construct validity of the ASCOT-ER was also evaluated by testing hypothesised associations between SCRQoL and individual characteristics. These hypotheses were developed based on theoretical basis of the construct of ASCOT-ER SCRQoL, which is conceptualised to be a function of the individual’s characteristics (e.g., health, disability), their local environment and the intensity and effectiveness of social care support (Forder and Caiels, Citation2011; Netten et al., Citation2012; Forder et al., Citation2016). As such, we tested expected associations with the individual’s self-rated health, level of social care need (as indicated by the number of I/ADLs with difficulty), the suitability of the home environment for the person’s needs, the accessibility of the person’s local area and satisfaction with social care support (see for further details). The hypotheses were tested using one-way ANOVA with Cohen’s d to indicate effect size based on the rule of thumb that d = 0.2 represents a small effect size, d = 0.5 a medium effect size and d = 0.8 a large effect size (Cohen, Citation1988). We also report multivariate regression analysis to consider the relationship between SCRQoL and each individual characteristic, whilst controlling for the other variables.
Table 3. Expected associations between individual characteristics and ASCOT-ER SCRQoL.
Results
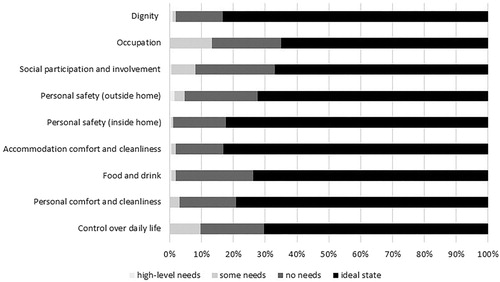
The ASCOT-ER SCRQoL distribution is negatively skewed with the maximum score reported by 29.0% of the sample (mean 21.51; standard deviation 2.77; range 11–24, see ). The negative skew is more pronounced than for the standard version of the ASCOT-SCT4 (2015/16 ASCS: mean 17.9; standard deviation 4.16; range 0–24), although it is comparable to the data collected from the easy-read version of the ASCSFootnote2 (mean 21.1; standard deviation 2.78; range 1–24). The reporting of outcome state by SCRQoL attribute is shown in . None of the respondents reported high-level needs for three of the eight domains (Control over daily life, Personal comfort and cleanliness, and Occupation), with less than 2% of the sample reported high-level needs for the remaining domains.
Figure 2. ASCOT-ER distribution.
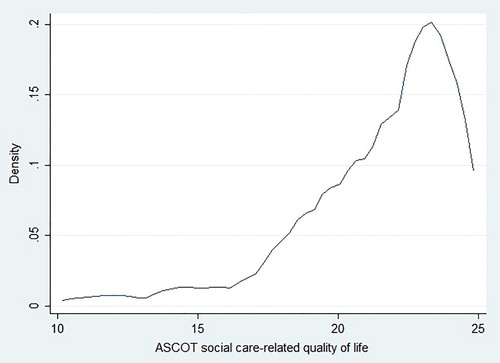
Figure 3. ASCOT-ER: Frequency of reporting each response level by attribute.
The majority of respondents (74.0%) reported the same outcome state for the two Personal safety items. Where there was a discrepancy in the rating for these two items, the Personal safety item with the lower QoL score was used to score SCRQoL. In most cases (18.6%), the respondents reported worse QoL for Personal safety outside of the home compared to inside the home.
Feasibility
The survey response rate was 23.8%, with the return of 264 completed questionnaires. This is lower than the response rate of users of community-based social care services who were sent a copy of the easy-read (42.8%) or standard versions of the questionnaire (36.5%) in the 2015/16 ASCS; however, it is higher than the response rate for surveys of adult social care users conducted for research purposes (<15%) (Forder, et al., Citation2016).
The majority of respondents (n = 245, 92.8%) completed all nine items in the ASCOT-ER questionnaire. Of the 19 cases of missing data, 13 (4.9%) were due to non-completion of only one item. Consistent with the ASCOT-SCT4 (Netten et al., Citation2012; Rand et al., Citation2017), the ASCOT-ER Dignity item had the highest frequency of missing values (n = 7, 2.7%). Missing values were also observed for all other items: Occupation (n = 1), Social participation and involvement (n = 3) and the six remaining attributes (n = 4). The rate of missing data is lower than that found in the 2015/16 ASCS in England (NHS Digital, Citation2016), which included the unrevised easy-read version of ASCOT (Malley et al., Citation2010; NHS Digital, Citation2015b) and for which the rate of missing ASCOT data was 2.5% to 4.5%. The rate of ASCOT-ER missing values is comparable to the PWI-ID, which also had 19 cases of missing data for the overall scale with between 1% and 4.5% missing values for each item.
The type of help to complete the questionnaire is summarised in . Most respondents reported that they had help to complete the questionnaire (n = 240, 90.9%). This is slightly lower than the proportion of those who had help in the 2015/16 ASCS sample that completed the easy-read questionnaire with the exclusion of proxy responses (92.9%). The majority of respondents had help from care staff (n = 226, 85.6%). This is higher than the ASCS 2015/16 (53.8%), which may be due to the recruitment method for this study via care organisations. (In the ASCS, people in residential care were more likely to report help from staff (82.8%) compared to people living in the community (44.9%)). The most commonly-reported type of help was to read the questions aloud (n = 192, 73.3%) or to explain the questions (n = 172, 65.6%). Less than half of respondents (n = 114, 43.5%) had help to tick boxes to indicate a response. Only 27.9% (n = 73) indicated that they talked through their answers with someone. This pattern of the type of help is consistent with the ASCS 2015/16: help to read aloud the questions (67.4%), translate the questions (67.2%), indicate answers by tick-box response (51.2%) and/or talk through answers (28.6%).
Exploratory factor analysis
The polychoric correlations were calculated for the eight items used to score the ASCOT-ER. Of these, there are five strong (>0.50) correlations between the items Control over daily life, Social participation and Occupation. Weak correlations (<0.30) were found between Accommodation or Food and drink and other items. The remainder of the item correlations are moderate (0.30–0.50). The Kaiser Meyer-Olkin statistic of sampling adequacy was very good (KMO = 0.83), with KMO values for all items >0.75, which is well above the acceptable limit of 0.5 (Kaiser, Citation1974). Bartlett’s test of sphericity (Χ2 (28) = 353.71, p < 0.001) indicated that the correlations between items were sufficient for EFA to be conducted. Inspection of the scree plot and parallel analysis from the initial analysis indicated a single factor solution. This factor represented an eigenvalue of 3.31. The second factor had an eigenvalue of 0.28, which is less than the Kaiser criterion of 1.0 (Kaiser, Citation1974). All items loaded strongly onto the single factor (≥0.40, see ). By contrast to the standard version of the ASCOT-SCT4 where all items were found to have a high unique variance (Netten et al., Citation2012), only five of the eight attributes have a uniqueness of ≥0.50. The items for Control over daily life, Social participation and Occupation have moderate to low uniqueness, which indicates some overlap between these attributes. Despite this difference, the findings indicate that the ASCOT-ER, like the ASCOT-SCT4, forms a unidimensional scale.
Table 4. Exploratory factor analysis.
Internal reliability
Cronbach’s alpha (8 items) was 0.75, which is an acceptable value for a unidimensional scale with an average inter-item correlation of 0.58 (Cortina, Citation1993).
Construct validity
There was a moderate positive correlation between ASCOT-ER SCRQoL and measures of the related constructs of overall QoL and personal wellbeing (). Significant weak-moderate positive correlations were also observed between each of the nine ASCOT-ER items and personal wellbeing.
Table 5. Correlation between ASCOT-ER SCRQoL and overall QoL or PWI-ID.
Fisher’s exact tests were used to explore the hypothesised correlations between ASCOT-ER and PWI-ID item scores (). As hypothesised, there was a significant moderate relationship between ASCOT-ER Personal safety, inside and outside of the home, and PWI-ID Personal Safety (Cramer’s V = 0.30, 0.26 respectively). The hypothesised strong-moderate relationship between ASCOT-ER Occupation and PWI-ID life achievement was, however, found to be only weak-moderate (Cramer’s V = 0.23). The expected associations between ASCOT-ER Social participation and PWI-ID community-connectedness and personal relationships were also found to be weak (Cramer’s V = 0.15, 0.18 respectively). This may reflect the differences in the content and rating of the items in the two instruments. The ASCOT-ER, for example, asks about “how you spend your time” in relation to free time or leisure, going to work, college or volunteering or housework with rating according to whether the person is able to spend their time as s/he wants (Occupation). By contrast, the PWI-ID asks how happy the person is with the things they make or learn with rating by happiness (life achievement). As expected, there were weak correlations between the PWI-ID future security item score and all of the ASCOT-ER item scores (Cramer’s V = 0.08–0.20), of which only three reached significance at the 5% level. As anticipated, the majority of comparisons between the ASCOT-ER domains related to basic SCRQoL domains – Food and drink, Accommodation and Personal comfort and cleanliness – had only weak relationships. Of the 18 comparisons, excluding those with PWI-ID health, only nine reached significance at the 5% level. All were weak or weak-moderate associations (Cramer’s V ≤0.30).
Table 6. Fisher’s exact test (with Cramer’s V) between ASCOT-ER and PWI-ID attributes.
The results of the hypothesis testing analyses are shown in . In the multivariate analysis, four of the five variables considered in the model were significantly associated with SCRQoL. In the bivariate analysis, there was a trend towards significance and a weak effect size for the comparison between level of disability and SCRQoL (p = 0.07, d = 0.25). After controlling for the other variables including overall health in the OLS regression, however, the relationship was no longer significant (p = 0.904). Satisfaction with social care was found to be a key predictor of SCRQoL (β = 0.304, p < 0.001), which is consistent with the conceptual basis of the instrument as a measure of aspects of QoL that may be targeted by social care support.
Table 7. Relationship between ASCOT-ER SCRQoL and individual characteristics.
Although help to complete the questionnaire was not included in the multivariate regression due to the small number of cases where the respondent did not receive help (n = 23), there was a significant association with a moderate effect size between help and SCRQoL (F (1,242) = 6.65, p = .01, ω = .64). Those who received help to complete the questionnaire reported, on average, higher SCRQoL than the respondents who completed the questionnaire without help. None of the associations between SCRQoL and type of help (read, write, explain or talk through) were significant at the 5% level with small effect sizes (see ).
Discussion
The purpose of this study was to evaluate the feasibility, construct validity and factor structure of the ASCOT-ER. Of the respondents, 92.8% completed all ASCOT-ER items. There was a low rate of missing data for each item. While the 91% of the sample reported having help to complete the questionnaire, this is comparable to the proportion of service users who reported having help to complete the 2015/16 ASCS in England (NHS Digital, Citation2016). Taken together, this provides tentative evidence that the ASCOT-ER is a feasible method of collecting SCRQoL in surveys of adults with IDD who may benefit from an adapted easy-read format.
It is important, however, to recognise that this method of data collection will not be accessible to everyone. Based on the high proportion of help to complete the questionnaire, it may be better to collect ASCOT-ER data as a default by interview rather than rely on a paper-based survey combined with help from whatever source available. This would address issues of equity of access to completion of the data, regardless of the availability of formal or informal sources of help. This is also supported by evidence of statistically significant associations between the type and/or source of help to complete the questionnaire and SCRQoL, after controlling for other variables (Rand & Malley, Citation2016). If it is not feasible to collect data by one method (e.g., face-to-face interview), then another approach to address this would be to control for the mode of data collection, source and type of help in analysis and interpretation.
The construct validity of the ASCOT-ER was supported by the findings of this study. Correlation analysis to test the hypothesised associations between ASCOT-ER and measures of the related constructs (overall QoL, personal wellbeing) generally confirmed the expected relationships with limited exceptions. There were stronger correlations between ASCOT-ER and PWI-ID domains that overlapped conceptually (e.g., the ASCOT-ER and PWI-ID items for personal safety). By contrast, the ASCOT-ER domains that relate to basic care-related aspects of QoL (e.g., Personal comfort and cleanliness) were only weakly correlated to the QoL item and PWI-ID. The hypothesised associations between ASCOT-ER SCRQoL and individual characteristics were also observed in univariate and multivariate analysis, which further supports the construct validity of the ASCOT-ER. The EFA indicates that the ASCOT-ER is a unidimensional measure.
There are some limitations to this study. First, the relatively modest sample for this study is only adequate for EFA under moderate conditions, which may give rise to under-factoring (Fabrigar et al., Citation1999). Second, the study design may have influenced the level, type and source of help to complete the questionnaire. The recruitment of participants through care providers may have led to the high proportion of the sample reporting that they had help from care staff by comparison to other surveys of social care service users in England (NHS Digital, Citation2016). The sample size also precluded in-depth exploration of the type of help to complete the questionnaire and ASCOT-ER SCRQoL. Finally, we were not able to establish the instrument’s test-retest reliability with a follow-up data collection due to limitations on resources and the sample size.
Related to these limitations are a number of directions for future research. Further collection would be justified to replicate the EFA and apply confirmatory factor analysis to confirm the scale’s unidimensionality. A study with a larger sample would also enable a follow-up survey of participants to establish the instrument’s test-retest reliability. Further exploration of potential bias due to the effect and type of help is also justified. While the brevity of the ASCOT-ER and its four response-level structure may support its feasibility, acceptability and face validity as a comparable measure to the ASCOT-SCT4, there is some evidence that further work is justified to explore whether additional items or response options would address the issue of the skewed distribution of responses. Finally, preference weights have been developed for the ASCOT-SCT4 to enable the use of the instrument in economic evaluation (Netten et al., Citation2012; Potoglou et al., Citation2011). If the ASCOT-ER is to contribute towards the wider inclusion of people with IDD in the evaluation of care practice and policy that may influence decisions in relation to commissioning, resourcing and access to services, then an important next step is the development of preference weights for the instrument.
Conclusion
The ASCOT-ER is a promising new instrument for measuring SCRQoL of service users who may find it difficult to complete the ASCOT-SCT4. While previous qualitative research has established its acceptability with adults with IDD, this study has established the construct validity and unidimensionality of ASCOT-ER SCRQoL. Further work is needed to establish the instrument’s test-retest reliability and also further explore the issue of feasibility in social care data collections. While the instrument may be used to evaluate the effectiveness of care services, the development of preference weights for the ASCOT-ER would be required to allow the views of service users with IDD to be considered in evaluation studies that shape and inform the provision of services.
Acknowledgements
We would like to acknowledge and thank Jane Dennett and Amanda Burns for their support with the data collection. All authors have seen, contributed to, and approved of the manuscript.
Disclosure statement
No potential conflict of interest was reported by the authors.
ORCID
Stacey Rand http://orcid.org/0000-0001-9071-2842
Ann-Marie Towers http://orcid.org/0000-0003-3597-1061
Agnes Turnpenny http://orcid.org/0000-0003-4889-5993
Nick Smith http://orcid.org/0000-0001-9793-6988
Additional information
Funding
Notes
* This article is based on independent research commissioned and funded by the NIHR Policy Research Programme (Quality and Outcomes of person-centred care policy Research Unit). The views expressed in the publication are those of the authors, and not necessarily those of the NHS, the NIHR, the Department of Health or its arm’s length bodies, or other government departments.
1 Preference-based measures like the ASCOT-SCT4 may be used in economic analysis of interventions or policy to establish their cost-effectiveness. With these instruments, each possible response (“outcome state”) is linked to an estimate of its value – its preference weight. The preference weights may be estimated using different methods to estimate the value of each outcome state (for example, the time trade-off method).
2 The ASCS 2015/16 included an easy-read adaptation of the ASCOT developed specifically for the ASCS, rather than the ASCOT-ER developed by Turnpenny et al., Citation2018.
Related Research Data
References
- Barnes, S. (2002). The design of caring environments and the quality of life of older people. Ageing & Society, 22, 775–789. doi: 10.1017/S0144686X02008899
- Bartlett, M. S. (1954). A note on multiplying factors for various chi-squared approximations. Journal of the Royal Statistical Society, Series B, 16, 296–298.
- Bauer, A., Knapp, M., Wistow, G., Perkins, M., King, D., & Iemmi, V. (2017). Costs and economic consequences of a help-at-home scheme for older people in England. Health and Social Care in the Community, 25(2), 780–789. doi: 10.1111/hsc.12372
- Beadle-Brown, J., Ryan, S., Windle, K., Holder, J., Turnpenny, A., Smith, N., Richardson, L., & Whelton, B. (2012). Engagement of people with long term conditions in health and social care research, QORU Discussion Paper 2849, PSSRU, University of Kent: Canterbury. https://www.pssru.ac.uk/pub/4390.pdf
- Bovaird, T. (2014). Attributing outcomes to social policy interventions – ‘gold standard’ or ‘fool's gold’ in public policy and management? Social Policy and Administration, 48, 1–23. doi: 10.1111/j.1467-9515.2012.00869.x
- Bovaird, T., & Löffler, E. (2002). Moving from excellence models of local service delivery to benchmarking ‘good local governance’. International Review of Administrative Sciences, 68, 9–24. doi: 10.1177/0020852302681001
- Bovaird, T., & Löffler, E. (2003). Evaluating the quality of public governance: Indicators, models and methodologies. International Review of Administrative Sciences, 69, 313–328. doi: 10.1177/0020852303693002
- Bradshaw, J. (2001). Complexity of staff communication and reported level of understanding skills in adults with intellectual disability. Journal of Intellectual Disability Research, 45, 233–243. doi: 10.1046/j.1365-2788.2001.00318.x
- Bulamu, N. B., Kaambwa, B., & Ratcliffe, J. (2015). A systematic review of instruments for measuring outcomes in economic evaluation within aged care. Health and Quality of Life Outcomes, 13(179), doi: 10.1186/s12955-015-0372-8
- Bunning, K. (2011). Let me speak – facilitating communication. In H. L. Atherton & D. J. C (Eds.), Learning disabilities toward inclusion (6th ed., pp. 91–111). London: Elsevier Churchill Livingstone.
- Burton, E. J., Mitchell, L., & Stride, C. B. (2011). Good places for ageing in place: development of objective built environment measures for investigating links with older people's wellbeing. BMC Public Health, 11(839), 1–13. doi: 10.1186/1471-2458-11-839
- Callaghan, L., Brookes, N., & Palmer, S. (2017). Older people receiving family-based support in the community: A survey of quality of life among users of ‘shared lives’ in England. Health and Social Care in the Community, 25(5), 1655–1666. doi: 10.1111/hsc.12422
- Cattell, R. B. (1966). The scree test for the number of factors. Multivariate Behavioral Research, 1, 245–276.
- CHANGE. (2016). How to make information accessible: A guide to producing easy read documents.
- Chinn, D., & Homeyard, C. (2016). Easy read and accessible information for people with intellectual disabilities: Is it worth it? A meta-narrative literature review. Health Expectations, 1–12. doi: 10.1111/hex.12520
- Cohen, J. (1988). Statistical power and analysis for the behavioral sciences (2nd ed.). Hillsdale, NJ: Lawrence Erlbaum Associates, Inc.
- Cook, R. D., & Weisberg, S. (1983). Diagnostics for heteroscedasticity in regression. Biometrika, 70, 1–10.
- Cortina, J. (1993). What is coefficient alpha? An examination of theory and applications. Journal of Applied Psychology, 78(1), 98–104.
- Cronbach, L. (1951). Coefficient alpha and the internal structure of tests. Psychometrika, 16(Journal Article), 297–334.
- Cronbach, L., & Meehl, P. E. (1955). Construct validity in psychological tests. Psychological Bulletin, 52, 281–302.
- Cummins, R. A. (2005). Moving from the quality of life concept to a theory. Journal of Intellectual Disability Research, 49(10), 699–706. doi: 10.1111/j.1365-2788.2005.00738.x
- Cummins, R. A., & Lau, A. L. D. (2005). Personal wellbeing index – intellectual disability (3rd ed). Melbourne: Victoria.
- Department of Health. (2009). Valuing people now: A new three-year strategy for people with learning disabilities. Retrieved from https://www.gov.uk/government/uploads/system/uploads/attachment_data/file/215891/dh_122387.pdf
- Department of Health. (2011). Transparency in outcomes: A framework for quality in adult social care. The 2011/12 Adult Social Care Outcomes Framework. London.
- Department of Health. (2017). The adult social care outcomes framework 2016/17: Handbook of definitions. London. Retrieved from https://www.gov.uk/government/uploads/system/uploads/attachment_data/file/629812/ASCOF_handbook_definitions.pdf
- Emerson, E., Felce, D., & Stancliffe, R. J. (2013). Issues concerning self-report data and population-based data sets involving people with intellectual disabilities. Intellectual and Developmental Disabilities, 51(5), 333–348. doi: 10.1352/1934-9556-51.5.333
- Fabrigar, L. R., Wegener, D. T., Maccallum, R. C., & Trahan, E. J. (1999). Evaluating the use of exploratory factor analysis in psychological research. Psychological Methods, 4, 272–299. doi: 10.1037/1082-989X.4.3.272
- Fajardo, I., Vila, V., Ferrer, A., Tavares, G., Gómez, M., & H, A. (2014). Easy-to-read texts for students with intellectual disability: Linguistic factors affecting comprehension. Journal of Applied Research in Intellectual Disabilities, 27(3), 212–225. doi: 10.1111/jar.12065
- Finlay, W. M., & Lyons, E. (2001). Methodological issues in interviewing and using self-report questionnaires with people with mental retardation. Psychological Assessment, 13(3), 319–335. doi: 10.1037/1040-3590.13.3.319
- Forder, J., & Caiels, J. (2011). Measuring the outcomes of long-term care. Social Science and Medicine, 73(12), 1766–1774. https://doi.org/10.1016/j.socscimed.2011.09.023
- Forder, J., Malley, J., Rand, S., Vadean, F., Jones, K., & Netten A. (2016). Identifying the impact of adult social care: Interpreting outcome data for use in the Adult Social Care Outcomes Framework, QORU Discussion Paper 2892, PSSRU, University of Kent: Canterbury. https://www.pssru.ac.uk/pub/4633.pdf
- Gilroy, R. (2008). Places that Support Human Flourishing: Lessons from Later Life. Planning Theory and Practice, 9(2), 145–163. doi: 10.1080/14649350802041548
- Goldbart, J., & Caton, S. (2010). Communication and people with the most complex needs: What works and why this is essential. Retrieved from https://e-space.mmu.ac.uk/198309/1/Mencap%20Comms_guide_dec_10.pdf
- Grove, N., Bunning, K., Porter, J., & Olsson, C. (1999). See what I mean: Interpreting the meaning of communication by people with severe and profound intellectual disabilities. Journal of Applied Research in Intellectual Disabilities, 12, 190–203. doi: 10.1111/j.1468-3148.1999.tb00076.x
- Grove, N., & Walker, M. (1990). The Makaton vocabulary: Using manual signs and graphic symbols to develop interpersonal communication. Alternative and Augmentative Communication, 6(1), 15–28.
- Hair, J. F., Tatham, R. L., Anderson, R. E., & Black, W. (1998). Multivariate data analysis (5th ed.). London: Prentice-Hall.
- Hatton, C. (1998). Whose quality of life is it anyway? Some problems with the emerging quality of life consensus. Mental Retardation, 36(2), 104–115. doi: 10.1352/0047-6765
- Hays, R. D., Anderson, R., & Revicki, D. (1993). Psychometric considerations in evaluating health-related quality of life measures. Quality of Life Research, 2(6), 441–449.
- Holgado-Tello, F., Chacón-Moscoso, S., Barbero-García, I. V., & Ila-Abad, E. (2010). Polychoric versus Pearson correlations in exploratory and confirmatory factor analysis of ordinal variables. Quality and Quantity, 44, 153–166.
- Horn, J. L. (1965). A rationale and technique for estimating the number of factors in factor analysis. Psychometrika, 30, 179–185.
- Huber, P. J. (1967). The behavior of maximum likelihood estimates under non-standard conditions. Fifth Berkeley Symposium on Mathematical Statistics and Probability.
- Humphreys, L. G., & Montanelli Jr, R. G. (1975). An investigation of the parallel analysis criterion for determining the number of common factors. Multivariate Behavioral Research, 10, 193–205.
- Hurtado, B., Jones, L., & Burniston, F. (2014). Is easy read information really easier to read? Journal of Intellectual Disability Research, 58(9), 822–829. doi: 10.1111/jir.12097
- Kaiser, H. F. (1974). An index of factor simplicity. Psychometrika, 39, 31–36.
- Karreman, J., van der Geest, T., & Buursink, E. (2007). Accessible website content guidelines for users with intellectual disabilities. Journal of Applied Research in Intellectual Disabilities, 20(6), 510–518. doi: 10.1111/j.1468-3148.2006.00353.x
- Kelly, A. (2017). Developing social skills. Tizard Learning Disability Review, 22(3), 159–163.
- Makai, P., Brouwer, W., Koopmanschap, M., Stolk, E., & Nieboer, A. (2014). Quality of life instruments for economic evaluations in health and social care for older people: A systematic review. Social Science & Medicine, 102, 83–93. doi: 10.1016/j.socscimed.2013.11.050
- Malley, J., Caiels, J., Fox, D., McCarthy, M., Smith, N., Beadle-Brown, J., … Towers, A. (2010). A report on the development studies for the national social care user experience survey. Canterbury. Retrieved from http://www.pssru.ac.uk/pub/dp2721.pdf
- Malley, J., Towers, A., Netten, A., Brazier, J., Forder, J., & Flynn, T. (2012). An assessment of the construct validity of the ASCOT measure of social care-related quality of life with older people. Health and Quality of Life Outcomes, 10, 21. doi: 10.1186/1477-7525-10-21
- Mardia, K. V., Kent, J. T., & Bibby, J. M. (1979). Multivariate analysis. London: Academic Press.
- McGillivray, J. A., Lau, A. L. D., Cummins, R. A., & Davey, G. (2009). The utility of the personal wellbeing Index intellectual disability scale in an Australian sample. Journal of Applied Research in Intellectual Disabilities, 22, 276–286. doi: 10.1111/j.1468-3148.2008.00460.x
- MENCAP. (2002). Am I making myself clear? Mencap's guidelines for accessible writing. Retrieved from http://www.accessibleinfo.co.uk/pdfs/Making-Myself-Clear.pdf
- Musselwhite, C., & Haddad, C. (2010). Mobility, accessibility and quality of later life. Quality in Ageing and Older Adults, 11(1), 25–37. doi: 10.5042/qiaoa.2010.0153
- Netten, A. (2011). Overview of outcome measurement for adults using social care services and support. NIHR School for Social Care Research, London School of Economics and Political Science: London. https://pdfs.semanticscholar.org/fa1f/d8de287c4c1690cb81a0c86cd4d6e342dc52.pdf
- Netten, A., Burge, P., Malley, J., Potoglou, D., Towers, A., Brazier, J., … Wall, B. (2012). Outcomes of social care for adults: Developing a preference weighted measure. Health Technology Assessment, 16(16), 1–165. doi: 10.3310/hta16160
- Netten, A., Jones, K., Knapp, M., Fernandez, J.-L., Challis, D., Glendinning, C., … Wilberforce, M. (2011). Personalisation through individual budgets: Does it work and for whom? The British Journal of Social Work, 42(8), 1556–1573.
- NHS Digital. (2015a). Community care statistics, social services activity, England - 2014–15 London.
- NHS Digital. (2015b). User survey guidance - 2015-16. Retrieved from http://content.digital.nhs.uk/ascs1516
- NHS Digital. (2016). Personal social services adult social care survey, England - 2015-16. Retrieved from http://content.digital.nhs.uk/catalogue/PUB21630
- NHS Digital. (2017). Social care user surveys. Retrieved from http://content.digital.nhs.uk/socialcare/usersurveys
- Olsson, U. (1979). Maximum likelihood estimation of the polychoric correlation coefficient. Psychometrika, 44, 443–460.
- Parker, C., Barnes, S., McKee, K., & Morgan, K. (2004). Quality of life and building design in residential and nursing homes for older people. Ageing & Society, 24(6), 941–962. doi: 10.1017/S0144686X04002387
- Pothier, L., Day, R., Harris, C., & Pothier, D. (2008). Readability statistics of patient information leaflets in a speech and language therapy department. International Journal of Language and Communication Disorders, 43(6), 712–722.
- Potoglou, D., Burge, P., Flynn, T., Netten, A., Malley, J., Forder, J., & Brazier, J. (2011). Best-worst scaling vs discrete choice experiments: An empirical comparison using social care. Social Science and Medicine, 72(10), 1717–1727. doi: 10.1016/j.socscimed.2011.03.027
- Pregibon, D. (1980). Journal of the Royal Statistical Society. Series C Applied Statistics, 29(1), 15–24.
- Ramsey, J. (1969). Tests for specification errors in classical linear least-squares regression analysis. Journal of the Royal Statistical Society, Series B, 31, 350–371.
- Rand, S., & Malley, J. (2016). The factors associated with care-related quality of life of adults with intellectual disabilities in England: Implications for policy and practice. Health and Social Care in the Community. doi: 10.1111/hsc.12354
- Rand, S., Malley, J., Towers, A., Netten, A., & Forder, J. (2017). Validity and test-retest reliability of the self-completion adult social care outcomes toolkit (ASCOT-SCT4) with adults with long-term physical, sensory and mental health conditions in England. Health and Quality of Life Outcomes, 15(163), 1–15.
- Royal College of Speech and Language Therapists. (2013). Five good communication standards. London: RCSLT.
- Schalock, R. L., Brown, I., Brown, R., Cummins, R. A., Felce, D., Matikka, L., … Parmenter, T. (2002). Conceptualization, measurement, and application of quality of life for persons with intellectual disabilities: Report of an international panel of experts. Mental Retardation, 40(6), 457–470. doi: 10.1352/0047-6765
- Statacorp. (2013). Stata data analysis statistical software: Release 13. College Station, TX: StataCorp LP.
- Stevens, J. P. (1992). Applied multivariate statistics for the social sciences (2nd ed). Hillsdale, NJ: Erlbaum.
- Sutherland, R. J., & Isherwood, T. (2016). The evidence for easy-read for people with intellectual disabilities: A Systematic literature review. Journal of Policy and Practice in Intellectual Disabilities. doi: 10.1111/jppi.12201
- Townsend-White, C., Pham, A. N. T., & Vassos, M. V. (2012). A systematic review of quality of life measures for people with intellectual disabilities and challenging behaviours. Journal of Intellectual Disability Research, 56(3), 270–284. doi: 10.1111/j.1365-2788.2011.01427.x
- Turnpenny, A., Caiels, J., Whelton, R., Richardson, L., Beadle-Brown, J., Crowther, T., … Rand, S. (2018). Developing an easy read version of the Adult Social Care Outcomes Toolkit (ASCOT). Journal of Applied Research in Intellectual Disabilities, 31(1), e36–e48. doi: 10.1111/jar.12294
- Van Leeuwen, K., Bosmans, J., Jansen, A., Rand, S., Towers, A., Smith, N., … Ostelo, R. (2015). Dutch translation and cross-cultural validation of the Adult Social Care Outcomes Toolkit (ASCOT). Health and Quality of Life Outcomes, 13(56), 1–13.
- Wahl, H.-W., Faenge, A., Oswold, F., Gitlin, L., & Iwarsson, S. (2009). The Home Environment and Disability-Related Outcomes in Aging Individuals: What Is the Empirical Evidence? Gerontologist, 49(3), 355–367. doi: 10.1093/geront/gnp056
- White, H. (1980). A heteroskedasticity-consistent covariance matrix estimator and a direct test for heteroskedasticity. Econometrica, 48, 817–830.