Abstract
Introduction: The value of clinically available free testosterone (FT) assays remains controversial. Here, we evaluate the agreement between the radioimmunoassay (RIA) and calculated FT (cFT) versus equilibrium dialysis (EqD), considered the gold standard.
Methods: Fifty-six consecutive men (aged 26–77) had blood samples assessed for FT, including men with treated and untreated testosterone deficiency (TD) and men without TD. Samples were split and tested by the two methodologies at a Quest Diagnostics national reference laboratory. cFT was calculated by the Vermeulen method.
Results: A robust correlation was noted for RIA and EqD (r = 0.966) and for cFT and EqD (r = 0.986). Strong correlations were observed for men receiving testosterone therapy and for men in the lowest and highest quartiles for total and FT. The correlation of total testosterone with FT was similar for cFT (r = 0.843), RIA (r = 0.806), and EqD (r = 0.809). Sex-hormone binding globulin (SHBG) was not correlated with any measure of FT. Bland–Altman analysis demonstrated similar bias for both cFT and RIA, although cFT consistently overestimated FT. Numerical values for RIA were approximately one seventh of EqD values.
Conclusions: These results support the clinical use of both RIA and cFT as measures of FT. Due to numerical differences, each test requires its own set of reference values.
Introduction
Circulating testosterone (T) is comprised of three fractions: tightly bound to sex-hormone binding globulin (SHBG), loosely bound to non-SHBG proteins (primarily albumin), and unbound, or free testosterone (FT). There is broad consensus that biologically active T consists of the fraction not bound to SHBG, and that FT measurement is an important indicator of bio-available T status in the diagnosis and management of testosterone deficiency (TD) [Citation1]. Most professional societies recommend the measurement of FT in equivocal clinical cases [Citation2], and others recommend its routine measurement in men suspected of TD [Citation7]. However, there is considerable uncertainty regarding the reliability of the FT assays, particularly the “analog” radioimmunoassay (RIA) available in most clinical laboratories.
The accepted “gold standard” measurement of FT is via equilibrium dialysis (EqD). In EqD, a selectively permeable membrane is used to separate FT from protein-bound testosterone over time, and mass spectroscopy is used to quantify the amount of FT in the dialysate. This costly process is manual, time consuming, and performed at only a few reference laboratories in North America [Citation3]. A slightly more automated method uses ultrafiltration to extract FT and is also limited to reference laboratories [Citation4].
In most cases, clinicians have two options, to either measure FT using the commonly available RIA method or to calculate FT based on measured total T (TT) and SHBG. The analog RIA assay (also called a “direct assay”) has been widely used for measuring FT at least two decades [Citation5]. In this test, a radiolabeled testosterone analogis added to an un-extracted test sample and competes with FT for binding to an immobilized antibody. Alternatively, FT may be calculated using one of a few published methods, of which the Vermeulen [Citation3] and Sodergard [Citation6] algorithms are the most frequently cited in the endocrinology and andrology literature. These two algorithms rely on the same mass action equilibrium formulas but use different association constants (Ka) for the binding of testosterone to SHBG and albumin.
In recent years, the RIA method has been criticized by some experts as inaccurate due to substantial numerical discrepancies between RIA and EqD results, and too heavily influenced by either TT [Citation7] or by SHBG [Citation8]. The numerical differences lead to confusion in interpreting clinical results and can complicate efforts to establish biochemical standards for the diagnosis of TD. Based on these issues, some experts advocate that the RIA method should not be used in clinical care and that conclusions of previous research studies utilizing the RIA method may not be valid [Citation9]. Nonetheless, RIA remains in widespread use and some authors have argued it provides clinically meaningful information in men when interpreted using an assay-specific reference range [Citation10]. Currently, there is a paucity of data directly comparing the two methods against the gold standard in a clinical population of men. Our goal in this study is to examine the relationships between RIA, cFT, EqD, and TT in a population of men presenting to an outpatient andrology clinic.
Methods
We studied a consecutive series of blood samples sent for measurement of FT during November and December 2011 from Men’s Heath Boston (Brookline, MA), an outpatient adult urology clinic specializing in andrology and infertility. Blood samples from 56 men were sent to the Quest Diagnostics Nichols Institute (San Juan Capistrano, CA and Valencia, CA), a commercial reference laboratory that performs specialty blood tests such as cFT and RIA from sites across the USA. Each sample was split and run in tandem for RIA and EqD. Testing for RIA was performed at the Valencia site and EqD was performed at the San Juan Capistrano site. TT was determined by liquid-chromatography/mass spectroscopy (LCMS). SHBG was determined by immunoassay through a Quest Diagnostics laboratory in Chantilly, VA.
Medical records were reviewed to determine patient demographics, including whether patients were on testosterone therapy and symptoms of TD. Review of clinical data was conducted with approval of the human subjects institutional review board at Beth Israel Deaconess Medical Center.
FT was calculated using the Vermeulen algorithm using an online calculator (http://www.issam.ch/freetesto.htm) and a standard value of 4.3 g/dL for albumin [Citation3]. The relationships between RIA, cFT, EqD and TT were examined by determining Pearson’s correlation coefficients and by using the Bland–Altman method [Citation11]. Because RIA and EqD are separately calibrated and have different reference ranges, for the Bland–Altman analysis RIA values were transformed on to the EqD scale, so that the both RIA and EqD values had the same z-score. Statistical analysis and graphing were performed using Prism v6 (GraphPad Software Inc., La Jolla, CA). A p-value less than 0.05 was considered significant.
Results
Demographic characteristics of the study population are listed in . Of the 56 men, 27 (48.2%) men were receiving testosterone therapy at the time of the blood draw. Forty-seven men in this population (83.9%) presented with complaints of erectile dysfunction, diminished libido, or ejaculatory disorders.
Table 1. Characteristics of study population of 56 outpatients presenting to an outpatient andrology/infertility clinic.
For the entire study population, the correlation with EqD was robust and approached unity for both RIA (Pearson’s correlation coefficient r = 0.966; p < 0.001) and for cFT (r = 0.986; p < 0.001) (see ). Pearson correlations for all patients and for subgroups are displayed in . The correlation of total T with FT was similar when FT was determined by RIA (r = 0.806; p < 0.001), cFT (r = 0.843; p < 0.001) and EqD (r = 0.809; p < 0.001). No significant correlation was noted for SHBG with RIA (r = −0.177; p = 0.192) or EqD (r = −0.206; p = 0.126). Similarly, SHBG was not correlated with cFT (r = −0.158; p = 0.244), although SHBG was correlated with TT (r = 0.396; p = 0.0071). A strong correlation was also found for RIA and cFT (r = 0.969; p ≤ 0.001).
Figure 1. Correlations between calculated FT (left; r = 0.986) and FT by RIA (right; r = 0.966) against EqD.
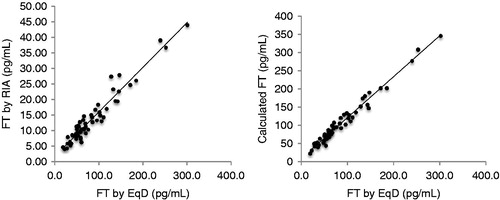
Table 2. Pearson correlation coefficient for RIA and cFT against gold standard EqD.
The strength of correlation with EqD was similar for RIA and cFT among all subgroups studied. Among men in the lowest quartile for FT (below 50.3 pg/mL), correlations for both tests were weaker than for the study population as a whole, but still very strong. Strong correlations for each test were observed for men receiving T therapy and for men not on T therapy. As noted in , numerical values for RIA were approximately one-seventh EqD values.
Bland–Altman plots are displayed in . The mean bias for RIA against EqD was 0.0 ± 15.00 pg/mL and for cFT against EqD it was −19.4 ± 13.0 pg/mL. Examination of the Bland–Altman plot for cFT, shows that cFT overestimated EqD for 55 of 56 patients, although the 95% confidence interval includes 0. There is a trend towards greater overestimation of FT for higher FT values.
Figure 2. Bland–Altman plots comparing cFT (right) and RIA (left) against EqD. Mean bias is 0 [95% CI −29.4 to 29.4] for RIA and −19.4 [95% CI −45 to 6.1] for cFT.
![Figure 2. Bland–Altman plots comparing cFT (right) and RIA (left) against EqD. Mean bias is 0 [95% CI −29.4 to 29.4] for RIA and −19.4 [95% CI −45 to 6.1] for cFT.](/cms/asset/31a8fe1d-cabf-45d5-9f0d-d3612e4c5521/itam_a_835800_f0002_b.jpg)
The number of men categorized as having low FT values differed by test. Low values were noted for 12 (21.4%) men by RIA, for which the stated lower limit of normal by Quest Diagnostic Laboratories is 8 pg/mL. In contrast, only 2 (3.6%) men were categorized as low by cFT and 6 (10.7%) by EqD, for which the stated low reference value for each is 35 pg/mL for men aged 18–69. Ten of 12 (83%) men categorized as having low FT levels by RIA were categorized as normal by cFT.
Discussion
In this study, 56 consecutive men from our andrology clinic had FT determined on the same blood samples by both RIA and EqD at a national reference laboratory. Calculated FT was subsequently determined by the Vermeulen algorithm. The primary findings were a robust correlation between RIA and the gold standard EqD (r = 0.966) and a similarly robust correlation between cFT and EqD (r = 0.986). These correlations approached unity. Both measures correlated well with EqD across the range of observed values for total testosterone and for the subgroups of men who were or were not receiving T therapy. Statistical textbooks characterize correlations of 0.5 or greater as “good” and correlations of 0.75 or greater as “very good” [Citation12]. Comparison of Pearson correlations for subgroups did not show substantial difference between cFT and RIA (see ).
These results provide valuable new information regarding the utility of RIA and cFT in medical practice, as few previous studies have compared these measures of FT against the gold standard EqD in clinical populations of men. Our results are similar to those observed in the landmark 1999 study by Vermeulen et al., which reported a high degree of correlation between EqD and both RIA (r = 0.937) and cFT (r = 0.987). Of note, that study included only 28 ambulatory men and a larger number of pregnant and postmenopausal women and patients with thyroid disorders [Citation3]. The current study population was twice as large and included patients with a broad range of total T values, including men with TD who were receiving T therapy. In a study of 147 normal women and women with androgen deficiency, the correlation with EqD was weaker for RIA (r = 0.81) than for cFT (r = 0.99) [Citation13]. In the present study, similar correlations were found for both RIA (r = 0.809) and cFT (r = 0.817) for the subset of 14 men with the lowest FT values.
Given that the correlation for both RIA and cFT with EqD each approached unity, it is not surprising that each of these tests also correlated strongly with each other. The Pearson correlation of r = 0.969 noted in the present study supports the strong correlations of RIA and cFT noted in prior publications, one from our center (r = 0.803) [Citation14] and another from a large study in over 400 community-dwelling Japanese men (r = 0.88) [Citation15]. The stronger correlation noted in the present study may be due in part to the improved measurement of total testosterone via LCMS.
Additional analysis of the agreement between cFT and RIA versus EqD was performed using the Bland–Altman method [Citation11]. Pearson correlations alone may not represent a complete picture of agreement between an experimental measure against a reference measure and a strong correlation between two tests may not necessarily indicate good agreement between the two tests. In order to address this issue, the difference between the two tests (or “bias”) is plotted against the mean of the two tests. These plots, displayed in , provide an estimation of the degree of bias, and identify patterns in bias that may be clinically relevant.
The Bland–Altman plot for cFT revealed that FT was overestimated in all but one sample. The mean overestimation of FT was about 20 pg/mL with a trend towards greater overestimation for higher FT values. The mean bias for RIA values normalized onto the EqD scale was centered nearly at 0, meaning that RIA overestimated FT about as much, and as often as it underestimated FT. Clinically speaking, 95% of patients will have a true FT within approximately 30 pg/mL of their RIA value and 26 pg/mL of their cFT value. Overall these data suggest that cFT may have marginally better precision compared to RIA, but cFT may overestimate the “true” value, particularly for patients with higher FT. Interestingly, other studies have also found that cFT overestimates FT [Citation16,Citation17], including one study of nearly 400 men. In that study, FT calculated using the Vermeulen method [Citation3] was approximately 20 pg/mL greater than FT produced by a regression model based on over 4000 samples with FT measured by ultrafiltration [Citation18].
Several recent papers have argued in favor of abandoning the RIA FT assay in the evaluation of TD in men [Citation9]. Fritz et al. reported that the RIA FT assay failed to detect differences between TT and FT in a series of experimental manipulations in which SHBG was added to serum sample where the concentration of TT was held constant [Citation7]. The strong correlation between FT and TT appears to be biologically determined, as all three FT measures in the present study, including EqD, demonstrated strong correlations. It is difficult to know how experimental manipulations of serum samples relate to clinical test results.
Others have argued that RIA results are too greatly influenced by alterations in SHBG. This was reported in one study involving 29 men [Citation8] and another study involving 76 women [Citation19]. This would indeed be an argument against the use of a FT assay, as FT values should in theory be independent of SHBG concentrations. In the current study, however, no relationship was observed between FT and SHBG by RIA, nor for cFT or EqD. However, it is unknown whether this would hold true for extremes of SHBG values. This finding is consistent with other studies reporting weak or absent correlations between RIA and SHBG, including the study of 400 Japanese men [Citation15], previous data from our institution [Citation14], and the classic Vermulen paper [Citation3]. These divergent findings may perhaps be the result of differences in laboratory technique, or differences between commercial RIA products. In this study, RIA results were obtained via the widely used Coat-a-Count assay, manufactured by Siemens (formerly Diagnostic Products, Inc.). These results may not apply to other commercial assays.
A related challenge for the clinical use of RIA comes from the fact that numerical values for RIA are approximately one-sixth the corresponding values for EqD. This numerical difference has formed the most common argument against the use of RIA, interpreted as a demonstration that RIA only measures a fraction of FT [Citation3]. However, it is clear from the current study and from the landmark article by Vermeulen et al. [Citation3] that RIA results are internally consistent and strongly correlated with EqD results across a broad spectrum of values in men. This type of result indicates a calibration discrepancy between the two assays. We find no evidence from this study and others to support the assertion that the RIA suffers from being generally inaccurate. For all biochemical assays, calibration curves are established to convert the raw signal into a concentration. Due to the proprietary nature of the RIA tested in this study, it is unknown what standards were used to originally calibrate the assay. Historically, this assay was in clinical use long before it was compared with other measures of FT such as EqD, and one may speculate that if the RIA were introduced today, it would be calibrated to produce numerical values more consistent with EqD results. Nonetheless, it should be recognized that with appropriate reference intervals, both tests provide the same clinical information. Assay-specific reference values are already provided by laboratories, however, it is important for clinicians to be aware of these differences when reviewing blood test results from unfamiliar laboratories.
Reference intervals that are specific to RIA have already been in place for many years. However, we are unaware of prior attempts to reconcile lower reference values by various FT assays. In this study, 83% of men categorized with low FT values by RIA were categorized as normal by the same laboratory when FT was determined by cFT. A similar discordance was noted for men categorized as low by cFT and EqD, despite strong correlations and an identical reference interval for these tests. Even for the gold standard EqD, different reference ranges have been established at different centers. This poses clinical challenges, as this means some men will be identified as possible candidates for T therapy with one assay, yet categorized as “normal” by another.
Based on the data presented here and previously by others, it is clear that much of the confusion regarding the clinical use of FT assays could be resolved instantly by establishing a single, consensus reference standard. We propose re-calibration of the RIA FT assay by the manufacturer to most simply achieve this goal. In the meantime, clinicians may convert RIA values (expressed in pg/mL) to those consistent with values for EqD or cFT by multiplying by 6.7 (or by 67 if expressed in ng/dl). Clinically useful FT cut-offs in use at our center and elsewhere are 1.5 ng/dL for RIA and the corresponding value of 100 pg/mL for EqD and cFT [Citation20,Citation21].
Conclusion
FT as measured by both RIA and cFT correlate robustly with the gold standard EqD in a clinical population of andrology patients across a broad range of values seen in normal and testosterone-deficient men. Numerical differences between RIA and cFT results require the use of assay-specific reference ranges.
Declaration of interest
The authors report no conflicts of interests. The authors alone are responsible for the content and writing of this article.
References
- Morales A, Lunenfeld B. Investigation, treatment and monitoring of late-onset hypogonadism in males. Official recommendations of ISSAM. International Society for the Study of the Aging Male. Aging Male 2002;5:74–86
- Bhasin S, Cunningham GR, Hayes FJ, et al. Testosterone therapy in men with androgen deficiency syndromes: an Endocrine Society clinical practice guideline. J Clin Endocrinol Metab 2010;95:2536–59
- Vermeulen A, Verdonck L, Kaufman JM. A critical evaluation of simple methods for the estimation of free testosterone in serum. J Clin Endocrinol Metab 1999;84:3666–72
- Van Uytfanghe K, Stockl D, Kaufman JM, et al. Validation of 5 routine assays for serum free testosterone with a candidate reference measurement procedure based on ultrafiltration and isotope dilution-gas chromatography-mass spectrometry. Clin Biochem 2005;38:253–61
- Lepage R. Measurement of testosterone and its sub-fractions in Canada. Clin Biochem 2006;39:97–108
- Sodergard R, Backstrom T, Shanbhag V, Carstensen H. Calculation of free and bound fractions of testosterone and estradiol-17 beta to human plasma proteins at body temperature. J Steroid Biochem 1982;16:801–10
- Fritz KS, McKean AJ, Nelson NC, Wilcox RB. Analog-based free testosterone test results linked to total testosterone concentrations, not free testosterone concentrations. Clin Chem 2008;54:512–16
- Winters SJ, Kelley DE, Goodpaster B. The analog free testosterone assay: are the results in men clinically useful? Clin Chem 1998;44:2178–82
- Morales A, Collier CP, Clark AF. A critical appraisal of accuracy and cost of laboratory methodologies for the diagnosis of hypogonadism: the role of free testosterone assays. Can J Urol 2012;19:6314–18
- Morgentaler A. Commentary: guideline for male testosterone therapy: a clinician's perspective. J Clin Endocrinol Metab 2007;92:416–17
- Bland JM, Altman DG. Statistical methods for assessing agreement between two methods of clinical measurement. Lancet 1986;1:307–10
- Dawson BTR, ed. Basic and clinical biostatistics, vol. 48. Columbus (OH): McGraw Hill Professonal; 2004
- Miller KK, Rosner W, Lee H, et al. Measurement of free testosterone in normal women and women with androgen deficiency: comparison of methods. J Clin Endocrinol Metab 2004;89:525–33
- Moreno SA, Shyam A, Morgentaler A. Comparison of free testosterone results by analog radioimmunoassay and calculated free testosterone in an ambulatory clinical population. J Sex Med 2010;7:1948–53
- Okamura K, Ando F, Shimokata H. Serum total and free testosterone level of Japanese men: a population-based study. Int J Urol 2005;12:810–14
- de Ronde W, Van der Schouw YT, Pols HA, et al. Calculation of bioavailable and free testosterone in men: a comparison of 5 published algorithms. Clin Chem 2006;52:1777–84
- Giton F, Urien S, Born C, et al. Determination of bioavailable testosterone [non sex hormone binding globulin (SHBG)-bound testosterone] in a population of healthy French men: influence of androstenediol on testosterone binding to SHBG. Clin Chem 2007;53:2160–8
- Ly LP, Handelsman DJ. Empirical estimation of free testosterone from testosterone and sex hormone-binding globulin immunoassays. Eur J Endocrinol 2005;152:471–8
- Guay AT. Screening for androgen deficiency in women: methodological and interpretive issues. Fertil Steril 2002;77:S83–8
- Di Sante S, Conners WP, Morgentaler A. Influence of baseline serum testosterone on changes in body composition in response to testosterone therapy. J Sex Med 2012;9:585–93
- Reyes-Vallejo L, Lazarou S, Morgentaler A. Subjective sexual response to testosterone replacement therapy based on initial serum levels of total testosterone. J Sex Med 2007;4:1757–62