
Abstract
Background: The white blood cell (WBC) count was one of the first inflammatory markers associated with metabolic syndrome (MetS). Recently, two longitudinal studies have demonstrated a cause and effect relationship between MetS and WBC counts among middle-aged adults. However, no study has used WBC cutoff values to predict MetS in the elderly.
Methods: Subjects who underwent routine health checkups, and were above 60 years of age, were enrolled. All subjects were followed-up until they developed MetS or until 4 years from the date of entry, whichever came earlier. Of the 4539 subjects eligible for enrollment, 3428 subjects comprised the study group and 1111 subjects comprised the validation group.
Results: WBC counts were significantly different between subjects with and without MetS in both genders. Using the ROC curve, WBC cutoff values of 5.7 × 10³/µl in males and 5.0 × 10³/µl in females were associated with the increased risk of developing MetS (all p values <0.001). Using these WBC cutoff values, the hazard ratio (HR) for females was significant in both the study group and validation group. However, the HR for males failed significance in the validation group. Kaplan–Meier plots and κ coefficients confirmed that the WBC cutoff value could predict development of MetS in women but not in men.
Conclusions: The association between WBC count and MetS was gender specific. A WBC cutoff value greater than 5.0 103/µl may predict the development of MetS in elderly women.
Introduction
As health care improves on a global scale, the aging population becomes a significant burden to society. Chronic diseases that plague the elderly, such as type 2 diabetes and cardiovascular disease (CVD), are particularly prevalent. In 1988, “Syndrome X”, was a term used to characterize such diseases [Citation1]. Subsequently, the World Health Organization (among others) proposed the name, metabolic syndrome (MetS), to more accurately describe a syndrome characterized by a clustering of central obesity, hypertension, dyslipidemia, and glucose intolerance [Citation2,Citation3]. The central feature of MetS is insulin resistance. In addition, chronic low grade inflammation is considered a pivotal aspect of the pathophysiology underlying MetS that ties all of its components together [Citation4].
The white blood cell count (WBC) count was one of the first inflammatory markers associated with MetS. Several studies had demonstrated a correlation between WBC count, type 2 diabetes, and CVD [Citation5–9]. Moreover, the correlation between WBC count and MetS has been further demonstrated using different ages, genders and races [Citation10–16].
Recently, two longitudinal studies demonstrated a cause and effect relationship between WBC count and MetS among middle-aged adults [Citation17,Citation18]. These two cohorts showed that a higher WBC was associated with a higher risk of developing MetS with a hazard ratio (HR) between 1.26 and 1.66. They used WBC levels to monitor the development of MetS in the follow-up period. However, they used a quartile rather than a definite WBC cutoff value in their assessment. In addition, the study population was middle-aged adults, therefore, information regarding MetS among the elderly is lacking. In a longitudinal study lasting 4 years, we attempted to overcome these limitations by developing a WBC cutoff value that is easy to implement when attempting to predict the development of MetS in the elderly.
Methods
Study population
All data from study participants were treated anonymously, and written informed consent was obtained from all participants prior to their participation in the study. Data were provided by MJ Health Screening Center for research purposes only, and the study protocol was approved by the Institutional Review Board of the MJ Health Screening Center. MJ Health Screening Center is a privately owned chain of clinics located throughout Taiwan that provide regular health examinations to their members.
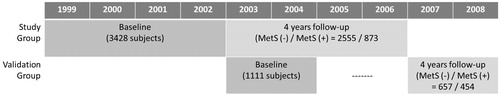
We enrolled male and female subjects above 60 years of age who underwent routine health checkups at the MJ Health Screening Center in Taiwan. At baseline, all subjects had no history of MetS, diabetes, hypertension, hyperlipidemia, or CVD. In addition, subjects taking medications known to affect MetS components were excluded. All subjects were followed-up until they developed MetS or until 4 years from the date of entry in the study, whichever came earlier. A total of 4539 subjects were eligible for analysis. Of the 4539 subjects eligible for enrollment, 3428 made up the study group and 1111 subjects made up the validation group. The study and validation groups were defined by the year in which their first visit to MJ Health Screening Center occurred. Subjects with their first visit between 1999 and 2002 were selected as the study group and those between 2003 and 2004 were selected as the validation group ().
Figure 1. Study design.
Anthropometric measurements and general data
Members of the senior nursing staff used a questionnaire to obtain each subject’s medical history, including any current medications. Complete physical examinations were also performed. Body mass index was calculated as the subject’s body weight (kg) divided by the square of the subject’s height (m). Both systolic blood pressure (SBP) and diastolic blood pressure (DBP) were measured by the nursing staff using standard mercury sphygmomanometers fitted on the right arm of each subject while seated.
Laboratory measurements
After the subject had fasted for 10 h, blood samples were drawn from the antecubital vein for biochemical analysis. Plasma was separated from blood within 1 h, stored at −70 °C, and analyzed for fasting plasma glucose (FPG) and lipid profiles. The FPG was detected using the glucose oxidase method (YSI 203 glucose analyzer, Scientific Division, Yellow Springs Instruments, Yellow Springs, OH). Total cholesterol and triglycerides (TG) were measured using the dry, multilayer, analytical slide method in the Fuji Dri-Chem 3000 analyzer (Fuji Photo Film, Minato-Ku, Tokyo, Japan). Serum high-density lipoprotein cholesterol (HDL) and low-density lipoprotein cholesterol (LDL) concentrations were analyzed using an enzymatic cholesterol assay following dextran sulfate precipitation. WBC count was measured with an Abbott Cell Dyn 3000 hematology analyzer (Abbott Laboratories, Abbott Park, IL).
Definition of metabolic syndrome
We used the latest harmonized criteria for defining MetS [Citation19], with some modification. The waist circumference (WC) used was ≥90 cm for Taiwanese men and ≥80 cm for Taiwanese women [Citation20]. The other four criteria were the same, i.e., SBP ≥ 130 mmHg or DBP ≥ 85 mmHg, TG ≥ 150 mg/dl, FPG ≥ 100 mg/dl, HDL-C ≤ 40 mg/dl in men and ≤50 mg/dl in women. Subjects were required to have more than three criteria to be diagnosed as MetS.
Model validation
A model was established to predict subsequent development of MetS. To test its discriminatory capability, this model was externally validated in validation group who were enrolled using the same criteria. As mentioned previously, the validation groups were defined by the year in which their first visit to MJ Health Screening Center occurred. Subjects with their first visit between 2003 and 2004 were selected as the validation group. The validation group is used for the further confirming the correction of the cut point of WBC in predicting future MetS. Due to the totally different subjects enrolled between the study group and the validation group, this model can be regarded as an external validation.
Statistical analysis
All statistical analyses were performed using SPSS 18.0 software (SPSS Inc., Chicago, IL). Data were presented as mean ± standard deviation. All data were tested for normal distribution with the Kolmogorov–Smirnov test and for homogeneity of variances with Levene’s test. The t test was used to evaluate differences between the two groups. Correlations between MetS-associated factors and WBC count was evaluated using the Pearson correlation. Multivariate regression analysis was further applied to build the equation. Moreover, receiver operating characteristic (ROC) curves of the WBC count were used to predict MetS. The area under curve and 95% confidence interval were also estimated and compared. Cox regression was used to calculate the risk for developing MetS. Moreover, κ coefficients were used to demonstrate consistency between predicted and observed MetS in the validation group. The Kaplan–Meier plot with the log rank test was also applied for event-free probability. All statistical tests were two-sided. A p value <0.05 was considered statistically significant.
Results
A total of 3428 subjects were enrolled in the study group and 1111 subjects were enrolled in the validation group. Their demographics, at both baseline and follow-up, are shown in . The WBC count was significantly different between subjects, with and without MetS, based on gender in both study and validation groups. Using univariate and multivariate analyses (), only HDL and TG remained significantly associated with WBC count for both sexes. From the ROC curve (), WBC cutoff values of 5.7 × 10³/µl in males and 5.0 × 10³/µl in female were significant (all p values <0.001). Although the area under curve was not large, we feel this occurred because we excluded all subjects on medications for any of the MetS components. By doing this, the higher extremes of the MetS spectrum were not considered or evaluated. This would have the effect of reducing the power of our results. In , using this cutoff value for WBC count, the HR attained significance in the study group but failed significance in males (p = 0.091) compared with females (p < 0.001). Similar results were seen in the Kaplan–Meier plot (p = 0.119 for males and p = 0.001 for females) and κ coefficients (p = 0.089 for males and p < 0.001 for females) (; ).
Figure 2. Receiver-operating characteristic (ROC) analysis showing WBC level cutoff point (black square) used to predict metabolic syndrome in the study group. (a) Males. (b) Females.
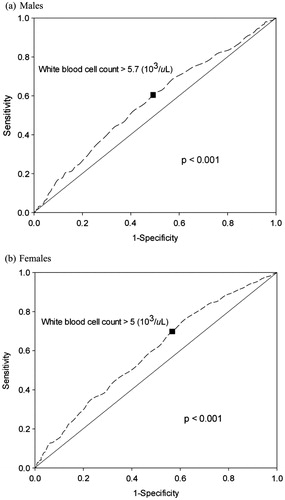
Figure 3. Kaplan–Meier estimates of metabolic syndrome during follow-up according to the white blood cell levels predicting at baseline in validation group.
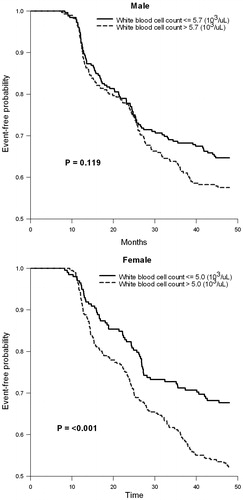
Table 1. Demographic data of the study group and validation group at baseline and follow-up.
Table 2. Univariate and multivariate analyses of baseline white blood cell levels and metabolic-related components at follow-up in the study group.
Table 3. Cox regression between baseline variables, white blood cell levels, and components of MetS and whether subjects had MetS after follow-up.
Table 4. The κ coefficient test between predicted and observed metabolic syndrome in the validation group.
Discussion
Our study demonstrated, for the first time, that a WBC count greater than 5.0 × 10³/µl in elderly females can predict the development of MetS four years later. Several cross-sectional studies had previously demonstrated a positive correlation between WBC counts and the subsequent development of MetS but had not defined a particular WBC cutoff point that could be used to predict the future development of MetS. Although we found, in the study group, that a WBC count higher than 5.7 × 10³/µl in men had significantly higher HR for developing MetS, this finding failed significance in the men’s validation group. Kaplan–Meier estimates with log rank test and κ coefficients further confirmed these results. In contrast, not only did females in the study group have higher HR for developing MetS, but this result was also confirmed by log rank test and κ coefficient in the women’s validation group.
We were not the first to propose the use of a WBC cutoff point to predict MetS. Oda et al. [Citation8] found that a WBC cutoff point of 5.65 × 10³/µl in men and 5.00 × 10³/µl in women could predict MetS using a cross-sectional study of 2959 health checkup subjects. The cutoff points proposed by Oda et al., although similar to ours in value, were for middle-aged subjects and not the elderly. We further demonstrated that a WBC cutoff point was only useful in elderly women, although the reason for this gender difference is unclear.
Furthermore, using multivariate regression analysis, WBC count was significantly related to WC, HDL, LDL and TG in men compared to SBP, FPG, HDL, and TG in women. One reason for this gender difference may be the higher frequency of cigarette smoking in men compared to women as it is known that cigarette smoking increases WBC counts [Citation21]. From logistic regression analysis, WC had the highest HR, as expected. WBC count had a better HR than either FPG or SBP in females, which further proves the usefulness of WBC in predicting future development of MetS in elderly females.
Chronic low-grade inflammation is characterized by the activation of an inflammatory signaling network with increased production of cytokines, such as interleukin-6, tumor necrosis factor-alpha, and the highly sensitive C-reactive protein. WBC count is considered a pivotal aspect of the pathophysiological network of MetS components [Citation21]. Fadini et al. reported that WBC counts, within normal limits, could predict the occurrence of MetS [Citation22]. Odagiri et al. also reported that WBC counts could be useful in predicting the future development of MetS [Citation18]. Previous studies have been inconsistent, however, regarding whether WBC or other inflammatory markers can contribute to diabetes prediction models independent of obesity, or whether these markers simply reflect adipose tissue mass [Citation23,Citation24].
Kim et al. [Citation25] found that WBC count was related to abdominal fat distribution in female obese adolescents. However, Twig et al. [Citation26] found that elevated WBC counts were not associated with increased diabetes risk in lean, normoglycemic men. WBC levels were able to distinguish between subgroups of overweight and obese young men who were at a relatively low risk (or without an excess risk) for diabetes versus those who would progress to overt diabetes at significantly higher rates. These results were in contrast to our findings which showed a positive correlation between WBC counts and WC in elderly men but not in women. A potential explanation lies in the cumulative estimation of the whole-body inflammatory burden, which reflects chronic as well as acute inflammatory processes. Adipose tissue inflammation has primarily been attributed to inflammatory processes observed in visceral and/or ectopic fat depositions, compartments whose relative mass is significantly increased in obesity [Citation27].
Biological evidence suggests that inflammation might induce type 2 diabetes, and epidemiological studies have shown an association between WBC levels and development of type 2 diabetes. Gkrania-Klotsas et al. reported that the combined relative risk (comparing the top to bottom tertiles of the WBC counts) was 1.61 (95% CI: 1.45–1.79, p < 0.001) [Citation9]. In addition, Kang et al. [Citation28] found that WBC count significantly correlated with HOMA-IR in Korean adult women. Possible mechanisms underlying this phenomena may include interruptions in insulin signaling in the liver by inflammatory molecules such as IL-6 [Citation29] or a pro-inflammatory effect on insulin [Citation30], or insulin resistance [Citation31,Citation32]. In the meta-analysis performed by Gkrania-Klotsas et al. [Citation9], they found that an elevated WBC count was associated with a higher risk for developing type 2 diabetes. However, publication bias and failure to control for all potential confounders in all studies suggests that the observed association was likely an overestimate using the meta-analysis study.
Our univariate analysis showed that FPG significantly correlated with WBC levels in both genders. Using multivariate analysis, this result remained significant only in women. Nevertheless, different age groups and different races might yield different results. In the first National Health and Nutrition Examination Survey (NHANES I) Epidemiologic Follow-up Study (NHFS), Gillum et al. [Citation33] showed that an increased WBC count was associated with an increased incidence of developing hypertension in white males, and possibly older white and black females. However, no positive association between increased WBC counts and increased incidence of hypertension was seen in black men. In the study by Ryan et al. [Citation34], elevated blood pressure levels were associated with impaired acetylcholine-induced endothelium-dependent relaxation, which was prevented by the administration of antioxidant superoxide dismutase. This led to the hypothesis that high blood pressure may impair endothelium-dependent relaxation by generating reactive oxygen species [Citation34], which in turn could stimulate an inflammatory signaling pathway [Citation35]. Subsequently, Abramson et al. [Citation36] showed that increased blood pressure was also associated with increased inflammation. Orakzai et al. further demonstrated that higher SBP within the normotensive range was also associated with elevated WBC counts [Citation37]. Moreover, high normal SBP was also associated with increased CVD risk [Citation37]. Our multivariate analysis, however, showed that elevated SBPs in females, alone, remained significantly associated with WBC counts. This result may be due to an age difference in our study. It is well known that arterial stiffness increases with increasing age. Therefore, this may influence the relationship between WBC and SBP in elderly men.
Many studies have demonstrated a relationship between triglycerides and cholesterol levels [Citation13,Citation16,Citation38,Citation39], and we also found a similar relationship. In the Guangzhou biobank cohort study performed by Lao et al. [Citation13], vascular risk factors, including TG, total cholesterol, and LDL were all positively associated with WBC counts in both genders. This relationship was confirmed not only in adults, but also among young adolescents [Citation16]. In type 2 diabetes subjects, WBC was associated with macro- and micro-vascular complications in Chinese patients. Among the risk factors, LDL, TG and lower HDL were all related [Citation38]. Shankar et al. [Citation39] further showed that the combination of elevated WBC counts and TG levels were associated with cardiovascular mortality, in addition to all-cause mortality, among older Australians (RR = 3.15).
This study was the first to explore the value of using WBC counts to predict the development of MetS in the elderly. In addition, we examined the role of gender on the risk for developing MetS. However, our study had several limitations. Our study population was drawn from only one health screening center, whose members may have been from higher socioeconomic backgrounds, and, thus, may not represent the general population. In addition, the central feature of MetS is insulin resistance, which was not measured in our study. Finally, we did not have all available data concerning cardiovascular events or all cause mortality, which may have influenced the interpretation of our results.
In conclusion, the association between WBC count and MetS was gender specific. A WBC cutoff value greater than 5.0 103/µl may predict the development of MetS in elderly women.
Declaration of interest
All authors declare no conflict of interest.
Acknowledgements
The authors would like to thank MJ Health Screening Centers for preparing the data. The above authors take responsibility for all aspects of the reliability and freedom from bias of the data presented and their discussed interpretation.
References
- Reaven GM. Banting lecture 1988. Role of insulin resistance in human disease. Diabetes 1988;37:1595–607
- Alberti KG, Zimmet PZ. Definition, diagnosis and classification of diabetes mellitus and its complications. Part 1: diagnosis and classification of diabetes mellitus provisional report of a WHO consultation. Diabet Med 1998;15:539–53
- Stone NJ, Bilek S, Rosenbaum S. Recent national cholesterol education program adult treatment panel iii update: adjustments and options. Am J Cardiol 2005;96:53E–9E
- Duncan BB, Schmidt MI, Pankow JS, et al. Low-grade systemic inflammation and the development of type 2 diabetes: the atherosclerosis risk in communities study. Diabetes 2003;52:1799–805
- Nakanishi N, Yoshida H, Matsuo Y, et al. White blood-cell count and the risk of impaired fasting glucose or Type II diabetes in middle-aged Japanese men. Diabetologia 2002;45:42–8
- Vozarova B, Weyer C, Lindsay RS, et al. High white blood cell count is associated with a worsening of insulin sensitivity and predicts the development of type 2 diabetes. Diabetes 2002;51:455–61
- Ruggiero C, Metter EJ, Cherubini A, et al. White blood cell count and mortality in the Baltimore Longitudinal Study of Aging. J Am Coll Cardiol 2007;49:1841–50
- Oda E, Kawai R. The prevalence of metabolic syndrome and diabetes increases through the quartiles of white blood cell count in Japanese men and women. Intern Med 2009;48:1127–34
- Gkrania-Klotsas E, Ye Z, Cooper AJ, et al. Differential white blood cell count and type 2 diabetes: systematic review and meta-analysis of cross-sectional and prospective studies. PloS One 2010;5:e13405
- Ble A, Palmieri E, Volpato S, et al. White blood cell count is associated with some features of metabolic syndrome in a very old population. Nutr Metab Cardiovasc Dis 2001;11:221–6
- Chuo SK, Li JC, Tsai WC, et al. Correlations between white blood cell count and metabolic syndrome in middle-age Taiwanese. Endocr Res 2005;31:39–50
- Hsieh CH, Pei D, Kuo SW, et al. Correlation between white blood cell count and metabolic syndrome in adolescence. Pediatr Int 2007;49:827–32
- Lao XQ, Neil Thomas G, Jiang C, et al. White blood cell count and the metabolic syndrome in older Chinese: the Guangzhou Biobank Cohort Study. Atherosclerosis 2008;201:418–24
- Wu CZ, Lin JD, Li JC, et al. Association between white blood cell count and components of metabolic syndrome. Pediatr Int 2009;51:14–18
- Chen W, Srinivasan SR, Xu J, Berenson GS. Black-white divergence in the relation of white blood cell count to metabolic syndrome in preadolescents, adolescents, and young adults: the Bogalusa Heart Study. Diabetes Care 2010;33:2474–6
- Wu CZ, Hsiao FC, Lin JD, et al. Relationship between white blood cell count and components of metabolic syndrome among young adolescents. Acta Diabetol 2010;47:65–71
- Twig G, Afek A, Shamiss A, et al. White blood cell count and the risk for coronary artery disease in young adults. PloS One 2012;7:e47183
- Odagiri K, Uehara A, Mizuta I, et al. Longitudinal study on white blood cell count and the incidence of metabolic syndrome. Intern Med 2011;50:2491–8
- Alberti KG, Eckel RH, Grundy SM, et al. Harmonizing the metabolic syndrome: a joint interim statement of the International Diabetes Federation Task Force on Epidemiology and Prevention; National Heart, Lung, and Blood Institute; American Heart Association; World Heart Federation; International Atherosclerosis Society; and International Association for the Study of Obesity. Circulation 2009;120:1640–5
- Department of Health, Executive Yuan, R.O.C. (Taiwan). Available from: http://www.doh.gov.tw/CHT2006/DM/DM2_p01.aspx?class_no=25&now_fod_list_no=5912&level_no=2&doc_no=22602 [last accessed 10 Feb 2013]
- Ishizaka N, Ishizaka Y, Toda E, et al. Association between cigarette smoking, white blood cell count, and metabolic syndrome as defined by the Japanese criteria. Intern Med 2007;46:1167–70
- Fadini GP, Marcuzzo G, Marescotti MC, et al. Elevated white blood cell count is associated with prevalence and development of the metabolic syndrome and its components in the general population. Acta Diabetol 2012;49:445–51
- Freeman DJ, Norrie J, Caslake MJ, et al. C-reactive protein is an independent predictor of risk for the development of diabetes in the West of Scotland Coronary Prevention Study. Diabetes 2002;51:1596–600
- Pradhan AD, Manson JE, Rifai N, et al. C-reactive protein, interleukin 6, and risk of developing type 2 diabetes mellitus. J Am Med Assoc 2001;286:327–34
- Kim JA, Park HS. White blood cell count and abdominal fat distribution in female obese adolescents. Metabolism 2008;57:1375–9
- Twig G, Afek A, Shamiss A, et al. White blood cells count and incidence of type 2 diabetes in young men. Diabetes Care 2013;36:276–82
- Gustafson B. Adipose tissue, inflammation and atherosclerosis. J Atheroscler Thromb 2010;17:332–41
- Kang YH, Min HG, Kim IJ, et al. Comparison of alanine aminotransferase, white blood cell count, and uric acid in their association with metabolic syndrome: a study of Korean adults. Endocr J 2008;55:1093–102
- Senn JJ, Klover PJ, Nowak IA, Mooney RA. Interleukin-6 induces cellular insulin resistance in hepatocytes. Diabetes 2002;51:3391–9
- Dandona P, Aljada A, Mohanty P, et al. Insulin inhibits intranuclear nuclear factor kappaB and stimulates IkappaB in mononuclear cells in obese subjects: evidence for an anti-inflammatory effect? J Clin Endocrinol Metab 2001;86:3257–65
- Dandona P, Aljada A, Bandyopadhyay A. Inflammation: the link between insulin resistance, obesity and diabetes. Trends Immunol 2004;25:4–7
- Dandona P, Aljada A, Chaudhuri A, Mohanty P. Endothelial dysfunction, inflammation and diabetes. Rev Endocr Metab Disord 2004;5:189–97
- Tong PC, Lee KF, So WY, et al. White blood cell count is associated with macro- and microvascular complications in chinese patients with type 2 diabetes. Diabetes Care 2004;27:216–22
- Ryan SM, Waack BJ, Weno BL, Heistad DD. Increases in pulse pressure impair acetylcholine-induced vascular relaxation. Am J Physiol 1995;268:H359–63
- Hensley K, Robinson KA, Gabbita SP, et al. Reactive oxygen species, cell signaling, and cell injury. Redox Biol 2000;28:1456–62
- Abramson JL, Weintraub WS, Vaccarino V. Association between pulse pressure and C-reactive protein among apparently healthy US adults. Hypertension 2002;39:197–202
- Orakzai RH, Orakzai SH, Nasir K, et al. Association of white blood cell count with systolic blood pressure within the normotensive range. J Hum Hypertens 2006;20:341–7
- Gillum RF, Mussolino ME. White blood cell count and hypertension incidence. The NHANES I Epidemiologic Follow-up Study. J Clin Epidemiol 1994;47:911–19
- Shankar A, Mitchell P, Rochtchina E, Wang JJ. The association between circulating white blood cell count, triglyceride level and cardiovascular and all-cause mortality: population-based cohort study. Atherosclerosis 2007;192:177–83