
Abstract
Objectives: The metabolic syndrome (MetS) is proposed to predict future occurrence of cardiovascular diseases and diabetes. There are some other “non-traditional” risk factors such as hematogram components that are also related to the same endpoints as MetS. In this four-year longitudinal study, we used hematogram components to build models for predicting future occurrence of MetS in older men and women separately.
Methods: Subjects above 65 years without MetS and related diseases were enrolled. All subjects were followed up until they developed MetS or until up to four years from the day of entry, whichever was earlier.
Results: Among the 4539 study participants, 1327 developed MetS. Models were built for men and women separately and the areas under the receiver operation curves were significant. The Kaplan–Meier plot showed that the models could predict future MetS. Finally, Cox regression analysis showed that the hematogram model was correlated to future MetS with hazard ratios of 1.567 and 1.738 in men and women, respectively.
Conclusion: Our hematogram models could significantly predict future MetS in elderly and might be more practical and convenient for daily clinical practice.
Introduction
As early as in 1966, the concept of clustering hypertension, glucose intolerance, adiposity and dyslipidemia was first brought up by Avogaro et al. [Citation1]. In 1993, Reaven et al. first proposed the term “Syndrome X” and, in the same time, insulin resistance was thought to be the core which unifying these five components [Citation2]. Since there was tight relationships between this syndrome, cardiovascular disease (CVD) and diabetes, World Health Organization finally used “metabolic syndrome” (MetS) to coin this combination to raise notice to its deadly endpoints. Till now, more than 40 definitions were proposed in different studies and different societies for both adults and children [Citation3–5]. Among all the definitions, the one proposed by National Cholesterol Education Program, adult treatment panel III, was the most commonly used due to its simplicity [Citation6,Citation7]. The five components of this version are central obesity, hypertriglyceridemia, low high-density lipoprotein cholesterol (HDL-C), hyperglycemia and hypertension. It should be noted since these were adopted from the earliest components, they are also recognized as the “traditional risk factors”.
Contrary to them, many other “non-traditional” risks such as nonalcoholic fatty liver disease, chronic renal disease, atrial fibrillation, obstructive sleep apnea and restrictive lung disease were also found to be related to CVD and diabetes [Citation8–14]. In the same time, low-grade chronic inflammation has been proved to play an important role in linking these risks together with MetS. This is not surprising because other inflammatory markers such as c-reactive protein, interleukin-6, tumor necrosis factor-α and, one of the first marker, white blood cell count (WBC), were all found to be associated with MetS and cardiovascular diseases [Citation15]. Our group had previously found that WBC is associated with MetS in Taiwanese in different age groups [Citation16–18]. Not only this, other hematogram components, i.e. hemoglobin (Hb) and platelets (PLT) are also found to be correlated [Citation19]. It is noteworthy that the effects of PLT on MetS were different in men and women [Citation20,Citation21]. These independent but significant relationships between different hematogram and MetS enable the possibility of building mathematical equations for predicting the occurrence of MetS [Citation22].
In Taiwan, the percentage of aged people is increasing rapidly due to the significant extension of life-expectancy from the national health-insurance policy. The related problems such as long-term care and geriatric medicine thus become major issues for the government and health providers. Therefore, it is important to detect early the subjects who are under high risks for CVD and diabetes. Since hematogram is a routine, simple and cheap test done in daily practice, it is an appropriate tool for building model to predict MetS. In this study, our goal was to build a model with hematogram components and evaluate its accuracy in predicting MetS in older subjects.
Methods
Study population
We enrolled subjects aged above 65 years (included) who underwent routine health checkups at the MJ Health Screening Center in Taiwan. MJ Health Screening Centers are a privately owned chain of clinics located throughout Taiwan that provide regular annual health examinations to their members. All study participants were anonymous, and informed consent was obtained from all participants. Data were provided by MJ Health Screening Center for research purposes only, and the study protocol was approved by the institutional review board of MJ Health Screening Center.
We randomly selected 15 642 records from MJ Health Screening Center’s database between 1999 and 2007. More stringent exclusion criteria were used which could make our results more reliable by reducing the confounding effects of the medications for hypertension, hyperlipidemia and/or diabetes. This design has not been commonly used in other studies. In other words, most of the other similar studies included subjects with medications for aforementioned diseases. We excluded subjects with the following steps:
394 subjects with missing data of components of MetS or hematogram.
5753 subjects with past history of hypertension, hyperlipidemia and/or diabetes, and taking medications of the same diseases at baseline.
2739 subjects with MetS at baseline.
2217 subjects with follow-up periods less than four years.
At the baseline, all the subjects had no MetS, history of diabetes, hypertension, hyperlipidemia, or cardiovascular diseases and subjects taking medications known to affect MetS components were all excluded. All subjects were followed up until they developed MetS or up to four years from the day of entry, whichever was earlier. Finally, a total of 4539 subjects were eligible for analysis.
Anthropometric measurements and general data
Members of the senior nursing staff used a questionnaire to obtain the subject’s medical history, including any current medications. Complete physical examinations were performed by physicians. Waist circumference (WC) was measured horizontally at the level of the natural waist, which was identified as the level at the hollow molding of the trunk when the trunk was laterally concave. Body mass index (BMI) was calculated as the subject’s body weight (kg) divided by the square of the subject’s height (m). Both systolic blood pressure (SBP) and diastolic blood pressure (DBP) were measured by the nursing staff using standard mercury sphygmomanometers fitted on the right arm of each subject when seated. Laboratory measurements were carried out after the subject fasted for 10 hours, blood samples were drawn from the antecubital vein for biochemical analysis. Plasma was separated from blood within 1 hour and stored at −70 °C and analyzed for fasting plasma glucose (FPG) and lipid profiles. The FPG was detected using a glucose oxidase method (YSI 203 glucose analyzer, Scientific Division, Yellow Springs Instruments, Yellow Springs, OH). Total cholesterol and triglycerides (TG) were measured using the dry, multilayer analytical slide method in the Fuji Dri-Chem 3000 analyzer (Fuji Photo Film, Minato-Ku, Tokyo, Japan). Serum HDL-C and low-density lipoprotein cholesterol (LDL-C) concentration were analyzed using an enzymatic cholesterol assay following dextran sulfate precipitation. WBC, Hb and PLT were measured with an Abbott Cell Dyn 3000 hematology analyzer (Abbott Laboratories, Abbott Park, IL).
Definition of MetS
We used the latest harmonized criteria of MetS in 2009 except for the definition of WC due to the differences between Caucasians and Asians [Citation23]. The WC ≥90 and 80 cm was observed in Taiwanese men and women, respectively [Citation24]. Other four criteria were the same: SBP ≥130 mmHg or DBP ≥85 mmHg, TG ≥150 mg/dL, FPG ≥100 mg/dL, HDL-C ≤40 and 50 mg/dL in men and women. Subjects who had more than three criteria were diagnosed as MetS.
Statistical analysis
All statistical analyses were performed using SPSS 17.0 software (SPSS Inc., Chicago, IL). Data are presented as mean ± standard deviation. All data were tested for normal distribution with the Kolmogorov–Smirnov test and for homogeneity of variances with Levene’s test. The t-test was used to evaluate the differences between two groups. Correlations between MetS components and hematogram were evaluated by Pearson correlation. In order to evaluate the independent predicting power on the MetS, multiple logestic regression was applied. Age was also put into the model since it was considered as a confounding factor. The prediction accuracies of different models were compared by the area under curve (AUC) of receiver operating characteristic (ROC) curve using MedCalc version 12.2.1 (MedCalc Software, Acacialaan 22, B-8400 Ostend, Belgium). Based on the results of the logestic regression, models were built by using hematogram components in men and women separately. Only significantly related components of the hematogram were selected into the models. They were added in the order according to the r2 value. To be more specific, WBC and Hb for men and PLT, Hb and WBC for women were used in the model, respectively. Equations were made from the logistic regression of the most complex model for men and women separately. Cox regression was then used to evaluate the hazard ratio of the models and other MetS components. Finally, Kaplan–Meier plot for event-free probability according to our model equations were plot with log rank test used for the significance evaluation. All statistical tests were two-sided and p < 0.05 was considered to be statistically significant.
Results
Among the 4539 study participants, 1327 (613 in men and 714 in female) had MetS in the follow-up periods. The demographic data are shown in . All three hematogram components including WBC, Hb and PLT were significantly different between subjects with and without MetS. The Correlation matrix () showed that WBC and Hb at baseline were associated with most of future MetS components except SBP and DBP in men and HDL-C in women. On the contrary, PLT at baseline only correlated to future DBP and TG in both sexes. The age-adjusted multivariant logistic regression revealed PLT failed to be significantly related with MetS in men. All three components of hematogram were significantly correlated to MetS with OR from 1.003 to 1.177 in women (). The corresponding ROC curves of the models are presented in . It could be noted that the WBC + Hb model had a significantly larger AUC of ROC curve than that of the Hb only in men (p = 0.004). In the same time, PLT + Hb + WBC model had the highest AUC of ROC curve than the next simple model (p = 0.012). The equations of these two models are shown in the “Equation” paragraph. The results of the Cox regression analysis are presented in which shows that the hematogram models were correlated to future MetS with HR of 1.567 and 1.738 in men and women, respectively. Finally, Kaplan–Meier plot showed that the model could successfully predict future MetS (p < 0.001) in both genders ().
Figure 1. Receiver operating characteristic curve of different models in predicting MetS: (a) men and (b) women. PLT: platelet; Hb: hemoglobin; WBC: white blood cell count.
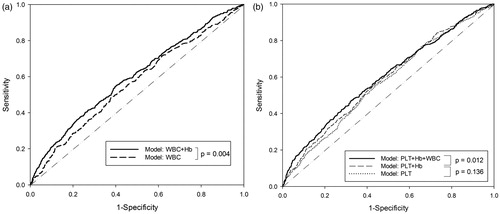
Figure 2. Kaplan–Meier estimates of future MetS at the end of 4-year follow-up according to the models at baseline: (a) men and (b) women.
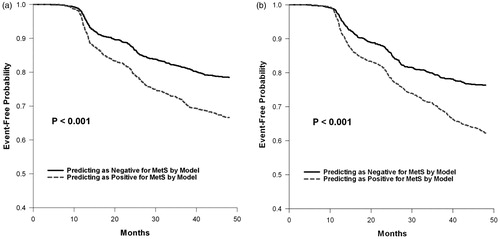
Table 1. The baseline and follow-up demographic data of the study subjects.
Table 2. Correlations between the hematogram components at baseline and the MetS parameters at follow-up.
Table 3. Age adjusted odds ratio and 95% confidence intervals of each hematogram component for having MetS in follow-up period.
Table 4. Cox regression between baseline variables including model and MetS components and having future MetS in follow-up period.
Discussions
The aim of this study was to evaluate the relationships between baseline hematogram (PLT, WBC and Hb) and subsequent MetS development during the follow-up period. Furthermore, a model was also constructed by using these components to predict the future occurrence of MetS. The equation built from the model could be used by the health-care professionals in the old population. To our knowledge, this is the first longitudinal study in this area. Although the area under the ROC curve did not seem to be satisfactory, we still believe that by excluding subjects with medication and building the model, this study is unique and can provide novice information on this field. It should be emphasized that the purpose of this model was not to replace the role of the MetS components, but rather to understand the relationships between hematogram and MetS. In the same time, it is an easy tool for daily clinical practice.
The results of other similar cross-sectional studies supported our findings [Citation16–18,Citation25–27]. For instance, in the study done by Lao et al., the risk of MetS increased significantly with higher WBC, and cardiovascular risk factors were positively associated with WBC in older Chinese population [Citation28]. Another report showed that OR for MS was 2.64 in the highest versus the lowest quartile of WBC in a Korean population [Citation29]. In the longitudinal studies, only few studies had evaluated the relationships between WBC and MetS incidence. Odagiri et al. showed that WBC was a strong predictor for the developing of MetS in Japanese workers. The incidence of MetS was 1.2–1.6 times higher in the highest WBC quartile [Citation30]. Furthermore, the study done by Jung et al. showed that there was a 2.7 times higher chance to have MetS in the highest WBC quartile [Citation31]. Our findings were consistent with these previous reports. The independent OR for subjects per unit (103/μL) increase in the WBC having MetS was 1.119 (95% CI: 1.043–1.199, p = 0.002) in men and 1.177 (95% CI: 1.098–1.262, p < 0.001) in women.
Since the erythropoietin production, a stimulator of Hb synthesis, is triggered by cellular hypoxia which was considered an underlying cause of adipose tissue dysfunction and lead to metabolic changes associated with obesity and MetS [Citation32–35]. Studies have shown that Hb levels were significantly higher not only in subjects with MetS but also related to each abnormal MetS component [Citation26,Citation36]. In the same time, subjects with MetS had elevated Hb, erythropoietin and haptoglobin concentrations [Citation36]. Moreover, Lohsoonthorn et al. [Citation26] concluded that Hb, PLT, and hematocrit concentrations were increased with increasing numbers of MetS components. To our knowledge, our study is the first longitudinal report showing that higher Hb concentration at baseline is associated with each future abnormal MetS components in the elderly. Thus, our results support the hypothesis that the severity of tissue hypoxia, which then leading to MetS in the end, can be measured by Hb since erythropoietin production is stimulated by tissue hypoxia.
In our study, PLT was associated with MetS only in women but not in men. This result could be challenged since elevated PLT is known to play an important role in inflammation through their direct interaction with leukocytes and endothelial cells, and by the release of many factors such as thromboxane A2 [Citation37,Citation38]. However, this result was consistent with our previous cross-sectional study among 1187 Taiwanese older men. In that study, although there was a trend of higher PLT level in MetS, it did not reach statistical significance (p = 0.675). These subjects were further divided into quartiles according to the PLT level from lowest to highest. Among the MetS components, FPG, TC, LDL-C and TG were all statistically different across the four subgroups, suggesting that the elevated PLT still play an important role in MetS. The lack of significance in men is probably due to the “masking” effect by the other two stronger hematogram components, i.e. Hb and WBC.
The major strength of this study is that this is the first longitudinal study to explore the value of hematogram on the prediction of future MetS in elderly. Besides, we also provide gender difference to examine the role of sex on the risk of MetS components and development. However, there are still some limitations in our study. First, the study population involved from the one health screening center, which the member may be in higher social economic background, may not represent the general population. Second, the main central role of MetS was insulin resistance which was unavailable in the current study. Finally, we did not have available data of cardiovascular event or all-cause mortality, which may influence the interpretation of the results.
In conclusion, the associations between hematogram and MetS components were gender specific, and no association was found between PLT and MetS in men. Our results showed that the new hematogram models were effective in predicting future MetS in elderly and might be more practical and convenient in daily clinical practice.
Equations
The value of the equation more than 0 represents higher risk of having MetS in the future
Male
Female
Unit: age: year; WBC: 103/ml; Hb (hemoglobin): g/dl; PLT: 103/μL.
Acknowledgements
The authors thanks MJ Health Screening Centers in proving and preparing the data sources.
Declaration of interest
All authors state no conflict of interest, and this work was supported by Cardinal Tien Hospital research grant (CTH-99-1-2A46) and (CTH-101-1-2A11).
Related Research Data
References
- Avagaro P CG, Enzi G, Tiengo A. Associazione di iperlidemia, diabete mellito e obesitia di medio gado. Acta Diabetol Lat 1967;4:36–41
- Reaven GM. Role of insulin resistance in human disease (syndrome X): an expanded definition. Annual Rev Med 1993;44:121–31
- Pacifico L, Anania C, Martino F, et al. Management of metabolic syndrome in children and adolescents. NMCD 2011;21:455–66
- Zimmet P, Alberti G, Kaufman F, et al. The metabolic syndrome in children and adolescents. Lancet 2007;369:2059–61
- Goodman E, Daniels SR, Meigs JB, Dolan LM. Instability in the diagnosis of metabolic syndrome in adolescents. Circulation 2007;115:2316–22
- Nagasawa N, Tamakoshi K, Yatsuya H, et al. Association of white blood cell count and clustered components of metabolic syndrome in Japanese men. Circulation J 2004;68:892–97
- Stone NJ, Bilek S, Rosenbaum S. Recent National Cholesterol Education Program Adult Treatment Panel III update: adjustments and options. Am J Cardiol 2005;96:53E–9E
- Sattar N, Gaw A, Scherbakova O, et al. Metabolic syndrome with and without C-reactive protein as a predictor of coronary heart disease and diabetes in the West of Scotland Coronary Prevention Study. Circulation 2003;108:414–19
- Chang TY, Chen JD. Fatty liver and metabolic syndrome in nonabdominally obese Taiwanese adults. Asia-Pacific J Public Health 2012;24:472–9
- Malik S, Wong ND, Franklin SS, et al. Impact of the metabolic syndrome on mortality from coronary heart disease, cardiovascular disease, and all causes in United States adults. Circulation 2004;110:1245–50
- Chen J, Muntner P, Hamm LL, et al. The metabolic syndrome and chronic kidney disease in U.S. adults. Ann Internal Med 2004;140:167–74
- Watanabe H, Tanabe N, Watanabe T, et al. Metabolic syndrome and risk of development of atrial fibrillation: the Niigata preventive medicine study. Circulation 2008;117:1255–60
- Oltmanns KM. Abdominal fat and sleep apnea: the chicken or the egg? Response to Pillar and Shehadeh. Diabetes Care 2008;31:e61; author reply e62
- Yeh HC, Punjabi NM, Wang NY, et al. Vital capacity as a predictor of incident type 2 diabetes: the Atherosclerosis Risk in Communities study. Diabetes Care 2005;28:1472–9
- Madjid M, Fatemi O. Components of the complete blood count as risk predictors for coronary heart disease: in-depth review and update. Texas Heart Institute J 2013;40:17–29
- Chuo SK, Li JC, Tsai WC, et al. Correlations between white blood cell count and metabolic syndrome in middle-age Taiwanese. Endocrine Res 2005;31:39–50
- Hsieh CH, Pei D, Kuo SW, et al. Correlation between white blood cell count and metabolic syndrome in adolescence. Pediatr Int 2007;49:827–32
- Wu CZ, Lin JD, Li JC, et al. Association between white blood cell count and components of metabolic syndrome. Pediatr Int 2009;51:14–18
- Sikora J, Broncel M, Markowicz M, et al. Short-term supplementation with Aronia melanocarpa extract improves platelet aggregation, clotting, and fibrinolysis in patients with metabolic syndrome. Eur J Nutr 2012;51:549–56
- Chang YL, Pei C, Pei D, et al. Association between platelet count and components of metabolic syndrome in geriatric Taiwanese males. Int J Gerontol 2012;6:215–19
- Chen YL, Hseih CH, Wang K, et al. Association between platelet count and components of metabolic syndrome in geriatric Taiwanese women. Int J Gerontol 2012;6:201–5
- Liu H, Hsu CH, Lin JD, et al. Predicting metabolic syndrome by using hematogram models in elderly women. Platelets 2014;25:97–101
- Alberti KG, Eckel RH, Grundy SM, et al. Harmonizing the metabolic syndrome: a joint interim statement of the International Diabetes Federation Task Force on Epidemiology and Prevention; National Heart, Lung, and Blood Institute; American Heart Association; World Heart Federation; International Atherosclerosis Society; and International Association for the Study of Obesity. Circulation 2009;120:1640–5
- Department of Health EY, R.O.C. (Taiwan). Available from: http://www.doh.gov.tw/CHT2006/DM/DM2_p01.aspx?class_no = 25&now_fod_list_no = 5912&level_no = 2&doc_no = 22602. [last accessed 10 Feb 2013]
- Ishizaka N, Ishizaka Y, Toda E, et al. Association between cigarette smoking, white blood cell count, and metabolic syndrome as defined by the Japanese criteria. Intern Med 2007;46:1167–70
- Lohsoonthorn V, Jiamjarasrungsi W, Williams MA. Association of hematological parameters with clustered components of metabolic syndrome among professional and office workers in Bangkok, Thailand. Diabetes Metab Syndrome 2007;1:143–9
- Kotani K, Sakane N, Saiga K, et al. Clustered components of the metabolic syndrome and platelet counts in Japanese females. Clin Chem Lab Med 2007;45:376–9
- Lao XQ, Neil Thomas G, Jiang C, et al. White blood cell count and the metabolic syndrome in older Chinese: the Guangzhou Biobank Cohort Study. Atherosclerosis 2008;201:418–24
- Kim DJ, Noh JH, Lee BW, et al. The associations of total and differential white blood cell counts with obesity, hypertension, dyslipidemia and glucose intolerance in a Korean population. J Korean Med Sci 2008;23:193–8
- Odagiri K, Uehara A, Mizuta I, et al. Longitudinal study on white blood cell count and the incidence of metabolic syndrome. Intern Med 2011;50:2491–8
- Jung CH, Lee WY, Kim BY, et al. The risk of metabolic syndrome according to the white blood cell count in apparently healthy Korean adults. Yonsei Med J 2013;54:615–20
- Jelkmann W. Erythropoietin: structure, control of production, and function. Physiol Rev 1992;72:449–89
- Pasarica M, Sereda OR, Redman LM, et al. Reduced adipose tissue oxygenation in human obesity: evidence for rarefaction, macrophage chemotaxis, and inflammation without an angiogenic response. Diabetes 2009;58:718–25
- Vij U, Murugesan K, Laumas KR, Farooq A. Progestin and antiprogestin interactions with progesterone receptors in human myomas. Int J Gynaecol Obstetr 1990;31:347–53
- Regazzetti C, Peraldi P, Gremeaux T, et al. Hypoxia decreases insulin signaling pathways in adipocytes. Diabetes 2009;58:95–103
- Hamalainen P, Saltevo J, Kautiainen H, et al. Erythropoietin, ferritin, haptoglobin, hemoglobin and transferrin receptor in metabolic syndrome: a case control study. Cardiovascular Diabetol 2012;11:116
- Dovizio M, Alberti S, Guillem–Llobat P, Patrignani P. Role of platelets in inflammation and cancer: novel therapeutic strategies. Basic Clin Pharmacol Toxicol 2014;114:118–27
- Drouet L, Bal dit Sollier C, Henry P. The basis of platelets: platelets and atherothrombosis: an understanding of the lack of efficacy of aspirin in peripheral arterial disease (PAD) and diabetic patients. Drugs 2010;70:9–14