
Abstract
Objective: To examine the relationship between age and BMD at different skeletal sites and osteoporosis (OP) detection rates in Han Chinese men over 50 years and to assess the diagnostic value of the OSTA.
Methods: A retrospective analysis of 1488 men over 50 was carried out and group comparisons were made.
Results: BMDs at total hip and femoral neck decreased with age (p < 0.01) and were negatively correlated with age by liner correlation analysis (r = −0.36, −0.30; p all <0.05). The detection rates of OP and osteopenia were 10.08% and 43.21% respectively, which increased with age, and significantly higher among over 70 years old than under 70 individuals (47.75% versus 35.56%; 14.88% versus 1.99%; p all <0.01). The detection rate at the femoral neck was similar to the overall detection rate. Sensitivities of OSTA index at a cutoff value of −1 and −4 were 87.33% and 52.0% respectively, and the specificities were 56.20% and 87.59%.
Conclusion: BMDs at femoral neck and total hip decrease with age. Detection rates of OP increase with age. Bilateral femoral neck BMD measurement can improve detection rates of OP. OSTA is a useful screening tool for OP in Han Chinese men over 50 years.
Introduction
Osteoporosis is a skeletal disease characterized by low bone mass and micro-architectural deterioration of bone tissue, leading to an increase in bone fragility and susceptibility to fracture. Osteoporosis can affect men and women of all ages, but is more common among the post-menopausal women and elderly over 70-year-old [Citation1]. According to the epidemiological data, in China, the prevalence of osteoporosis is estimated at 5.5% to 15.5% for men and 11.8% to 24.5% for post-menopausal women [Citation2,Citation3]. Globally, about one-third of hip fractures occur in men [Citation2,Citation4] and the mortality rate as a result of hip fractures is 37.5% more in men than in women [Citation5]. According to a WHO estimate, in the next 50 years, about 50% of hip fracture incidence will be in Asia. As the aging population is growing steadily, osteoporosis in men is now recognized as an increasingly important public health issue.
While genetic and environmental factors play a significant role in the susceptibility to osteoporosis and osteoporotic fractures, age is undoubtedly an independent risk factor. According to the research findings in the past, however, a consistent inverse relationship between age and BMD is not existing, especially the change in lumbar spine BMD in aging men [Citation6]. Although it was generally believed that the lumbar spine BMD increases with age, there are also conflicting results regarding the effect of age on BMD. A research by Yu et al. [Citation7] found that the lumbar spine BMD in men decreased gradually with age until stabilized or increased only slightly at around 75 to 89 years of age.
The Osteoporosis Self-assessment Tool for Asians (OSTA) is a tool for screening osteoporosis based on age and weight and therefore its clinical utility is convenient and effective. The OSTA was developed by Koh et al. [Citation8] in 2001 by analyzing data of 860 post-menopausal women from eight countries and was validated in a sample of 1123 post-menopausal women. Numerous risk factors for osteoporosis with regards to the BMD measurements were assessed and 11 variables were identified to have significant associations with BMD. Further refining with the multiple regression analyses reduced items and a final tool based on only age and body weight was found to reveal high sensitivity and specificity.
At a cutoff of OSTA ≤−1 and T-scores ≤−2.5, the risk index has been found to reveal sensitivity of 91% and a specificity of 45% that was validated as sensitivity of 98% and specificity of 29% in another cohort [Citation8]. Further studies on post-menopausal women in South Korea, China, Thailand, the Philippines and other Asian countries revealed sensitivity and specificity in the range of 87–97.5% and 54.6–60.8%, respectively [Citation9–11]. However, there are relatively fewer studies in Asian men populations, and the limited available data suggest that for a cutoff of OSTA ≤−1, the sensitivity ranges from 70 to 90% with 70% specificity [Citation8,Citation12]. Studies have shown that OSTA has a good screening value for post-menopausal women but there are only a few studies in old men to assess this tool.
The purpose of the present study was to examine the effect of age on (a) the changes in BMD at different skeletal sites; (b) osteoporosis detection rates; and (c) on diagnostic accuracy of the Osteoporosis Self-assessment Tool for Asians (OSTA), in a sample population of over 50 years age Han Chinese men.
Materials and methods
Study subjects
The subjects of this study were Han Chinese men over the age of 50, who attended routine physical examinations from 2008 to 2011 in our hospital. Cases were excluded if: (1) diseases/condition such as delayed puberty, hypogonadism, hyperparathyroidism, hyperthyroidism, or chronic obstructive pulmonary disease, etc.; (2) taking or had taken drugs such as glucocorticoids or GnRH agonists, etc.; (3) medical history of bone tumor; (4) had taken osteoporosis medications (e.g. bisphosphonates, calcitonin, strontium ranelate, triparatide, etc.); (5) with severe liver or kidney disease; (6) heavy drinkers or smokers; (7) remained bed-ridden for over three months; (8) had bilateral hip fractures or underwent hip replacement surgery. In total, 1488 eligible participants were included in the study sample.
Methods
In this study, a retrospective analysis was carried out by examining the general information and BMD data of Han Chinese men over the age of 50 visiting hospital for routine physical check-ups. The study was conducted after the approval from Ethics Committee of the Chinese PLA General Hospital.
BMD testing
BMD measurements were made by dual-energy x-ray absorptiometry (DXA) scan (Lunar Prodigy Advance; GE Healthcare, Beijing, China), CV < 1%. All measurements were carried out by the same trained operator. Subjects undergoing DXA scan were asked to remove all metal objects from their bodies (e.g. metal zipper, metal buttons, etc.). It was also made sure that they were not exposed to radionuclides or any imaging agents within the last three days before scanning. Measurement sites: bilateral distal femurs (total hip, femoral neck), and lumbar spine 1–4 (L1–4). Positioning: the patient was in a lying position with his legs turned slightly inwards and held in place by the use of positioning devices.
Diagnostic criteria for osteoporosis (WHO, 1994)
In this study, we have utilized WHO diagnostic criteria for osteoporosis which classifies three categories as normal, osteopenia, and osteoporosis. Normal bone mass: BMD < 1 SD below the young adult reference value (T-score >−1); osteopenia: BMD 1 ∼ 2.5 SD below the young adult reference value (−2.5 < T-score ≤ −1); osteoporosis: BMD > 2.5 SD below the young adult reference value (T-score ≤−2.5). The lowest T-score of the total hip, femur neck or lumbar spine (L1–4) is used for diagnosis of osteoporosis or osteopenia.
OSTA
OSTA index is calculated with the following formula: OSTA index = Integer [0.2 × (weight in kilograms − age)]. Risk levels: Low risk, OSTA index >−1; medium risk, −4 < OSTA index ≤ −1; high risk, OSTA index ≤−4.
Patient groups
Patients were grouped by age, OP and OSTA index. Five groups based on age: 50–59, 60–69, 71–80, 81–90 and 90+. Three groups based on the osteoporotic diagnostic criteria (WHO): Normal, Osteopenia and Osteoporosis.Three groups based on OSTA index: Low risk, Medium risk and High risk.
Statistical analysis
Statistical analyses were performed with SPSS 19.0 (IBM Corporation, Armonk, New York). The data were presented as the mean ± standard deviation (SD). The comparisons among the groups were analyzed by chi-square test with data expressed in percentage terms. Linear correlation analysis was also carried out using Pearson correlation, followed by stepwise multiple logistic regression analysis. In all the comparisons, the p value for statistical significance was defined as p < 0.05.
Results
Comparisons of general characteristics
The comparisons of general characteristics are given in . Group-wise comparisons were made in the variables including age, height, weight and body mass indices (BMI). With respect to height and weight, the differences were statistically significant (p < 0.05) among the age groups, except for the 60–69 and 70–79 age groups. As for the BMI, significant differences were observed only between the age group 50–59 and other groups (p < 0.05). OSTA indices showed a tendency to increase with age and, there were significant differences in OSTA indices among all age groups (p < 0.01).
Table 1. Comparisons of general characteristic data for different age groups.
Age-related changes in BMD at different skeletal sites
The BMDs of the lumbar vertebrae L1–4 increased with age, but no statistical significance was found (, ). Results of a t-test showed no statistically significant differences in the bilateral hip and femoral neck BMDs. However, when lower values of the bilateral measurements were selected for further analysis, it was noticed that the BMD at total hip and femoral neck decreased with age (p < 0.01)
Figure 1. Age-related changes in BMD at the lumbar spine, total hip and femoral neck.
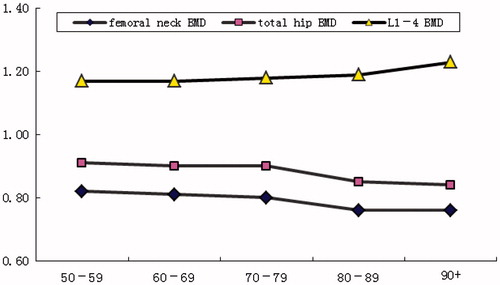
Table 2. Age-related changes in BMD in the lumbar spine, total hip and femoral neck.
Detection rates of osteoporosis and osteopenia
The overall detection rate of osteoporosis and osteopenia
For the sample population studied, detection rates of osteoporosis and osteopenia were 10.08% and 43.21%, respectively, with a combined prevalence (CP) of 53.29%. The detection rates of osteoporosis and osteopenia at L1–4 were 1.13% and 8.87% with a CP of 10%. The detection rates of osteoporosis and osteopenia at the total hip were 3.09% and 23.25% (CP 26.34%); at the left hip 2.49% and 20.5% (CP 22.99%); and at the right hip were 1.88% and 20.5% (CP 22.38%). The detection rates of osteoporosis and osteopenia at the femoral neck were 9.81% and 43.28% (CP 53.09%); at the left femoral neck were 7.53% and 39.85% (CP 47.38%); and at the right femoral neck were 7.86% and 39.05% (CP 46.91%). The difference between the overall detection rate of osteoporosis and osteopenia and the detection rate at the femoral neck was not statistically significant (χ2 = 0.06, p = 0.97), however both were significantly different statistically from the detection rates at the total hip and the lumbar spine (p < 0.01).
Detection rates of osteoporosis and osteopenia among the age groups
shows the overall detection rates of osteoporosis and osteopenia at different skeletal sites among the age groups. The overall detection rates of osteoporosis and the detection rates at the femoral neck and the total hip appeared to increase with age, reaching 27.27% for the 90+ age group. The overall detection rates of osteopenia showed a similar tendency, with the highest found in the 80–89 age group (49.43%). There was no significant difference between the 80–89 and the 90+ age groups in this regard. The percentage of subjects with normal bone mass decreased with age, with no statistically significant difference between 80–89 and the 90+ age groups.
Table 3. The percentages of osteoporosis, osteopenia and normal bone mass in all age groups.
Among all age groups, the overall detection rate of osteoporosis and osteopenia was similar to the detection rate at the femoral neck, and the difference was not statistically significant (p > 0.05). However the detection rates of osteoporosis and osteopenia at the total hip were significantly lower than the overall detection rate and at the femoral neck (p < 0.01). Whereas there were no statistically significant differences in the detection rates of osteoporosis, osteopenia and normal bone mass at the lumbar spine among all age groups.
Comparisons of osteoporosis and osteopenia detection rates between the under 70 and over 70 age groups
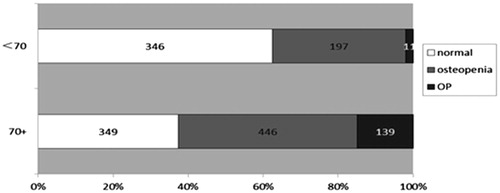
For the under 70 age group, the detection rates of osteoporosis, osteopenia and normal bone mass were, respectively, 1.99%, 35.56% and 62.45%, with an overall detection rate of 37.77% for both osteoporosis and osteopenia. On the other hand, for the over 70 age group, the detection rates of osteoporosis, osteopenia and normal bone mass were much higher and statistically highly significant; 14.88%, 47.75% and 37.37%, respectively (overall detection rate of 62.63% for both osteoporosis and osteopenia; χ2 = 116.20, p = 0.000; ).
Figure 2. Comparisons of osteoporosis, osteopenia and normal bone mass detection rates between the under-70 and over-70 age groups.
Correlation of age and BMD
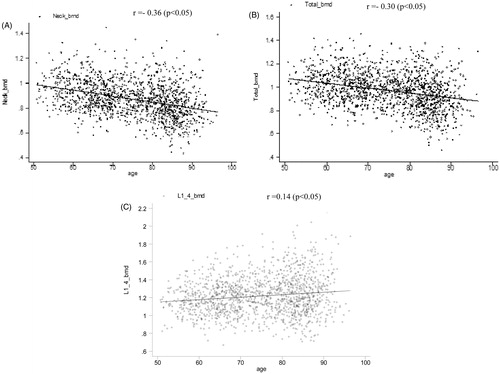
Pearson regression analysis showed that the BMDs at femoral neck and total hip were negatively correlated with age (r = −0.36 and r = −0.30, respectively; p < 0.05), whereas the BMD at lumbar spine was positively correlated with age (r = 0.14; p < 0.05; ).
Figure 3 (A) Correlation of the femoral neck BMD with age. (B) Correlation of the total hip BMD with age. (C) Correlation of the lumbar spine BMDwith age.
Multiple logistic regression analysis
Multiple logistic regression analysis was performed with the presence of osteoporosis as a categorical dependent variable and body age, weight, height, and BMI as independent variables. The regression equation was y = −0.07 + 0.05 × age − 0.05 × body weight, which included only body weight and age as the independent risk factors for osteoporosis ().
Table 4. Logistic regression analysis.
Diagnostic performance of OSTA for osteoporosis
Diagnostic value of the OSTA index
As shown in and , based on the OSTA indices and the BMD measurements, OSTA provided more diagnostic value for osteoporosis in the high risk group (OSTA index ≤−4) than in the medium risk group (−4 < OSTA index ≤ −1).
Table 5. The diagnostic value of OSTA index ≤−1 for osteoporosis and osteopenia.
Table 6. The diagnostic value of OSTA index ≤−4 for osteoporosis and osteopenia.
The proportion of risk groups among the different age groups
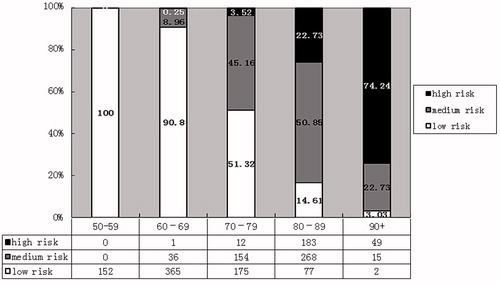
Based on the OSTA index, the proportion of the low risk group for osteoporosis decreased with age, while that of the high risk group increased with age (χ2 = 917.02, p = 0.000; ).
Figure 4. The proportion of risk groups among the different age groups.
The proportion of subjects with osteoporosis, osteopenia and normal bone mass in different risk groups
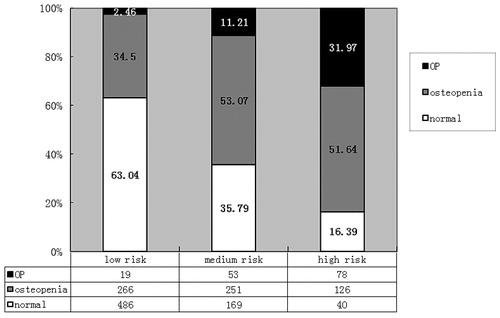
Among those categorized as low, medium and high risk groups based on the OSTA index, the proportion of subjects with normal bone mass decreased as the osteoporosis risk as well as the proportion of subjects with osteoporosis increased (χ2 = 293.30, p = 0.000; ).
Figure 5. The proportion of subjects with osteoporosis, osteopenia and normal bone mass in different risk groups.
Discussion
Age-related changes in BMD at different skeletal sites
Our study showed that, although, the differences among the age groups did not attain statistical significance, the BMD of all the lumbar vertebrae especially L1–4 exhibited an increasing trend with age. This was substantiated by the linear regression analysis which showed that the lumbar spine BMD was positively correlated with age. In a systematic review, Papaioannou et al. [Citation6] studied the risk factor for osteoporosis and showed that hip BMD for men was negatively correlated with age (a decrease of 1.5–2.5% in every 10 years). This was different from the rapid bone mineral loss among women during the 5–10 years after menopause [Citation13].
Previous studies have shown that the increase of lumbar spine BMD may be related to the hyperostosis of the lumbar spine or abnormal calcification in the surrounding tissues, e.g. the facet joint hyperostosis, the calcification of the intervertebral disc, the calcification of the anterior or posterior longitudinal ligaments and the calcification of the blood vessel walls. It has therefore been recommended that the measurement of lateral lumbar spine BMD should be used for the diagnosis of osteoporosis [Citation14]. The advantages include: (1) ruling out the possibilities of abdominal aortic calcification, facet joint degeneration, intervertebral disc calcification, Schmorl’s nodes and bone spurs; (2) eliminating the influence of cortical bone at skeletal sites where the latter is predominant, e.g. the spinous process, the transverse process and the pedicle of vertebral arch, so that the bone mineral loss can be detected earlier. In our clinical practice, however, we found that the lateral lumbar spine BMD is not easy to measure for the elderly because of the difficulties in the positioning of a patient during the process. It is desirable to resort to quantitative CT (QCT) for a reliable measurement.
Detection rates of osteoporosis and osteopenia
BMD measurement by DXA is considered as the “gold standard” for the osteoporosis diagnosis. Based on the level of fracture risk, it is arbitrarily divided into three phases: normal bone mass, osteopenia and osteoporosis. In fact, the BMD is a continuous variable, and although osteopenia is an abnormal state between normal bone mass and osteoporosis, incidences of fractures are not uncommon due to its high prevalence. It estimated that 5% of men over the age of 50 suffer from osteoporosis, and up to 30% to 50% with osteopenia. According to a study for post-menopausal Caucasian women, about half of the fracture cases occurred in patients with osteopenia [Citation15].
In this study, we have found that the detection rates of osteoporosis and osteopenia were 10.08% and 43.21% respectively which increased with age; 27.27% of subjects above 90 age were suffering from osteoporosis and 45.16–49.43% of those above 70 age with osteopenia. When we compared the detection rates of osteoporosis and osteopenia for the 50–69 and ≥70 age groups, the detection rates for the ≥70 age group were significantly higher than for the 50–69 age group (14.88 & 1.99%; 47.75 & 35.56%; p < 0.01). However, although the osteoporosis detection rate was only 1.99% for the 50–69 age group, the osteopenia detection rate was much higher (35.56%). Therefore, BMD tests are recommended for this age group.
Detection rates of osteoporosis and osteopenia at different skeletal sites
According to the epidemiological data, in China, the osteoporosis detection rate (for both genders) by the BMD measurement at the lumbar spine is 10.9% for the 50–55 age group and 44.2% for the 65–70 age group. While for femoral neck, it increase from 1.6% in 50–55 age to 24.3% in 67–70 age, a much lower increment than for the lumbar spine. For the age group of 70–75, the detection rates were similar at both sites, with 45.0 and 44.3%, respectively. For the 75+ age group, the detection rate decreased at the lumbar spine but increased at the femoral neck. On the other hand, among the men aged 50–70, the detection rates were comparable at both sites, whereas for men over the age of 70 it was significantly higher at the femoral neck then at the lumbar spine [Citation16]. For osteoporosis diagnosis, Kanis et al. [Citation17] found that the sensitivity of a hip BMD measurement was much higher than at other sites, and suggested that measurement at the hip should be regarded as the standard. This was also supported by other studies [Citation18,Citation19], although, the highest detection rate was found at the femoral neck in a study [Citation20].
The present study showed that the combined detection rate of osteoporosis and osteopenia at the femoral neck was similar to the overall detection rate. However, it was considerably higher than those at the lumbar spine and the total hip. Although most studies suggest that the measurements on both sides of the total hip and the femoral neck are not statistically significant, a difference of 0.5 standard deviation can be detected between the measurement on both sides for about 30% of the population, which, as a result, may affect the diagnosis and treatment of osteoporosis [Citation20–22]. Our study found that although no significant differences were observed in the bilateral hip BMD measurements, the combined detection rate of osteoporosis and osteopenia on either side of the total hip or femoral neck was lower than the overall detection rate (based on the lower value of the bilateral measurements). We therefore recommend that, if possible, the BMD of both sides of the femoral neck be tested to improve the diagnosis of osteoporosis.
The diagnostic value of OSTA index for Han Chinese men (over 50 years age)
In the present study, it has been demonstrated that the OSTA index can be a valuable tool for osteoporosis diagnosis as seen in Han Chinese men over the age of 50. For a cutoff of OSTA ≤−1, it had sensitivity of 87.33% and specificity of 56.20%, a correct diagnosis rate of 59.34% and a Youden index of 0.44. For a cutoff of OSTA index ≤−4, it had a sensitivity of 52.00%, a specificity of 87.59%, a correct diagnosis rate of 84.01%, and a Youden index of 0.40. In particular, the OSTA index has been shown to be of better diagnostic value for osteoporosis in the high risk group (OSTA index ≤−4) as compared to osteopenia.
In post-menopausal women, the prevalence of osteoporosis is 3% in the low risk group, 15% in the medium risk group and 61% in the high risk group, based on the OSTA index. Moreover, the proportion of the low risk population decreased with age, while that of the high risk population increased with age to the extent of 74.24% for those over the age of 90 [Citation8]. Among the Chinese subgroup, the prevalence of osteoporosis in the low, medium and high risk groups were reported to be 1, 13 and 42%, respectively. In this study of over 50 age Han Chinese men, the prevalence of osteoporosis in the low, medium and high risk groups were found to be 2.46, 11.21 and 31.97%, respectively, which were similar to the findings for the Chinese subgroup of post-menopausal women.
As observed in this study, osteoporosis was much more prevalent in the high risk group and the OSTA index had a high diagnostic accuracy. This finding provided additional evidence to support the recommendation that that over 70 years old men, and individuals aged between 50 and 69 with additional risk factors should undergo bone mineral density (BMD) measurement for osteoporosis screening, and for high-risk individuals under OSTA evaluation, anti-osteoporosis medications can be directly prescribed under the circumstances when BMD measurements are not possible due to a lack of resources [Citation23,Citation24]. However, it is necessary to point out that the sample of population in this study consisted of employees in a corporation in Beijing, and further validation is required as to whether this sample is representative of the general population of Han Chinese men over the age of 50.
Conclusion
In a sample population of Han Chinese men over the age of 50, the BMDs at femoral neck and total hip were found to decrease with age, while the BMD at lumbar spine did not show a similar tendency. The detection rates of osteoporosis and osteopenia also increased with age, and the detection rates at the femoral neck were closest to the overall detection rates. We suggest performing bilateral measurements of femoral neck BMD in order to improve the detection rate of osteoporosis and osteopenia. For the purpose of risk assessment, OSTA has been found to be a useful screening tool in this population. Our study has shown that older age and lower body weight are also the most significant independent risk factors of osteoporosis.
Declaration of interest
No conflict among the authors
References
- Burge R, Dawson-Hughes B, Solomon DH, et al. Incidence and economic burden of osteoporosis-related fractures in the United States, 2005–2025. J Bone Miner Res 2007;22:465–75
- Wang Y, Tao Y, Hyman ME, et al. Osteoporosis in china. Osteoporos Int 2009;20:1651–62
- Census Office. The National Bureau of Statistics. The fifth national census in Beijing. Beijing, China: China Statistics Press; 2000
- Gullberg B, Johnell O, Kanis JA. World-wide projections for hip fracture. Osteoporos Int 1997;7:407–13
- Jiang HX, Majumdar SR, Dick DA, et al. Development and initial validation of a risk score for predicting in-hospital and 1-year mortality in patients with hip fractures. J Bone Miner Res 2005;20:494–500
- Papaioannou A, Kennedy CC, Cranney A, et al. Risk factors for low BMD in healthy men age 50 years or older: a systematic review. Osteoporosis Int 2009;20:507–18
- Yu W, Liang M. The lumbar BMD changes at lumbar spine in healthy adults. Chinese Journal of Radiology 1996;30:625–9
- Koh LK, Sedrine WB, Torralba TP, et al. A simple tool to identify Asian women at increased risk of osteoporosis. Osteoporos Int 2001;12:699–705
- Park HM, Sedrine WB, Reginster JY. Korean experience with the OSTA risk index for osteoporosis: a validation study. J Clin Densitom 2003;6:247–50
- Geater S, Leelawattana R, Geater A. Validation of the OSTA index for discriminating between high and low probability of femoral neck and lumbar spine osteoporosis among Thai post-menopausal women. J Med Assoc Thai 2004;87:1286–92
- Li-Yu JT, Llamado LJ, Torralba TP. Validation of OSTA among Filipinos. Osteoporos Int 2005;16:1789–93
- Kung AW, Ho AY, Ross PD, et al. Development of a clinical assessment tool in identifying Asian in men with low bone mineral density and comparison of its usefulness to quantitative bone ultrasound. Osteoporos Int 2005;16:849–55
- Berntsen GK, Fønnebø V, Tollan A, et al. Forearm bone mineral density by age in 7620 men and women: the Tromsø study, a population-based study. Am J Epidemiol 2001;153:465–73
- Liao E, Zhang H. Some key issues in the diagnosis of osteoporosis. Journal of Endocrine and Metabolism 2011;27:101–5
- Khosla S, Melton LJ. Osteopenia. N Engl J Med 2007;356:2293–300
- Zhu H, Fang J, Luo X, et al. A survey of bone mineral density of healthy Han adults in China. Osteoporos Int 2010;21:765–72
- Kanis JA, Gluer CC. An update on the diagnosis and assessment of osteoporosis with densitometry. Osteoporosis Int 2000;11:192–202
- Faulkner KG. The tale of the T-score: review and perspective. Osteoporos Int 2005;16:347–52
- Gary MK, Kenneth GF, Wynn W, et al. Effect of precision error on T-scores and the diagnostic classification of bone status. J Clin Densit 2007;10:239–43
- Zhang Y, Pei Y, Qi Y. Comparisons of osteoporosis detection rates by BMD measurements at different skeletal sites. J Osteoporos 2010;16:45–7
- Faulkner KG. Improving femoral bone density measurements. J Clin Densit 2003;6:353–8
- Faulkner KG. The tale of the T-score: review and perspective. Osteoporos Int 2005;16:347–52
- Watts NB, Adler RA, Bilezikian JP, et al. Osteoporosis in men: an endocrine society clinical practice guideline. J Clin Endocrinol Metab 2012;97:1802–22
- Osteoporosis and Bone Mineral Society of the Chinese Medical Association. Guidelines for primary osteoporosis diagnosis. Chin J Osteoporos Bone Mineral Res 2011;4:2–17