Abstract
Context: Blank chitosan nanoparticles are currently used as reference for the calibration curve, which fails to resolve the supernatant of the nanoparticles in the interference of Coomassie Brilliant Blue G-250 reagent; supernatants are generated at different chitosan nanoparticulate prescriptions, which have different interferences. There are notable errors in the experimental results, and the method is not feasible.
Objective: In this study, an improved, rapid, and economic Bradford method was developed and validated.
Materials and methods: The pH of the supernatant of blank chitosan nanoparticles was adjusted to 7–9 through adding saturated NaOH. The precipitation (free chitosan) in the solution was separated by centrifuging for about 10 min (4000 r/min).
Results: The method eliminated the interference of free chitosan of different prescriptions. The results showed that the method presented a linearity in the range of 50–300 μg/mL (R2 = 0.9992), and possessed a good inter-day and intra-day precision based on relative standard deviation values (less than 3.10%). Recovery of the supernatant of blank chitosan nanoparticles was between 98.30 and 99.93%, and the recovery of blank chitosan nanoparticles was between 95.57 and 100.27%.
Discussion and conclusion: The method was further tested for determination of the association efficiency of insulin to nanoparticulate carriers composed of chitosan. Encapsulant release under simulated gastrointestinal fluids was evaluated.
Introduction
Chitosan, the deacetylated derivative of chitin, is one of the abundant, renewable, non-toxic, and biodegradable carbohydrate polymers. Chitosan has been widely applied as a functional biopolymer in food and pharmaceutics (CitationQi et al., 2007). Chitosan is insoluble at neutral and alkaline pH, but forms water-soluble salts with inorganic and organic acids, including glutamic acid, hydrochloric acid, lactic acid, and acetic acid. Upon dissolution in acid media, the protonated amino groups of the polymer render the molecule positively charged (CitationDyer et al., 2002). Chitosan is a polycation with an apparent pKa 5.5; hence, in neutral and basic environments prevailing in the intestine, chitosan molecules lose their charge and precipitate (CitationSadeghi et al., 2008). The properties of chitosan (e.g. pKa and solubility) can be modified by changing the degree of deacetylation and formulation properties such as pH and ionic strength.
Chitosan nanoparticles as used in this study have many advantages, such as mild preparation conditions and an excellent capacity for protein entrapment (CitationCalvo et al., 1997). Moreover, chitosan nanoparticles have been proved to be efficient vehicles for the transport of insulin through the nasal mucosa; consequently, researchers hypothesize that they may be effective for pulmonary delivery (CitationFernández-Urrusuno et al., 1999). The methods for assaying insulin in chitosan nanoparticles are many, such as the currently used high performance liquid method (CitationCui et al, 2006; CitationKrauland et al., 2004; CitationSilva et al., 2006), Micro BCA method (CitationUbaidulla et al., 2007), direct ultraviolet (UV) spectrophotometry method (CitationXu & Du, 2003), Bradford method (CitationFan et al., 2006; CitationMartins et al., 2007; Zhang et al., 2007), Lowry method (CitationLuangtana-anan et al., 2005; CitationSajeesh & Sharma, 2006), enzyme-linked immunosorbent assay (ELISA) method (CitationBhumkar et al., 2007; CitationJoshi et al., 2006), and so on. The Bradford method is widely used in determining protein content owing to its merits of economy, rapidity, and reproducibility, and the Bradford method has been applied in different areas such as environmental studies (CitationCriquet et al., 2002; CitationHarner et al., 2004) and food protein composition studies (CitationKamizake et al., 2003), in medical research (CitationFunding et al., 2005), and so on, presenting advantages such as good selectivity, reagent stability, and useful linear dynamics range (CitationAzeredo et al., 2003). A technique used to separate proteins based on hydrophobicity is probably the most useful analytical method for separation and determination of peptides and proteins from chitosan nanoparticulate systems in an extensive range of applications (CitationWang et al., 2005). Therefore, the method is an accurate way to measure insulin in chitosan nanoparticulate systems (CitationFan et al., 2006; CitationMartins et al., 2007; Zhang et al., 2007).
However, blank chitosan nanoparticles are currently used as reference for the calibration curve, which fails to resolve the supernatant of the nanoparticles in the interference of Coomassie Brilliant Blue G-250 reagent; nanoparticulate supernatants are generated at different quality ratios of chitosan and tripolyphosphate (TPP), which have different interferences of Coomassie Brilliant Blue G-250 reagent. There are notable errors in the experimental results, and the method is not feasible. The aim of the current work was to propose a mechanized system for protein determination in different types of chitosan nanoparticulate samples and to improve some figures of merit of the Bradford method. An improved rapid and economic Bradford method for the determination of insulin from nanoparticulate carriers made from chitosan is described and validated. Furthermore, its application to characterization of an insulin-loaded chitosan nanoparticulate system is also evaluated. The specific application to insulin nanoparticulate dosage forms would provide a suitable way to characterize the system carrier.
Materials and methods
Materials
Chitosan (deacetylation 96.2%, 20°C, viscosity 40 cps) was obtained from Shandong AK Biotech Ltd. Insulin (27.8 IU·mg−1) was purchased from Xuzhou Biochemical Plant, China. Tianjing Hongyan Chemical Reagents Factory produced the TPP. Coomassie Brilliant Blue G-250 was obtained from MBCHEM. All other chemicals and solvents were of analytical grade.
Equipment
Equipment included a UV-2201 UV analyzer (Shimadzu), Sorvall® Biofuge Stratos low-temperature high-speed centrifuge (Thermo, Germany), THZ-051 high-precision CNC shaker (Thermo, Germany), ALPHA1-4 LSC freeze dryer (Martin Christ, Germany), and a Nano-ZS90 particle size analyzer (Malvern, England).
Preparation of protein reagent
Coomassie Brilliant Blue G-250 (100 mg) was dissolved in 50 mL of 95% ethanol. To this solution, 100 mL of 85% (w/v) phosphoric acid was added. The resulting solution was diluted to a final volume of 1 L. Final concentrations in the reagent were 0.01% (w/v) Coomassie Brilliant Blue G-250, 4.7% (w/v) ethanol, and 8.5% (w/v) phosphoric acid (CitationBradford, 1976).
Conditions of determination
Chitosan nanoparticles were isolated by centrifugation (15,000 r/min). After the supernatant of blank chitosan nanoparticles containing insulin was adjusted to pH 7–9 through the use of saturated NaOH, the precipitation (free chitosan) was separated from the solution by centrifuging for about 10 min (4000 r/min). The supernatant in a volume of 0.1 mL was pipetted into 5 mL test tubes, and 3 mL of Coomassie Brilliant Blue G-250 dye reagent was added to the test tubes, then the contents were mixed by vortexing. The absorbance at 595 nm was measured after 10–15 min. The content of insulin was plotted against the corresponding absorbance, resulting in a standard curve used to determine the insulin in unknown samples.
Preparation of standard solutions
Calibration curves for insulin standard solutions were prepared at concentrations of 50, 100, 150, 200, 250, and 300 μg/mL in pH 7.4 phosphate buffer solution (PBS), in which the chitosan nanoparticulate carriers were produced. A primary stock solution of 2 mg/mL was accurately prepared by rigorous dilution with the same buffer solution to give secondary standard solutions. Freshly prepared stock solutions were used for all determinations and were kept at 4°C between each determination.
Stability research of absorption and concentration
Insulin standard solution was prepared at concentrations of 100, 200, and 300 μg/mL in pH 7.4 PBS; a volume of 0.1 mL was pipetted into 5 mL test tubes, 3 mL of Coomassie Brilliant Blue G-250 dye reagent was added to the test tubes, and the contents were mixed by vortexing. The absorbance at 595 nm was measured after 3 min. The time range of determination was 15 min: the absorbance was determined and concentrations calculated at 3, 5, 8, 10, 13, and 15 min, respectively.
Validation of the method
The method was validated by International Conference on Harmonization guidelines (CitationUS Food and Drug Administration, 1996), using the following as analytical parameters: linearity, precision, accuracy, specificity. Linearity was evaluated by calculation of a regression line using the least squares method. Calibration curves were obtained from six different concentrations and were analyzed three times. Precision was assessed by testing the repeatability of three different standard solutions, five times in the same day (intra-day), and intermediate precision was analyzed in the same three standard solutions, five times, on different days (inter-day). Accuracy was tested by mean percentage recoveries of three determinations of insulin at three different concentrations precisely prepared, and by determination of the relative standard deviation (RSD). Specificity was determined by comparing blank chitosan nanoparticulate carrier samples and the supernatant of blank chitosan nanoparticulate carrier samples with and without insulin, where the latter was referred to as an empty system.
Application of the method
Chitosan/tripolyphosphate (CS/TPP) nanoparticles were prepared by the ionotropic gelation of CS with a counter-anion TPP, in which the positively charged amino groups of CS interact with the negatively charged TPP (CitationCalvo et al., 1997). Nanoparticles were formed spontaneously when 2.6 mL TPP solution (1.0 mg/mL in purified water) was mixed with 2 mL insulin solution (0.5 mg/mL in 0.01 M HCl) and 4 mL CS solution (1.5 mg/mL in 1% acetic acid solution), pre-mixed and stirred at room temperature. Nanoparticles were isolated by centrifugation (15,000 r/min). Association efficiency (AE) and loading capacity (LC) of insulin to nanoparticulate carriers were obtained according to the following equations:
All insulin determinations were made in triplicate.
To establish the insulin release profile from nanoparticles at simulated gastric and intestinal pH, nanoparticles were placed into test tubes containing 1.5 mL of pH 1.2 and pH 7.4 PBS at 37°C, respectively. The concentrations of nanoparticles in the release medium were adjusted in order to achieve sink conditions for insulin release. At appropriate time intervals, the individual sample was centrifuged and the amount of insulin in the supernatant was measured by the improved Bradford method. All release experiments were done in triplicate and the mean values were recorded.
Results and discussion
Establishment of absorption wavelength
Interference and absorbance of supernatant of blank chitosan nanoparticles and in vitro release solution of chitosan nanoparticles in pH 7.4 PBS
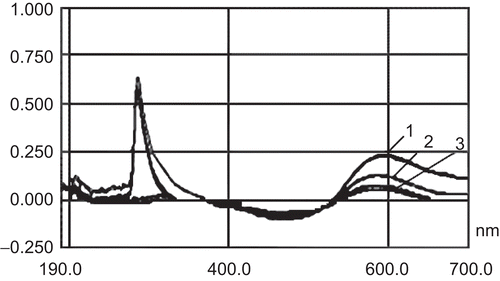
The absorbance of the supernatant of different prescription blank chitosan nanoparticles had a notable interference at 595 nm, but the absorbance of the in vitro release solution of chitosan nanoparticles in pH 7.4 PBS showed no interference at 595 nm ().
Interference elimination of supernatant of different prescription blank chitosan nanoparticles after adjustment of pH to 7–9
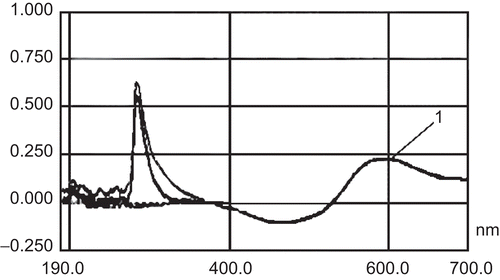
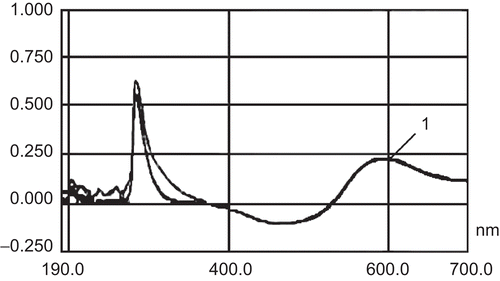
As shows, the supernatant of different prescription blank chitosan nanoparticles and chitosan solutions after adjustment of the pH to 7–9 eliminated the interference in determination of insulin at 595 nm.
Establishment of absorption wavelength
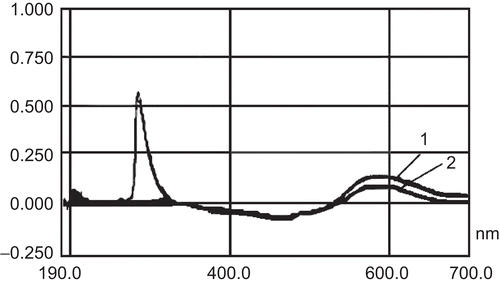
The supernatant of blank chitosan nanoparticles after adjustment of the pH to 7–9, and the in vitro release solution of chitosan nanoparticles in pH 7.4 PBS, in comparison with determination of the absorption of insulin solution at 595 nm, showed no interference with the insulin absorption wavelength at 595 nm (). Since blank chitosan nanoparticles and chitosan nanoparticles with insulin contained free chitosan, the free chitosan had a notable interference at 595 nm (). The pH of the supernatant of blank chitosan nanoparticles was adjusted to 7–9 through adding saturated NaOH. The precipitation (free chitosan) in the solution was separated by centrifuging for about 10 min (4000 r/min), so the interference of chitosan was eliminated.
Interference by other components
As mentioned above, there was some interference in the assay system by strongly alkaline buffering agents. 1% Poloxamer 127, 1% mannitol, sodium acetate, NaCl, pH 7.4 PBS, and TPP had no interference with Coomassie Brilliant Blue G-250 dye reagent at 595 nm. However, in the presence of 1% Tween 80 (CitationAmidi et al., 2006), chitosan solution showed interference with Coomassie Brilliant Blue G-250 dye reagent at 595 nm ().
Stability research of absorbance and concentration
and show the rate of formation of the protein–dye complex in the assay system and the stability of the color complex. The absorbance and concentration were monitored at 3 min and then at 2–3 min intervals for a period of 15 min. As seen from and , the color development was essentially complete at 3 min; the absorption values and concentrations of insulin solution were very unstable between 3 and 15 min, with relative standard deviation (RSD) values of approximately 4.4 and 6.5% for this period, respectively. Since the protein–dye complex had a tendency to aggregate with time, there was a decrease in color after this period of time simply by physical removal of the protein–dye complex from the solution after 20 min (CitationBradford, 1976). The assay’s specificity for arginine residues is a probable cause of variability in response between proteins, and reagents affecting the dye equilibria can cause interference (CitationCompton & Jones, 1985). Hence, very precise determinations were required, and we took care to read the absorbance of samples during one of the flatter portions of the color stability curve between 10 and 15 min after reagent addition. This still gave ample time to read a relatively large number of samples.
Table 1. Absorbance changes at different times and relative standard deviation (RSD) of different time regions.
Table 2. Concentration changes at different times and RSD of different time regions.
Method validation
Linearity
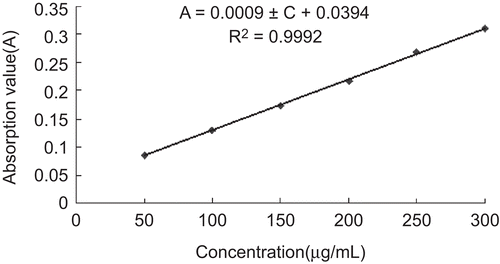
Calibration curves for insulin standard solutions of different concentrations ranging from 50 to 300 μg/mL at concentrations of 50, 100, 150, 200, 250, and 300 μg/mL were prepared in pH 7.4 PBS. A primary stock solution was accurately prepared followed by rigorous dilution to give secondary standard solutions. Each sample was analyzed three times. Good linearity was obtained (). The relationship between the calibration curve and regression coefficient is as follows:
A = 0.0009C + 0.0394
Correlation coefficient (R2) = 0.9992 (n = 18)
The value of R2 obtained was higher than 0.999, as is frequently recommended, indicating good linearity in the proposed range.
Precision
Precision of the assay was determined by analyzing the samples at three different concentrations. For assessment of the intra-day variation, samples were analyzed on 5 different days, and for the inter-day variation they were analyzed five times (n = 5) in the same day, at hourly intervals. As depicted in and , the intra-day RSD was 2.50, 3.10, and 1.25% at 100, 200, and 300 μg/mL, respectively. Inter-day RSD was 2.37, 1.50, and 1.83%, for the same concentrations of standard solutions. These results indicated good precision of the analytical method.
Table 3. Results of intra-day precision tests for determination of insulin in standard solutions.
Table 4. Results of inter-day precision tests for determination of insulin in standard solutions.
Accuracy
The accuracy characterizes the proximity between the obtained experimental results and theoretical data, and was assessed by determination of the percentage recovery of a known amount of insulin. Three different standard solutions of 100, 200, and 300 μg/mL were precisely prepared as described above, and mean recoveries of 96.47 ± 2.52%, 100.27 ± 1.86%, and 95.57 ± 0.31% were found in blank chitosan nanoparticulate carrier samples, and mean recoveries of 99.93 ± 3.21%, 98.30 ± 3.35%, and 98.86 ± 2.78% were found in the supernatant of blank chitosan nanoparticulate carrier samples. These results showed agreement between the obtained experimental values and theoretical values. Thus, it can be emphasized that this method was accurate. and list the obtained recoveries from the different standard solutions.
Table 5. Results of recovery and RSD for insulin from standard solutions in blank chitosan nanoparticles (n = 3).
Table 6. Results of recovery and RSD for insulin from standard solutions in supernatant of blank chitosan nanoparticles (n = 3).
Specificity
The specificity of the method was verified by analyzing potential interfering peaks of the formulation components with insulin absorbance at 595 nm. Empty nanoparticles, i.e. those consisting only of chitosan, were also prepared, and further centrifuged to obtain the supernatant. Two determinations of each solution, i.e. chitosan solution and supernatant, were performed in the same conditions as previously described for insulin detection. The main purpose was to detect any absorbance at 595 nm due to any isolated polymer or combination of them. After adjustment of the pH of the chitosan solution and supernatant to 7–9, no interfering peaks were observed at 595 nm (). Therefore, this method was found to be specific.
Robustness
The evaluation of robustness was based on the recovery and RSD values obtained using insulin standard solutions of different pH (). This method had the advantage of predicting the application of the method not only for small variations of the pH adjusted to 7–9 during the production of nanoparticulates (), but also for insulin release under simulated gastric and intestinal conditions. Insulin standard solutions (100 μg/mL) prepared with pH 1.2 and pH 7.4 PBS were tested, and values were evaluated in terms of recovery (%) and RSD. The low values of RSD (2.31 and 1.75%) and high values of recovery (98.54 and 100.23%) indicated that this analytical procedure was robust with respect to sample pH, and allows its use for further insulin determinations from the same nanoparticulate systems. For assessment of the intra-day variation, chitosan nanoparticles with insulin (200 μg/mL) were analyzed on 6 different days at a temperature of 4°C. The RSD value of the chitosan nanoparticles with insulin was very low (1.67%), indicating that the chitosan nanoparticles with insulin were very stable.
Table 7. Robustness of proposed method in terms of recovery and RSD for 100 μg/mL insulin standard solutions at different pH (n = 3).
Application of the method
The improved rapid and economic Bradford method was applied to study insulin association with nanoparticulate carriers produced by ionotropic gelation of the chitosan polycation. The carriers were prepared in a 1% acetic acid solution environment, and the supernatant of chitosan nanoparticles containing insulin was adjusted to pH 7–9 through saturated NaOH and further centrifuged for their isolation in order to determine indirectly the insulin association efficiency (AE) that remained in the supernatant after the formation of nanoparticulate carriers. Previous experiments were done to establish the ideal formulation and to characterize those nanoparticulates. An insulin-loaded chitosan nanoparticulate AE of 66.31 ± 1.79% and a loading capacity (LC) of 10.31 ± 1.52% were found (n = 3). The average size of insulin-loaded chitosan nanoparticles was 292 nm.
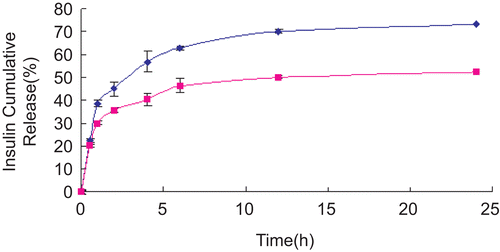
A representative insulin release–time profile from nanoparticles under gastric and intestinal pH-simulated conditions is illustrated in , as a suitable application of this method. The profile of drug release from nanoparticles can be affected by the method of preparation and also by ionic interaction between the drug and added auxiliary ingredients. If the drug is loaded by the incorporation method, the system has a relatively small burst effect and then sustained release characteristics. When the drug is involved in an interaction with auxiliary ingredients to form a less water-soluble complex, then the drug release can be very slow, with almost no burst effect. The release results showed good incorporation of insulin in polymers with ionic interaction between the insulin and polymers. Insulin release was characterized by no burst effect, in both media, at 0.5 h (<40%). The preliminary insulin release test from chitosan nanoparticles in vitro proved that they had a sustained release form, as shown in . Ionic strength in the release medium may affect significantly the release properties of chitosan nanoparticles based on ionic gelation. The in vitro insulin release profiles obtained for each formulation showed a three-phase composition (CitationLamprecht et al., 2000):
A first initial burst release of 20.51–45.02% (in 2 h), due to drug desorption from the particle surface.
A plateau for the following 12 h, resulting from only diffusion of the drug dispersed in the polymer matrix.
A constant, sustained release of the drug, resulting from diffusion of the insulin through the polymer wall as well as its erosion.
Conclusion
This study has described a new improved, rapid, validated, and economic Bradford method for insulin determination. All parameters are within the limits proposed by the guidelines for pharmaceutical formulations, indicating that this method is specific, precise, accurate, and robust, with low detection and quantification limits. Furthermore, suitable application for insulin in vitro analysis can be assumed during formulation development and characterization. The proposed method can be used to predict the association efficiency and the release profile of insulin from nanoparticulate carriers composed of contrary-charged polysaccharides. Insulin entrapment is essentially by reversible ionic interactions, which permits an absence of interaction of polymers on protein determination in the different steps of formulation development.
Acknowledgements
The authors thank the staff of the Central Laboratory and College of Life Science and Biopharmacology, Guangdong Pharmaceutical University, who provided much of the equipment and guidance for the experiments.
Declaration of interest
The authors report no conflicts of interest. The authors alone are responsible for the content and writing of the paper.
References
- Amidi M, Romeijn SG, Borchard G, Junginger HE, Hennink WE, Jiskoot W (2006): Preparation and characterization of protein-loaded N-trimethyl chitosan nanoparticles as nasal delivery system. J Control Release 111: 107–116.
- Azeredo LC, Azeredo MAA, Souza SR, Dutra VML (2003): Protein contents and physicochemical properties in honey samples of Apis mellifera of different floral origins. Food Chem 80: 249–254.
- Bhumkar DR, Joshi HM, Sastry M, Pokharkar VB (2007): Chitosan reduced gold nanoparticles as novel carriers for transmucosal delivery of insulin. Pharm Res 24: 1415–1426.
- Bradford MM (1976): A rapid and sensitive method for the quantitation of microgram quantities of protein utilizing the principle of protein-dye binding. Anal Biochem 72: 248–254.
- Calvo P, Remunan-Lopez C, Vila-Jato JL, Alonso MJ (1997): Novel hydrophilic chitosan-polyethylene oxide nanoparticles as protein carriers. J Appl Polym Sci 63: 125–132.
- Compton SJ, Jones CG (1985): Mechanism of dye response and interference in the Bradford protein assay. Anal Biochem 151: 369–374.
- Criquet S, Farnet AM, Ferre E (2002): Protein measurement in forest litter. Biol Fertil Soils 35: 307–313.
- Cui FD, Shi K, Zhang LQ, Tao AJ, Kawashima Y (2006): Biodegradable nanoparticles loaded with insulin-phospholipid complex for oral delivery: preparation, in vitro characterization and in vivo evaluation. J Control Release 114: 242–250.
- Dyer AM, Hinchcliffe M, Watts P, Castile J, Jabbal-Gill I, Nankervis R, Smith A, Illum L (2002): Nasal delivery of insulin using novel chitosan based formulations: a comparative study in two animal models between simple chitosan formulations and chitosan nanoparticles. Pharm Res 19: 998–908.
- Fan YF, Wang YN, Fan YG, Ma JB (2006): Preparation of insulin nanoparticles and their encapsulation with biodegradable polyelectrolytes via the layer-by-layer adsorption. Int J Pharm 324: 158–167.
- Fernández-Urrusuno R, Calvo P, Remunan-Lopez C, Vila-Jato JL, Alonso MJ (1999): Enhancement of nasal absorption of insulin using chitosan nanoparticles. Pharm Res 16: 1576–1581.
- Funding M, Vorum H, Honore B, Nexo E, Ehlers N (2005): Proteomic analysis of aqueous humour from patients with acute corneal rejection. Acta Ophthalmol Scand 83: 31–39.
- Harner MJ, Ramsey PW, Rilling MC (2004): Protein accumulation and distribution in floodplain soils and river foam. Ecol Lett 7: 829–836.
- Joshi HM, Bhumkar DR, Joshi K, Pokharkar VB, Sastry M (2006): Gold nanoparticles as carriers for efficient transmucosal insulin delivery. Langmuir 22: 300–305.
- Kamizake NKK, Goncalves MM, Zaia CTBV, Zaia DAM (2003): Determination of total proteins in cow milk powder samples: a comparative study between the Kjeldahl method and spectrophotometric methods. J Food Comp Anal 16: 507–516.
- Krauland AH, Guggi D, Bernkop-Schnurch A (2004). Oral insulin delivery: the potential of thiolated chitosan-insulin tablets on non-diabetic rats. J Control Release 95: 547–555.
- Lamprecht A, Ubrich N, Perez MH, Lehr CM, Hoffman M, Maincent P (2000): Influence of process parameters on nanoparticles preparation performed by a double emulsion pressure homogenization technique. Int J Pharm 196: 177–182.
- Luangtana-anan M, Opanasopit P, Ngawhirunpat T, Nunthanid J, Sriamornsak P, Limmatvapirat S (2005): Effect of chitosan salts and molecular weight on a nanoparticulate carrier for therapeutic protein. Pharm Dev Technol 10: 189–196.
- Martins S, Sarmento B, Souto EB, Ferreira DC (2007): Insulin-loaded alginate microspheres for oral delivery–effect of polysaccharide reinforcement on physicochemical properties and release profile. Carbohydr Polym 69: 725–731.
- Qi LF, Xu ZR, Chen M (2007): In vitro and in vivo suppression of hepatocellular carcinoma growth by chitosan nanoparticles. Eur J Cancer 43: 184–193.
- Sadeghi AMM, Dorkoosh FA, Avadi MR, Saadat P, Rafiee-Tehrani M, Junginger HE (2008): Preparation, characterization and antibacterial activities of chitosan, N-trimethyl chitosan (TMC) and N-diethylmethyl chitosan (DEMC) nanoparticles loaded with insulin using both the ionotropic gelation and polyelectrolyte complexation methods. Int J Pharm 355: 299–206.
- Sajeesh S, Sharma CP (2006): Cyclodextrin-insulin complex encapsulated polymethacrylic acid based nanoparticles for oral insulin delivery. Int J Pharm 325: 147–154.
- Silva CM, Ribeiro AJ, Figueiredo IV, Goncalves AR, Veiga F (2006): Alginate microspheres prepared by internal gelation: development and effect on insulin stability. Int J Pharm 311: 1–10.
- Ubaidulla U, Khar RK, Ahmed FJ, Panda AK (2007): Development and in-vivo evaluation of insulin-loaded chitosan phthalate microspheres for oral delivery. J Pharm Pharmacol 59: 1345–1351.
- US Food and Drug Administration (1996): Guidance for industry: Q2B validation of analytical procedures: Methodology. Rockville, MD, USFDA.
- Xu YM, Du YM (2003): Effect of molecular structure of chitosan on protein delivery properties of chitosan nanoparticles. Int J Pharm 250: 215–226.
- Wang LY, Ma GH, Su ZG (2005): Preparation of uniform sized chitosan microspheres by membrane emulsification technique and application as a carrier of protein drug. J Control Release 106: 62–75.
- Zhang XG, Zhang HJ, Wu ZM, Wang Z, Niu HM, Li CX (2007): Nasal absorption enhancement of insulin using PEG-grafted chitosan nanoparticles. Eur J Pharm Biopharm 68: 526–534.
