Abstract
Context: Angiotensin-converting enzyme (ACE) is one of the main regulators of blood pressure through its action on the renin-angiotensin system. ACE inhibitory peptides from natural materials inhibit ACE activity and have considerable importance as antihypertensive agents.
Objective: A new chromogenic reaction method for determining hippuric acid (HA) and angiotensin I-converting enzyme (ACE) inhibitor activity was developed.
Materials and methods: This method is based on the reaction of HA with p-dimethylaminobenzaldehyde in the presence of quinoline, acetate, and acetic anhydride. The red–orange formation product in the reaction has a stable absorbance in the visible region and it was determined at 478 nm. The assay conditions were optimized and by using an ACE concentration of 12 mU/mL in enzymatic reaction, the method was applied to monitor the IC50 values (the concentration of inhibitor required to inhibit 50% of the ACE activity) for captopril and Saurida elongata (Synodontidae) muscle protein hydrolyzate.
Results: With the proposed method, IC50 values for captopril and Saurida elongata muscle protein hydrolyzate were determined as 0.0123 µM and 0.1648 mg/mL, respectively. Those results correspond to the IC50 values of 0.0109 µM and 0.1820 mg/mL obtained by high-performance liquid chromatography (HPLC) method.
Discussion and conclusion: The proposed method is rapid, accurate, reproducible and convenient, and suitable for screening ACE inhibitor peptides from food materials while it does not require HA extraction from the components of the ACE activity assay reaction.
Introduction
Angiotensin-converting enzyme [(ACE), EC 3.4.15.1] is one of the main regulators of blood pressure through its action on the renin-angiotensin system. ACE increases blood pressure by converting angiotensin I into the potent vasoconstrictor angiotensin II and catalyzing the degradation of the potent vasodilator bradykinin (CitationTom et al., 2003). ACE inhibitory peptides from natural materials inhibit ACE activity and have considerable importance as antihypertensive agents. Recently, efficient ACE inhibitory peptides have been found from many food proteins, such as milk, animal, and plant proteins (CitationByun & Kim, 2001; CitationLacaille-Dubois et al., 2001; CitationQian et al., 2007; CitationPihlanto et al., 2010), and have been shown to lower the blood pressure of animals and humans (CitationKawasaki et al., 2000; CitationSuetsuna et al., 2004).
A rapid and simple in vitro ACE inhibition assay for screening potential antihypertensive peptides derived from food proteins remains desirable. Several methods for ACE activity analysis have been developed, including spectrophotometric (Cushma & Cheung, 1971), fluorometric (CitationSentandreu & Toldrárapid, 2006), radiochemical (CitationRyan et al., 1977), high-performance liquid chromatography (HPLC) (CitationMehanna & Dowling, 1999; CitationLahogue et al., 2010), capillary electrophoresis (CitationVan Dyck et al., 2003), and mass spectrometric methods (CitationElased et al., 2005; CitationXiao et al., 2006). Among them, the spectrophotometric and liquid chromatography methods are the most commonly used. Different substrates have been employed to measure ACE activity, such as hippuryl-l-histidyl-l-leucine (HHL) (Cushma & Cheung, 1971; Platerink et al., 2007), o-aminobenzoylglycyl-p-nitrophenylalanylproline (CitationMiguel & Fidel, 2007), furanacryloyl-l-phenylalanylglycyl-glycine (CitationShalaby et al., 2006) and 3-hydroxybutyryl-glycyl-glycyl-glycine (Lam et al., 2007). The spectrophotometric method used by CitationCushman and Cheung (1971) was based on the hydrolysis of HHL by ACE to hippuric acid (HA) and histidine (His)-Leu (HL), and the quantity of HA formed from HHL was extracted with ethyl acetate and determined by spectrophotometric assay. However, extraction of HA is tedious, and ACE activity may be overestimated because unhydrolyzed HHL is also extracted.
Two chromogenic reaction methods for the determination of HA have been developed, which are based on the deep red color from the reaction of HA with benzenesulfonyl chloride in the presence of pyridine (CitationUmberger & Fiorese, 1963) and the deep orange azlactone, 2-phenyl-4-(p-dimethylamino)benzal-5-oxazolone, resulting from the reaction of HA with p-dimethylaminobenzaldehyde (DAB) in the presence of acetic anhydride (Gaffeney et al., 1954). The method based on DAB was employed by Filipović to determine ACE inhibitory activity, but the chromogenic reaction was performed at high temperature (120°C) (Filipović et al., 1978). Using pyridine as organic base to catalyze the reaction of HA with DAB, CitationOhmori et al. (1977) improved the DAB method which was used to determine ACE activity by Filipović et al. (1983). However, HA extraction with ethyl acetate using this method is also necessary.
In the present study, a spectrophotometric method was developed for the determination of HA, based on the condensation of DAB and HA with quinoline (QL) and acetate in the presence of acetic anhydride. Furthermore, based on the principle of determining HA formation from HHL through the action of ACE, this method was applied to determining the antihypertensive activity of captopril and fish hydrolyzate without the extraction of HA from the ACE reaction mixture. The proposed method is simple, rapid, sensitive, reproducible, and convenient, without the extraction of HA from the ACE reaction mixture, which can have wide application in the field of ACE inhibitor screening from food proteins.
Materials and methods
Chemicals and fish material
HA, ACE (from rabbit lung; 2.0 units/mg of protein), HHL, and captopril were purchased from the Sigma Chemical Company (USA). QL was purchased from the Chengdu Kelong Chemical Reagent Factory (Batch No. 20100608, China). DAB was purchased from the Guangdong Guanghua Sci-Tech Company, Ltd. (Batch No. 20100713, China). All the other reagents used were of analytical grade. Neutral protease (with a declared activity of 400,000 U/g) was kindly provided by Nanning Pangbo Biological Engineering Company, Ltd. (China). Acetic anhydride was of analytical grade and a few crystals of sodium acetate before use were added.
The amino acid mixtures (MAAs) were purchased from Sigma Chemical Company (U.S.) and consisted of 1 g each of the following standards: Met, Trp, Val, Phe, Ile, Leu, Asp, His, Gly, Thr, Tyr, Glu, Asn, Ser, Gln, Arg, Lys and Ala.
Saurida elongata (Synodontidae) was purchased from a local market in Nanning (China). The sample was kindly identified by Cui Can, marine engineer of the Guangxi Institute of Oceanology (China), and by comparison with the published fish description (CitationChina Fisheries Magazine, 2001). The Saurida elongata muscle was rapidly separated and stored at –20°C until use.
Instruments
A Shimadzu UV-2501PC spectrophotometer was used for recording absorption spectra and measuring the absorbance at 478 nm.
Preparation of reagents
The borate buffer (pH 8.3) contained 0.1 M borate and 0.3 M NaCl.
A stock standard solution of HA was prepared by dissolving HA in borate buffer to a concentration of 250 µg/mL. The triethanolamine acetate (TEAA) reagent was prepared by mixing 1 mL of acetic acid and 3 mL of triethylamine and adjusted pH to 6.0–7.0 with triethylamine.
The 2.5% DAB-QL solution was prepared as follows: 50.0 mg of DAB was placed in a 10 mL cuvette with stopple, and 50 µL of TEAA reagent was added; QL was then added to give a final volume 2.0 mL. After brief mixing, the solution was incubated at 60°C for 60 min and then cooled to room temperature with a water bath. The DAB-QL solution should be freshly prepared and used within 2 h.
Absorption spectra
About 1.0 mg of MAAs and 100 µL of borate buffer were placed in a 10 mL cuvette with stopple. Subsequently, 2 mL of 2.5% DAB-QL solution was added to the cuvette followed by mixing on a vortexing mixer for 30 s, and 0.2 mL of acetic anhydride was added to the mixture. After thorough mixing for 30 s, the mixture was allowed to stand for 30 min at room temperature in the darkness and diluted with ethanol to 5 mL. Then, 100 µL of HA stock standard solution was placed in another cuvette and treated in the same way. Another reaction containing 100 µL of borate buffer, 2 mL of 2.5% DAB-QL solution, and 0.2 mL of acetic anhydride was used as the blank reagent.
The spectrum was recorded from 400 to 600 nm against distilled water.
Effect of incubation time of DAB-QL solution
The 2.5% DAB-QL solution was prepared according to the procedure described in “Preparation of Reagents”, but the DAB-QL solution was incubated at 60°C for different time.
For each assay, a 100 µL of HA stock standard solution was placed in a 10 mL cuvette with stopple. The chromogenic reaction of the HA standard solution was performed using the procedure described in Section “Absorption Spectra” and the absorbance was determined at 478 nm against the reagent blank.
Effect of TEAA reagent amount
To study the effect of the amount of TEAA reagent on color development, 2.5% DAB-QL solution containing different amounts of TEAA reagent was prepared according to the procedure described in “Preparation of Reagents”.
For each assay, 100 µL of HA stock standard solution was placed in a 10 mL cuvette with stopple. The chromogenic reaction of the HA standard solution was performed using the procedure described in Section “Absorption Spectra”, and the absorbance was determined at 478 nm against the blank reagent.
Chromogenic reaction under varying ratios of DAB-QL solution and acetic anhydride
In a total volume of 2.3 mL solution with 50 mg DAB, the color that developed in the presence of different ratios of DAB-QL solution to acetic anhydride were studied.
The DAB-QL solution was prepared as follows: 50 mg of DAB was placed in a 10 mL cuvette with stopple, and a 50 µL of TEAA reagent was added. Then, different amounts of QL (according to the ratios of DAB-QL solution to acetic anhydride) were added. After brief mixing, the solution was incubated at 60°C for 60 min and then cooled to room temperature in a water bath.
For each assay, 100 µL of HA stock standard solution was placed in a 10 mL cuvette with stopple. The chromogenic reaction of the HA standard solution was performed using the procedure described in Section “Absorption Spectra”, and the absorbance was determined at 478 nm against the reagent blank.
Effect of the concentration of DAB on color development
To study the effect of different concentrations of DAB on color development, the DAB-QL solution was prepared according to the procedure described in “Preparation of Reagents”, except for different amounts of DAB in the DAB-QL solution.
For each assay, a 100 µL of HA stock standard solution was placed in a 10 mL cuvette with stopple. The chromogenic reaction of the HA standard solution was performed using the procedure described in Section “Absorption Spectra”, and the absorbance was determined at 478 nm against the blank reagent.
Time course of color development at room temperature
A 2.5% DAB-QL solution was prepared according to the procedure described in “Preparation of Reagents”.
For each assay, a 100 µL of HA stock standard solution was placed in a 10 mL cuvette with stopple. The chromogenic reaction of the HA standard solution was performed using the procedure described in Section “Absorption Spectra”, except that the mixture was allowed to stand in the dark for different time at room temperature before being diluted with ethanol to 5 mL. The absorbance was determined at 478 nm against the blank reagent.
Effect of water on color development
A 2.5% DAB-QL solution was prepared according to the procedure described in “Preparation of Reagents”.
To study the effect of water on the chromogenic reaction under standard conditions, varying amounts of water were added to each reaction mixture, which contained a constant 25 µg of HA. The chromogenic reaction of the HA solution was performed using the procedure described in Section “Absorption Spectra”, and the absorbance was determined at 478 nm against the blank reagent.
Calibration of HA concentration and precision
A 2.5% DAB-QL solution was prepared according to the procedure described in “Preparation of Reagents”.
A series of working standards was prepared by diluting the stock standard solution with the same borate buffer over the range 25–250 µg/mL, and 100 µL of each working standard was taken for analysis. The working standards at five different concentrations were used to determine assay precision. The chromogenic reaction of the HA solution was performed using the procedure described in Section “Absorption Spectra”, and the absorbance was determined at 478 nm against the reagent blank.
ACE inhibition measurement
A 2.5% DAB-QL solution was prepared according to the procedure described in “Preparation of Reagents”.
Saurida elongata muscle protein was hydrolyzed with neutral protease, with the substrate-enzyme ratio adjusted to 50:1 (w/w) at 50°C for 2 h (pH 7.0). The reaction was terminated by deactivating the enzyme at 95°C in a water bath for 10 min. Then, the hydrolyzate was centrifuged at 8,000 rpm for 20 min at 4°C, and the supernates were used to measure ACE inhibitor activity.
The procedures for the ACE inhibitor assay are summarized in . For each assay, a sample solution (20 µL of borate buffer or 20 µL of ACE inhibitor) with 30 µL of ACE solution (0.04 U/mL in borate buffer) was pre-incubated for 10 min at 37°C, and the mixture was incubated with 50 µL of substrate (5 mM HHL in borate buffer) for 60 min at the same temperature. The enzymatic reaction was terminated by immersing the test tubes in a 95°C water bath for 10 min and then adding 2 mL of 2.5% DAB-QL solution. After mixing for 30 s, 0.2 mL of acetic anhydride was added to the mixture and mixed for 30 s. The mixture was allowed to stand for 30 min at room temperature in the darkness and diluted with ethanol to 5 mL. The absorbance was then determined at 478 nm against the blank reagent as described in Section “Absorption Spectra”. Moreover, the spectra of the control (A) and the blank (B) compared with the blank reagent described in Section “Absorption Spectra” were recorded from 400 to 600 nm.
Table 1. ACE inhibitory assay procedures.
The inhibitory ratios are calculated by the following equation:
Where IP is the inhibitory ratio, Aa is the absorbance of control (buffer added instead of test sample), Ab is the absorbance of the reaction blank (ACE was boiled for 10 min to deactivate the enzyme before the ACE inhibitor was added), and Ac is the absorbance in the presence of the sample (ACE inhibitor).
To confirm the capability of the current assay for screening ACE inhibitors, the ACE inhibitor activity of captopril and Saurida elongata hydrolyzate was measured in terms of their IC50 values using the current and the HPLC methods (CitationWang et al., 2008). IC50, the inhibitor concentration needed to inhibit 50% of the ACE activity, was determined by regression analysis of ACE inhibition (%) versus the log of inhibitor concentration.
Results
Absorption spectra
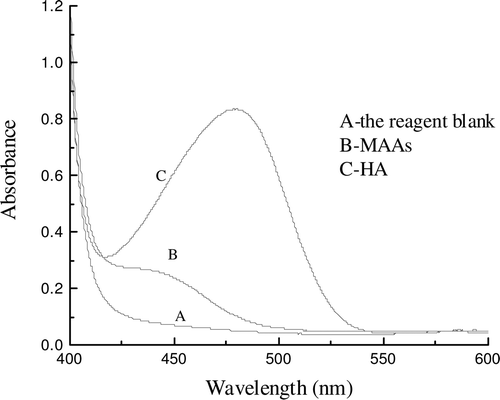
As shown in , no orange color (478 nm) was obtained when the MAAs were treated with DAB-QL solution in the presence of acetic anhydride, but a weak absorption peak at 454 nm was observed. An orange-colored mixture was obtained from the chromogenic reaction of HA with DAB-QL solution and acetic anhydride and had absorbance in the visible region (λmax = 478 nm). These results suggest that the method could be used to determine HA in the presence of amino acids. The absorption at 478 nm of the blank reagent against distilled water was negligible. To eliminate instances of the blank reagent, the absorbance of the sample at 478 nm should be determined against the blank reagent.
Figure 1. Absorption spectra of solutions were prepared according to the procedure described in “Materials and methods”. Line A represents the absorption spectra of the reagent blank. Line B represents the absorption spectra of the mixture of amino acids reacted with DAB-QL solution and acetic anhydride. Line C represents the absorption spectra of the mixture of HA reacted with DAB-QL solution and acetic anhydride.
Effect of incubation time of DAB-QL solution
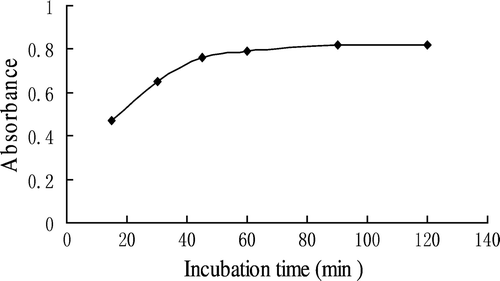
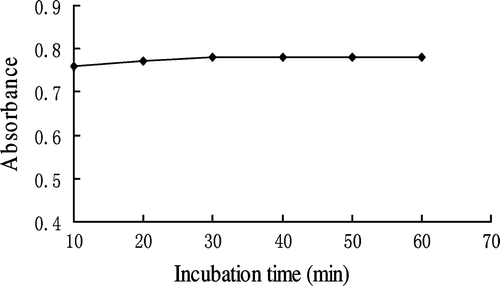
As shown in , the absorbance of the reaction mixture of HA, DAB-QL solution, and acetic anhydride increased with incubation time up to 60 min and then tapered off. Thus, the incubation of the DAB-QL solution in the said experiments took 60 min.
Effect of TEAA reagent amount
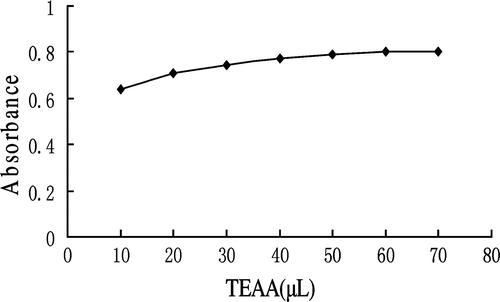
The effect of TEAA amount on color development was studied. As shown in , the absorbance of the reaction mixture increased with the amount of TEAA, and the absorbance reached a plateau at 50 µL. A final amount of 50 µL TEAA was hence chosen.
Absorbance under varying ratios of DAB-QL solution to acetic anhydride
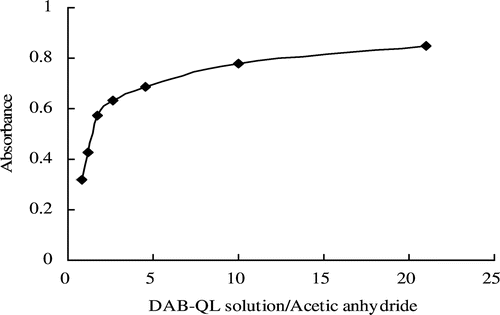
In a total volume of 2.3 mL with constant amounts of DAB and HA, the color developed in the presence of different ratios of DAB-QL solution to acetic anhydride. As shown in , the DAB-QL solution caused a dose-dependent increase in the intensity of the HA chromogenic reaction. The absorbance at 478 nm reached a plateau with a DAB-QL solution/acetic anhydride ratio of 10. To facilitate the operation, a final ratio of 10 was used in the present experiments.
Effect of concentration of DAB on color development
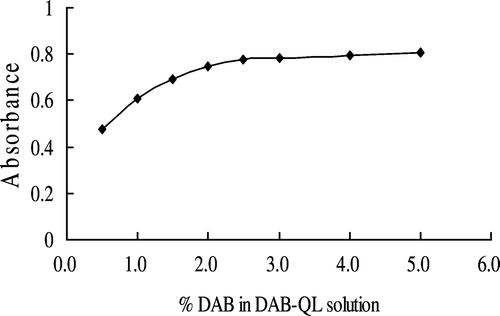
As shown in , when the DAB concentration in the DAB-QL solution was less than 2.5%, DAB caused a dose-dependent increase in intensity; however, beyond that concentration, the intensity reached a plateau. A final concentration of 2.5% DAB was used in the subsequent experiments.
Time course of color development at room temperature
As shown in , the maximum absorbance was obtained with an incubation time of 30 min at room temperature.
Influence of water on color development
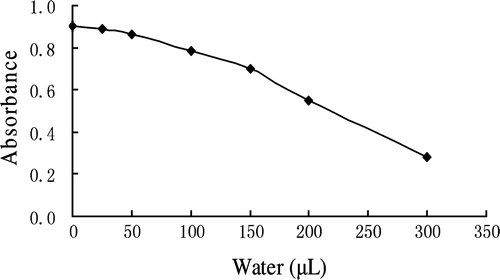
The color developed under similar conditions with different amounts of water added to the reaction mixture (HA, DAB-QL solution, and acetic anhydride). As shown in , 50 µL of water did not significantly influence color development; however, color development decreased sharply when more than 150 µL of water was added to the reaction mixture.
Calibration curve, precision, and reproducibility
Under the assay conditions, a linear correlation between HA concentration and its absorbance at 478 nm was obtained. The regression equation was calculated using the equation A = 0.1548C + 0.0062, with a correlation coefficient of 0.9998 (n = 3), within HA concentrations ranging from 2.5 to 25 µg in 5 mL solution (0.5–5.0 µg/mL).
The relative standard deviation (RSD) of the six replicates of the assay ranged from 1.08% to 6.51%. The detection limit of this method was 0.507 µM, which is expressed as 3.3 d/s, where d is the standard deviation of the blank and s is the slope of the regression line. The color was stable in the dark for at least 6 h. These results show that the assay has excellent precision, accuracy, and reproducibility.
IC50 of captopril and Saurida elongata hydrolyzate
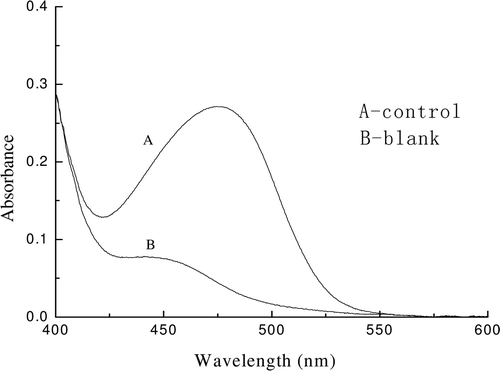
As shown in , the blank (B) has negligible absorption at 478 nm. The presence of ACE, ACE inhibitor, HHL, and HL did not interfere with the reaction of HA with the DAB-QL solution and acetic anhydride.
Figure 8. Absorption spectra of chromogenic reaction solutions in ACE inhibitory activity assay. A control solution and a blank solution in ACE inhibitory activity assay were allowed to react with 2.0 mL of 2.5% DAB-QL solution and 0.2 mL of acetic anhydride at room temperature.
As shown in , the IC50 of captopril obtained using the current method was 0.0123 µM, which is similar to the 0.01093 µM obtained using the HPLC method, and associated with literature where a value of 0.00891 µM was reported by CitationVermeirssen et al. (2002). The IC50 of captopril and Saurida elongata protein hydrolyzate obtained using the two methods are similar, which confirms that the method proposed here is reliable.
Table 2. Comparison of the results obtained by the current and HPLC methods.
Discussion
Several colorimetric methods for quantifying ACE-catalyzed reactions were developed for screening ACE inhibitors. The extraction-free colorimetric method using 2,4,6-trinitrobenzene sulfonate (CitationMatsui et al., 1992) is simpler, but the specificity of HL is insufficient for a complicated sample such as a mixture of peptides. By using the chromogenic reaction method developed by CitationUmberger and Fiorese (1963), an extraction-free colorimetric assay for screening ACE inhibitors, with a detection limit of 0.146 µM HA, was developed by CitationJimsheena et al. (2009), however, cooling the mixture of reaction on ice is necessary. Furthermore, a new chromogenic reaction method was developed by CitationLi et al. (2005), which is based on the specific colorimetric reaction of HA with benzene sulfonyl chloride in the presence of QL. In present study, a new chromogenic reaction method for HA was developed and its detection limit was 0.507 µM, which is similar to the value reported by CitationJimsheena et al. (2009) and far superior to that determined using the method developed by CitationLi et al. (2005). The RSD of this method was found to be less than 6.51%, which indicates that the method is precise. It was previously reported that the RSD values is less than 5.46% (CitationLi et al., 2005) and 1% (CitationJimsheena et al., 2009), respectively. Those results show that the precision of this method was lower than that of CitationJimsheena et al. (2009) but similar to that of CitationLi et al. (2005). The method proposed here will provide another new method for determining HA and ACE inhibitor activity.
Conclusion
An accurate, rapid and extraction-free method for analysing HA and the ACE inhibitory activity has been developed. This assay was successfully used to compare the ACE inhibitor activity of captopril and fish hydrolyzate. The spectrophotometric method described above is rapid, sensitive and reproducible, and is suitable for screening new ACE inhibitor peptides from food materials while it does not require HA extraction.
Declaration of interest
This work was supported by Guangxi Scientific and Technological Project (No. 0815006-1-4 and 0992025-17), Guangxi Graduate Education Innovation Fund (No. 105931001006), Guangxi Key Laboratory of Petrochemical Resources Processing & Process Intensification Technology and Guangxi Key Laboratory of Biorefinery.
References
- Byun HG, Kim SK. (2001). Purification and characterization of angiotensin I converting enzyme (ACE) inhibitory peptides from Alaska pollack (Theragra chalcogramma) skin. Process Biochem, 36, 1155–1162.
- China Fisheries Magazine. (2001). Primary Color Atlas of Chinese Economic Valuable Aquatic Products. 2nd Edition. Shanghai, China: Shanghai scientific & Technical Publishers, 21.
- Cushman DW, Cheung HS. (1971). Spectrophotometric assay and properties of the angiotensin-converting enzyme of rabbit lung. Biochem Pharmacol, 20, 1637–1648.
- Elased KM, Cool DR, Morris M. (2005). Novel mass spectrometric methods for evaluation of plasma angiotensin converting enzyme 1 and renin activity. Hypertension, 46, 953–959.
- Filipovic N, Borcic N, Igic R. (1983). A simple colorimetric method for estimating plasma angiotensin I converting enzyme activity. Clin Chim Acta, 128, 177–180.
- Filipovic N, Mijanovic M, Igic R. (1978). A simple spectrophotometric method for estimation of plasma angiotensin I converting enzyme activity. Clin Chim Acta, 88, 173–175.
- Gaffney GW, Schreier K, Diferrante N, Altman KI. (1954). The quantitative determination of hippuric acid. J Biol Chem, 206, 695–698.
- Jimsheena VK, Gowda LR. (2009). Colorimetric, high-throughput assay for screening angiotensin I-converting enzyme inhibitors. Anal Chem, 81, 9388–9394.
- Kawasaki T, Seki E, Osajima K, Yoshida M, Asada K, Matsui T, Osajima Y. (2000). Antihypertensive effect of valyl-tyrosine, a short chain peptide derived from sardine muscle hydrolyzate, on mild hypertensive subjects. J Hum Hypertens, 14, 519–523.
- Lacaille-Dubois MA, Franck U, Wagner H. (2001). Search for potential angiotensin converting enzyme (ACE)-inhibitors from plants. Phytomedicine, 8, 47–52.
- Lahogue V, Réhel K, Taupin L, Haras D, Allaume P. (2010). A HPLC-UV method for the determination of angiotensin I-converting enzyme (ACE) inhibitory activity. Food Chem, 118, 870–875.
- Li GH, Liu H, Shi YH, Le GW. (2005). Direct spectrophotometric measurement of angiotensin I-converting enzyme inhibitory activity for screening bioactive peptides. J Pharm Biomed Anal, 37, 219–224.
- Lam le H, Shimamura T, Sakaguchi K, Noguchi K, Ishiyama M, Fujimura Y, Ukeda H. (2007). Assay of angiotensin I-converting enzyme-inhibiting activity based on the detection of 3-hydroxybutyric acid. Anal Biochem, 364, 104–111.
- Matsui T, Matsufuji H, Osajima Y. (1992). Colorimetric measurement of angiotensin I-converting enzyme inhibitory activity with trinitrobenzene sulfonate. Biosci Biotechnol Biochem, 56, 517–518.
- Mehanna AS, Dowling M. (1999). Liquid chromatographic determination of hippuric acid for the evaluation of ethacrynic acid as angiotensin converting enzyme inhibitor. J Pharm Biomed Anal, 19, 967–973.
- Miguel AS, Fidel T. (2007). Evaluation of ACE inhibitory activity of dipeptides generated by the action of porcine muscle dipeptidyl peptidases. Food Chem, 102, 511–515.
- Ohmori S, Ikeda M, Kira S, Ogata M. (1977). Colorimetric determination of hippuric acid in urine and liver homogenate. Anal Chem, 49, 1494–1496.
- Pihlanto A, Virtanen T, Korhonen H. (2010). Angiotensin I-converting enzyme (ACE) inhibitory activity and antihypertensive effect of fermented milk. Int Dairy J, 20, 3–10.
- van Platerink CJ, Janssen HG, Haverkamp J. (2007). Development of an at-line method for the identification of angiotensin-I inhibiting peptides in protein hydrolysates. J Chromatogr B Analyt Technol Biomed Life Sci, 846, 147–154.
- Qian ZJ, Jung WK, Lee SH, Byun HG. (2007). Antihypertensive effect of an angiotensin I-converting enzyme inhibitory peptide from bullfrog (Rana catesbeiana Shaw) muscle protein in spontaneously hypertensive rats. Process Biochem, 42, 1443–1448.
- Ryan JW, Chung A, Ammons C, Carlton ML. (1977). A simple radioassay for angiotensin-converting enzyme. Biochem J, 167, 501–504.
- Sentandreu MA, Toldrárapid F. (2006). A rapid, simple and sensitive fluorescence method for the assay of angiotensin-I converting enzyme. Food Chem, 97, 546–554.
- Shalaby SM, Zakora M, Otte J. (2006). Performance of two commonly used angiotensin-converting enzyme inhibition assays using FA-PGG and HHL as substrates. J Dairy Res, 73, 178–186.
- Suetsuna K, Maekawa K, Chen JR. (2004). Antihypertensive effects of Undaria pinnatifida (wakame) peptide on blood pressure in spontaneously hypertensive rats. J Nutr Biochem, 15, 267–272.
- Tom B, Dendorfer A, Danser AH. (2003). Molecules in focus bradykinin, angiotensin-(1-7), and ACE inhibitors: How do they interact. Int J Biochem Cell Biol, 35, 792–801.
- Umberger CJ, Fiorese FF. (1963). Colorimetric method for hippuric acid. Clin Chem, 9, 91–96.
- Van Dyck S, Nováková S, Van Schepdael A, Hoogmartens J. (2003). Inhibition study of angiotensin converting enzyme by capillary electrophoresis after enzymatic reaction at capillary inlet. J Chromatogr A, 1013, 149–156.
- Vermeirssen V, Van Camp J, Verstraete W. (2002). Optimisation and validation of an angiotensin-converting enzyme inhibition assay for the screening of bioactive peptides. J Biochem Biophys Methods, 51, 75–87.
- Wang JP, Hu JE, Cui JZ, Bai XF, Du YG, Miyaguchi YJ, Lin BC. (2008). Purification and identification of a ACE inhibitory peptide from oyster proteins hydrolysate and the antihypertensive effect of hydrolysate in spontaneously hypertensive rats. Food Chem, 111, 302–308.
- Xiao X, Luo X, Chen B, Yao S. (2006). Determination of angiotensin converting enzyme inhibitory activity by high-performance liquid chromatography/electrospray-mass spectrometry. J Chromatogr B Analyt Technol Biomed Life Sci, 834, 48–54.
