Abstract
Context: Genistein reduces high-calorie diet-induced insulin resistance and fat accumulation in animals, but the mechanism is unresolved.
Objective: This study explores whether action of genistein is associated with p70 ribosomal S6 kinase-1 (S6K1) inhibition.
Materials and methods: Adult male mice were fed either normal diet or high-fat–high-fructose diet (HFFD) for 15 days, after which animals in each dietary group were divided into two groups and administered either genistein (1 mg kg−1 day−1, p.o.) in 0.5 ml of 30% dimethylsulfoxide (DMSO) or 30% DMSO (0.5 ml) for the next 45 days. At the end of the study, their liver was analyzed for lipid content. Semi-quantitative RT-PCR and western blotting methods were used to analyze lipid regulatory genes and insulin signaling proteins, respectively.
Results: Genistein significantly (p < 0.05) lowered HFFD-induced body and liver weight gain and plasma and hepatic lipid levels. Histology showed a 2.5-fold increase of lipid in HFFD compared to control. Genistein treatment to HFFD-fed animals significantly decreased lipid accumulation (by 40%) compared to HFFD. Insulin-stimulated tyrosine phosphorylation of insulin receptor-β and insulin receptor substrates-1 (IRS-1), IRS-1 associated phospatidylinositol-3kinase (PI3K) and Akt Ser473 phosphorylation were improved while IRS-1 serine phosphorylation was significantly (p < 0.05) decreased by genistein in HFFD. Significant (p < 0.05) increase in adenosine monophosphate-activated protein kinase (AMPK) Thr172 phosphorylation and decrease in S6K1 Thr389 phosphorylation were observed in HFFD-plus genistein compared to HFFD. Genistein downregulated lipogenic genes and upregulated fatty acid oxidative genes in HFFD-fed mice.
Conclusion: Genistein improves insulin signaling and attenuates fat accumulation in liver through S6K1 inhibition.
Introduction
Lipid overaccumulation (steatosis) within the liver has been proposed to cause obesity, insulin resistance and type 2 diabetes (T2D) (Yki-Järvinen & Westerbacka, Citation2005), and a causative link between hepatic lipid content and insulin resistance/T2D has been shown in human and animal studies (Akagiri et al., Citation2008; Rijzewijk et al., Citation2010). In rodents, high-calorie diet feeding induces insulin resistance by promoting excessive deposition of triglycerides in the adipose tissue and other nonfat storing tissues including liver. These animals form a model of insulin resistance (Akagiri et al., Citation2008).
The insulin receptor substrate-phosphatidylinositol-3 kinase-Akt (IRS-PI3K-Akt) pathway of insulin signaling is responsible for glucose uptake, lipogenesis and glycogen synthesis. Tyrosine phosphorylation of IRS-1 and 2 by insulin receptor-β (IR-β) triggers activation of p85 PI3K and a protein kinase called Akt. This facilitates glucose entry into the cells through translocation of glucose transporters (Saltiel & Kahn, Citation2001). Serine phosphorylation of IRS is a key event that prevents the ability of IRS to serve as a mediator of tyrosine kinase signal and induces insulin resistance (Liu et al., Citation2004). p70 ribosomal protein S6 kinase 1 (S6K1), an effector of mammalian target of rapamycin (mTOR), is activated in liver under the conditions of excess nutrients in obese animals (Um et al., Citation2006). Activation of S6K1 negates insulin signaling through serine phosphorylation of IRS-1 at Ser307 and Ser636/S639 Ser1101 followed by proteasomal degradation of IRS-1 (Tremblay et al., Citation2007).
Mounting evidence suggests that adenosine monophosphate-activated protein kinase (AMPK), an intracellular energy sensing molecule, is a critical regulator of hepatic glucose and lipid metabolism. Activated AMPK inhibits de novo fatty acid synthesis by inactivating liver X receptor-α (LXR-α) (Yap et al., Citation2011) and stimulates fatty acid oxidation by upregulating peroxisome proliferator-activated receptor-α (PPAR-α) (Kondo et al., Citation2009).
LXR-α, a lipid-sensing nuclear receptor transcription factor, induces fatty acid synthesis through the activation of another transcription factor and a master regulator of lipogenesis, sterol regulatory element-binding protein-1c (SREBP1c). The target genes of SREBP1c are fatty acid synthase (FAS), acetyl-CoA carboxylase (ACC) and stearoyl-CoA desaturase-1 (SCD1) which encode enzymes of triglycerides (TG) anabolic process (Shimano, Citation2000). PPAR-α, a nuclear hormone receptor, regulates the expression of genes involved in β-oxidation. Activation of PPAR-α by AMPK upregulates the genes involved in fatty acid transport and oxidation such as acyl CoA oxidase (ACO) and carnitine palmitoyltransferase 1 (CPT1) and uncoupling protein-2 (UCP2) (Mandard et al., Citation2004). In addition, Hwahng et al. (Citation2009) showed that S6K1 and AMPK oppositely regulate LXR-α activity. S6K1 directly phosphorylates LXR-α at serine residues (Ser125 and Ser293), resulting in LXR-α-dependent gene induction while AMPK phosphorylates LXR-α at threonine residues (Thr144) leading to LXR-α inactivation.
Genistein, 4′,5,7-trihydroxyisoflavone, is a natural phytoestrogen found in soybean. Administration of genistein attenuates hyperlipidemia and displays insulin-sensitizing and anti-steatotic actions in rodent models of insulin resistance (Mohamed Salih et al., Citation2009). However, the mechanisms underlying these beneficial effects are unravelled. We speculate that the activation of AMPK and inhibition of S6K1 could mediate these effects, since genistein is an activator of AMPK (Hwang et al., Citation2005). We have recently shown that genistein promotes insulin action in skeletal muscle of HFFD-fed mice by targeting AMPK and S6K1 (Arunkumar & Anuradha, Citation2012). Since liver is also a predominant site for insulin’s action, this study was initiated to investigate the effects of genistein on insulin signaling and lipid metabolism in liver.
Materials and methods
Animals, diet and treatment
Animal facilities and protocols were approved by the Institutional Animal Ethical Committee (IAEC), Rajah Muthiah Medical College and Hospital (RMMC and H), Annamalai University (Registration number: 739-160/1999/CPCSEA). Four-week-old albino male mice of Swiss strain weighing 25–26 g were procured from RMMC and H. One week after arrival, the mice were randomly divided into two groups and fed either normal diet (CON) or high-fat–high-fructose diet (HFFD). HFFD was prepared in the laboratory with the following composition (g/100 g diet): 45.0 fructose, 10.0 groundnut oil, 10.0 beef tallow, 22.5 casein, 0.3 dl-methionine, 1.2 vitamin mixture, 5.5 mineral mixture and 5.5 wheat bran. HFFD contained 45% (w/w) fructose (39% of calories), 20% (w/w) fat (10% beef tallow; 10% groundnut oil; 40% of calories) and 22.5% (w/w) casein (21% of calories). The standard laboratory chow consisted of 60% (w/w) starch, 22.08% (w/w) protein and 4.38% (w/w) fat. The normal chow diet contained total calories of about 382.61 calories/100 g diet and that of HFFD of about 471.25 calories/100 g diet. After 15 days, animals in each diet group were subdivided into different treatment groups and maintained as follows: normal diet (CON), HFFD alone (HFFD), HFFD plus genistein (HFFD + GEN) and normal diet plus genistein (CON + GEN). Genistein treatment was given for the next 45 days at a dose of 1 mg kg−1 body weight by oral gavage. Genistein was mixed in 0.5 ml of 30% dimethyl sulfoxide (DMSO). CON and HFFD group were administered DMSO alone. The mice were allowed access to the respective diet for the entire period of study (60 days). The HFFD diet recently described by us and the dosage of genistein used were based on our previous study (Arunkumar & Anuradha, Citation2012). Body weight was measured every fourth day and food intake of animals was recorded daily. Food was replaced daily. All mice were sacrificed at the end of the experimental period, blood samples were collected and plasma was separated by centrifugation. Liver was rapidly dissected and weighed to calculate the liver index (index (%) = liver weight (g)/body weight (g) × 100). Samples were immediately used for analysis.
Plasma and hepatic lipid profile and histological analysis
Lipids were extracted from the liver according to the method of Folch et al. (Citation1957). The content of TG, cholesterol and free fatty acids (FFA) was measured in plasma and liver by standard methods reported elsewhere (Thirunavukkarasu et al., Citation2004). For histology, 3–5 µm sections were obtained with a cryostat microtome and stained with hematoxylin and eosin (H & E) or oil red O solution. The sections were examined by light microscopy. Quantification of lipids in oil red O slides was carried out by measuring the red staining of images using the analysis software ImageJ (National Institutes of Health, Bethesda, MD).
Insulin stimulation and immunoblotting
At the end of the experimental period, a set of animals (n = 6) in each group were injected 1 U/kg human recombinant insulin intraperitoneally. Five minutes later, the animals were sacrificed and the liver was removed and homogenized in radioimmunoprecipitation assay (RIPA) buffer containing a protease inhibitor cocktail. The protein content in lysate was estimated by the method of Lowry et al. (Citation1951). Total protein (75 μg) was separated by 10% SDS–polyacrylamide gel electrophoresis, transferred to a polyvinylidene fluoride membrane, and hybridized with IR-β, p85 subunit of PI3K, Akt (Santa Cruz Biotechnology, Santa Cruz, CA, phosphotyrosine, p-Ser473Akt, AMPK, p-Thr172AMPK (Cell Signaling Technology, Danvers, MA), S6K1, β-actin, phosphoserine (Sigma, St. Louis, MO) and p-Thr389S6K1 (Epitomics, Burlingame, CA) at 4 °C. After incubation with horseradish peroxidase-conjugated secondary antibody (Genei, Bangalore) for 2 h at room temperature, immunoreactive proteins were visualized with Immobilon HRP Western Substrate (Millipore). Bands were quantified by the analysis software ImageJ (National Institutes of Health, Bethesda, MD). For protein phosphorylation, the data of phosphoform were divided by that of the corresponding unphosphorylated form. The values obtained for the experimental groups were then expressed as fold change relative to the control group taken as 1.0.
Immunoprecipitation and immunoblotting
Liver homogenate containing 250 μg proteins was incubated overnight at 4 °C with antibodies specific to IR-β, IRS-1 or 2 and the immune complexes were captured and suspended in Laemmli sample buffer and boiled for 5 min. The supernatant was subjected to sodium dodecyl sulfate--polyacrylamide gel electrophoresis (SDS--PAGE) (10% gel) followed by electrotransfer onto polyvinylidene difluoride (PVDF) membrane. Following transfer, the proteins were immunoblotted with the antibody specific for phosphotyrosine for IR-β, phosphotyrosine, phosphoserine or p85PI3K for IRS-1 and 2. Quantification was performed as mentioned earlier.
Semi-quantitative reverse transcriptase reaction and PCR amplification
Total RNA from the liver tissue was extracted using TRIsoln reagent (Genei, India). One microgram of isolated total RNA was reverse-transcribed to cDNA in a reaction mixture containing 4 µl of reverse transcriptase (RT) buffer (5×), 2 µl of dNTPs mix (30 mM), 10 units of RNase inhibitor, 25 units of M-MuLV RT, 1 µl of DTT (0.1 M) and 0.5 µg of oligo(dT) primer (Bangalore Genei Pvt Ltd, Bangalore, India) in a total volume of 20 µl. The resulting cDNA served as a template in a 20 μl reaction mixture containing 0.5 unit of Taq, 2 µl of Taq buffer, 20 pmol of forward and reverse primer and 1 μl of dNTPs mix (30 mM). PCR was done using an initial step at 94 °C for 5 min, followed by 35 amplification cycles (94 °C for 30 s; 55–61 °C for 45 s; 72 °C for 1 min) and 72 °C for 10 min. The amplification products were analyzed by agarose electrophoresis, visualized using gel documentation system (GELSTAN chemi 1312, Mediccare, New Delhi, India) and quantified using ImageJ software (National Institutes of Health, Bethesda, MD). Primer sequences and thermocycling conditions used for RT-PCR are given in .
Table 1. Primer sequences and thermocycling conditions for RT-PCR.
Statistical analysis
Data are expressed as mean ± SD of six mice from each group and statistically evaluated by one-way analysis of variance followed by Duncan’s Multiple Range Test (DMRT) for multiple comparisons. A value of p < 0.05 was considered statistically significant.
Results
Body weight, food intake, liver weight, liver index and lipid levels
shows the initial and final body weight, food intake, liver weight and liver index (LI: liver weight/body weight × 100) of experimental animals. At the end of the study, body weight was significantly higher in the HFFD group than the CON group. However, genistein administration significantly reduced HFFD-induced body weight gain. There was no significant difference in food intake among the groups. Both liver weight and liver index were significantly higher in HFFD-fed mice when compared to control. However, increased liver weight and liver index observed in HFFD-fed mice were significantly brought down to near-control levels in genistein-administered HFFD-fed animals. Plasma and hepatic levels of total cholesterol, FFAs and triglycerides significantly increased in HFFD-fed mice. However, genistein addition to HFFD-fed mice restored plasma and liver lipid levels to near-normal values.
Table 2. Initial and final body weight, food intake, liver weight, liver index (liver weight (g)/body weight (g) ×100) and the levels of lipids in plasma (mmol/l) and liver (mg/g tissue) of mice.
Lipid analysis
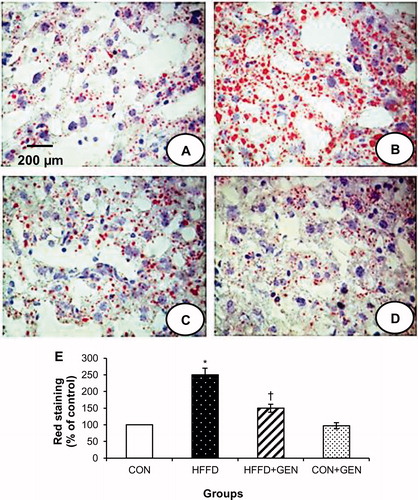
The gross appearance () and H and E analysis () of the liver revealed steatosis in the HFFD group compared with the normal diet-fed mice. However, fat infiltration was significantly reduced in livers of the genistein-treated HFFD-fed mice. Oil red O () results confirm that genistein treatment decreases HFFD-induced hepatic triglyceride levels.
Figure 1. Gross appearance of liver. HFFD group (B) shows hepatomegaly and pale appearance compared to CON group (A). Liver from HFFD + GEN group (C) shows near-normal appearance. CON + GEN group (D) shows normal appearance of liver.
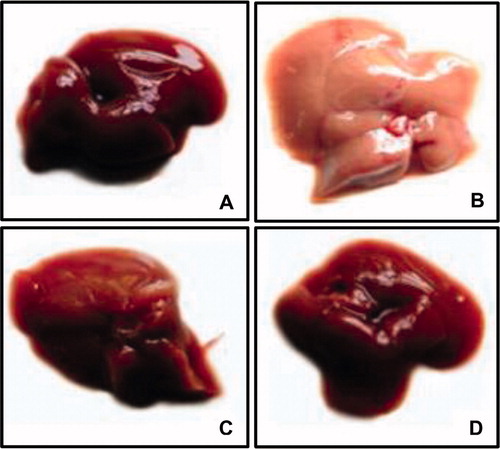
Figure 2. Representative liver sections stained with hematoxylin and eosin (40×) from each group. CON group (A) shows normal architecture of liver. HFFD group (B) shows large cytoplasmic lipid droplets (indicated by arrows) and ballooning degeneration (indicated by circle). HFFD + GEN group (C) shows less lipid vacuoles as compared to HFFD suggesting a reduction in lipid deposition. CON + GEN group (D) shows normal architecture of liver.
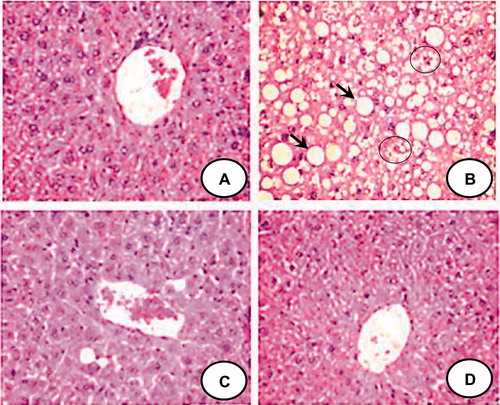
Figure 3. Representative images of the liver sections stained with oil Red O (40×) from each group. HFFD group (B) shows increased red staining suggesting increased fat accumulation. HFFD + GEN group (C) shows decreased red staining as compared to HFFD suggesting a reduction in lipid deposition. CON + GEN group (D) shows staining similar to CON group (A) of liver. Histograms (E) represent mean ± SD (three animals per group). Scale bar 1 cm = 200 µm. *p < 0.05 compared to control; †p < 0.05 compared to HFFD.
Insulin signaling and energy sensing proteins
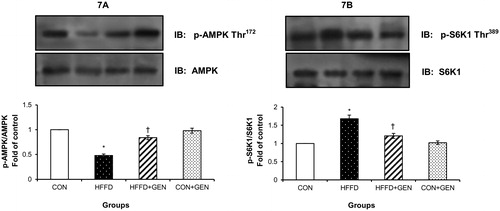
HFFD feeding markedly reduced insulin-stimulated IR-β, IRS-1 and 2 tyrosine phosphorylation but increased IRS-1 and 2 serine phosphorylation although the protein abundance of IRβ, IRS-1 and 2 and Akt was similar in all groups. However, genistein treatment caused a significant increase in the tyrosine phosphorylation of IR-β () and IRS-1 and 2 and a decrease in serine phosphorylation of IRS-1 and 2 (). In addition, HFFD feeding significantly reduced insulin-stimulated IRS-1 and 2/PI3K association. However, genistein treatment increased IRS-1 and 2/PI3K association () compared to HFFD-fed mice. Akt-Ser473 phosphorylation was significantly higher (p < 0.05) in the GEN + HFFD group (). AMPK Thr172 phosphorylation was markedly reduced while S6K1 phosphorylation was increased in HFFD compared to that of CON. However, genistein treatment led to significant increase (p < 0.05) in AMPK phosphorylation () and significant reduction (p < 0.05) in S6K1 phosphorylation () in HFFD-fed mice. No significant differences were observed between the CON and CON + GEN group in AMPK and S6K1 phosphorylation.
Figure 4. Effect of genistein on IR-β tyrosine phosphorylation in liver of experimental animals after insulin stimulation. The extent of IR-β tyrosine phosphorylation was assessed by the anti-phosphotyrosine western blot of IR-β immunoprecipitates. Blots were stripped of bound antibodies and re-probed with anti-IR-β antibody for normalization. Densitometric quantification of phosphotyrosine IR-β to IR-β is expressed as fold change with respect to control. Data are expressed as mean ± SD of six mice. IP, immunoprecipitation; IB, immunoblotting; *p < 0.05 compared to control; †p < 0.05 compared to HFFD.
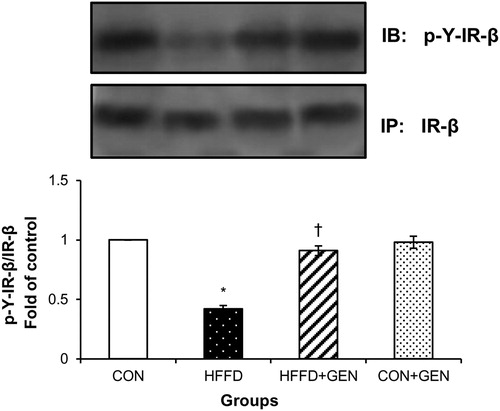
Figure 5. Effect of genistein on IRS-1 and 2 phosphorylation. (A and B) The effects of genistein on IRS-1 and 2 serine and tyrosine phosphorylation and p85PI3K association to IRS-1 and 2 in liver of experimental animals after insulin stimulation. The serine and tyrosine phosphorylation of IRS-1 or 2 and the association of IRS-1 or 2 with PI3K were assessed by anti-phosphoserine or anti-phosphotyrosine or p85PI3K western blot of IRS-1 or 2 immunoprecipitates. Blots were stripped of bound antibodies and re-probed with either anti-IRS-1 or 2 antibodies to normalize the blots for protein levels. Densitometric data of phosphoserine, phosphotyrosine and IRS-1 or 2/p85PI3K association to IRS-1 or 2 are expressed as fold change with respect to control. Data are expressed as mean ± SD of six mice. IP, immunoprecipitation; IB, immunoblotting; *p < 0.05 compared to control; †p < 0.05 compared to HFFD.
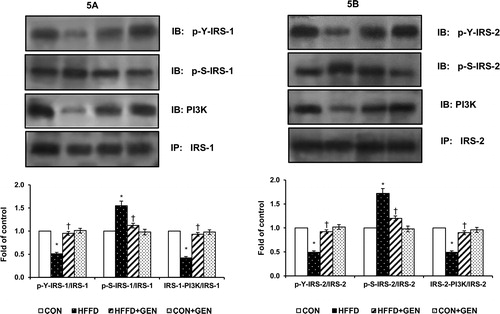
Figure 6. Effect of genistein on Akt phosphorylation in liver of experimental animals after insulin stimulation. For determining the extent of Akt activation, proteins were immunoblotted with phosphospecific anti-Ser473 Akt antibody. Blots were stripped and re-probed with anti-Akt antibody for normalization. Densitometric quantification of pAkt Ser473 to Akt is expressed as fold change with respect to control. Data are mean ± SD of six mice. IB, immunoblotting; *p < 0.05 compared to control; †p < 0.05 compared to HFFD.
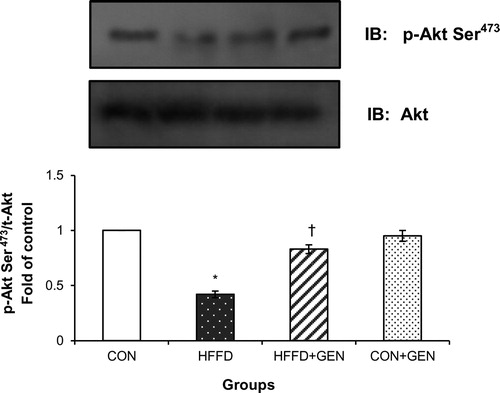
Figure 7. Effect of genistein on AMPK and S6K1 phosphorylation. (A) The effect of genistein on AMPK phosphorylation in liver of experimental animals. For determining the extent of AMPK activation, proteins were immunoblotted with phosphospecific anti-Thr172 AMPK antibody. Blots were stripped and re-probed with anti-AMPK antibody for normalization. Densitometric quantification of p-Thr172 AMPK to AMPK is expressed as fold change with respect to control. (B) The effect of genistein on S6K1 inhibition in liver of experimental animals. Proteins were immunoblotted with phosphospecific anti-Thr389 S6K1 antibody. Blots were stripped and re-probed with anti-S6K1 antibody to normalize for protein levels. Densitometric quantification of anti-Thr389 S6K1 to S6K1 are expressed as fold change with respect to control. Data are mean ± SD of six mice. IB, immunoblotting; *p < 0.05 compared to control; †p < 0.05 compared to HFFD.
Expression of genes related to lipid metabolism
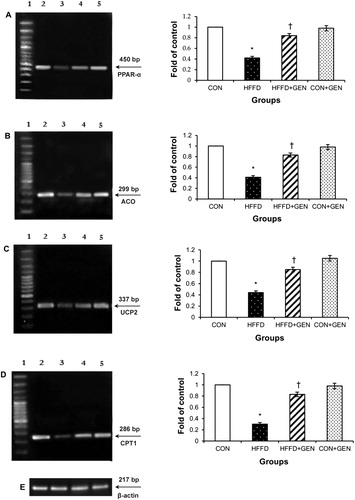
The mRNA expression of genes inducing lipid synthesis including LXR-α, SREPB1c, FAS, ACC and SCD1 () was significantly elevated (p < 0.05), while mRNA expression of genes regulating lipid oxidation including PPAR-α, ACO, UCP2 and CPT1 () was significantly decreased (p < 0.05) in the liver of HFFD-fed mice. Importantly, these changes were significantly counteracted (p < 0.05) by genistein treatment in the HFFD group. No significant differences were observed in the CON + GEN group compared with the CON group.
Figure 8. RT-PCR analysis of LXR-α (A), SREBP1c (B), FAS (C), ACC (D), SCD1 (E) and β-actin (F).The densitometry data for each band in an animal group was normalized with the corresponding β-actin in that group. The value obtained from each group was then expressed as fold change relative to control group. Lane 1: 100 bp DNA ladder; lane 2: CON; lane 3: HFFD; lane 4: HFFD + GEN and lane 5: CON + GEN. Data are expressed as mean ± SD of six mice. *p < 0.05 compared to control; †p < 0.05 compared to HFFD.
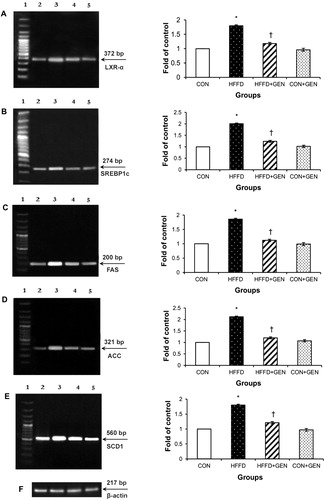
Figure 9. RT-PCR analysis of PPAR-α (A), ACO (B), UCP2 (C), CPT1 (D) and β-actin (E). The densitometry data for each band in an animal group were normalized with the corresponding β-actin in that group. The value obtained from each group was then expressed as fold change relative to control group. Lane 1: 100 bp DNA ladder; lane 2: CON; lane 3: HFFD; lane 4: HFFD + GEN and lane 5: CON + GEN. Data are expressed as mean ± SD of six mice. *p < 0.05 compared to control; †p < 0.05 compared to HFFD.
Discussion
Our findings demonstrate that in high-calorie diet-fed animals, genistein (1) lowers SREBP1c-mediated lipogenesis in the liver via the inhibition of LXR-α expression, (2) activates insulin-stimulated tyrosine phosphorylation of IRS-1 and 2, PI3K association with IRS-1/2 and Akt Ser473 phosphorylation, and (3) promotes AMPK Thr172 phosphorylation and inhibits S6K1 by Thr389 phosphorylation in the liver.
Hepatic fat deposition occurs largely due to de novo lipogenesis and is also related to hepatic insulin resistance (Oosterveer et al., Citation2009). The importance of LXR-α in lipogenesis emerges from the findings that administration of LXR-α activator induces hepatic lipogenesis and TG accumulation in C57BL/6 mice, whereas LXR-α-deficient mice (LXR-α−/−) abolishes this effect (Schultz et al., Citation2000). Consistent with this, HFFD feeding in mice increased hepatic and plasma TG levels. In the present study, genistein downregulated LXR-α gene expression possibly through AMPK activation and S6K1 inhibition. This was further evidenced by the repression of SREBP1c and lipogenic genes FAS, ACC and SCD1 which are under AMPK control.
Besides lowering lipogenesis, AMPK regulates cellular lipid metabolism by stimulation of β-oxidation of fatty acids (Zhang et al., Citation2009). The rate limiting steps of β-oxidation are those catalyzed by CPT1 in the mitochondria and ACO in the peroxisomes (Ouali et al., Citation2000). Transcription of CPT1 and ACO is triggered by the transcription factor PPAR-α by binding to PPAR response elements (Mandard et al., Citation2004). Further, the rate of oxidative metabolism depends not only on CPT1 and ACO but also to some extent on UCP2 (Soh et al., Citation2008). In the present study, genistein increased the mRNA levels of PPAR-α, ACO, CPT1 and UCP2 genes contributing to the stimulation of lipid catabolism in liver. These results suggest that genistein activates lipid oxidation in liver during the conditions of lipid overload.
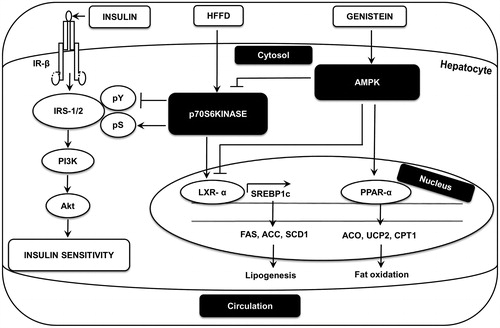
In this study, HFFD feeding interrupted IRS-PI3K-Akt insulin signaling pathway in liver. Genistein treatment increased insulin-stimulated tyrosine phosphorylation of IR-β, IRS-1 and 2, association of IRS-1 and 2 with PI3K and Akt Ser473 phosphorylation in liver. Genistein promotes AMPK Thr172 phosphorylation which led to the inhibition of S6K1. This in turn abolishes the inhibition of IRS-1 by S6K1 and thereby promotes insulin signaling. Rapamycin, an inhibitior of S6K1, prevents IRS-1 Ser1101 phosphorylation and promotes insulin sensitivity in L6 myocytes. Phosphorylation of IRS-1 at Ser1101 by S6K1 is an important causal element involved in the development of insulin resistance in animal model during nutrient satiation (Tremblay et al., Citation2007). presents a schematic representation of the modulatory effects of genistein.
Figure 10. A schematic diagram illustrating the proposed mechanism for genistein’s action in liver. Genistein activates AMPK in liver. This activation inhibits HFFD-induced S6K1 activation and thereby improves insulin signaling in liver. Additionally, genistein limits lipogenesis by inhibiting LXR-α-SREBP1c and downregulates SREBP1c-dependent lipogeneic genes including FAS, ACC and SCD1. Further, genistein induces fat oxidation by upregulating PPAR-α, ACO, UCP2 and CPT1 genes.
Conclusion
In conclusion, we show that genistein targets S6K1, a negative modulator of insulin signaling possibly through AMPK activation in liver. Thus, the present study provides a strong rationale for further evaluation of the potential role of genistein in treating insulin resistance/type 2 diabetes.
Declaration of interest
The authors report no conflicts of interest.
Related Research Data
References
- Akagiri S, Naito Y, Ichikawa H, et al. (2008). A mouse model of metabolic syndrome; increase in visceral adipose tissue precedes the development of fatty liver and insulin resistance in high-fat diet-fed male KK/Ta mice. J Clin Biochem Nutr 42:150–7
- Arunkumar E, Anuradha CV. (2012). Genistein promotes insulin action through adenosine monophosphate-activated protein kinase activation and p70 ribosomal protein S6 kinase 1 inhibition in the skeletal muscle of mice fed a high energy diet. Nutr Res 32:617–25
- Folch J, Lees M, Sloane Stanley GH. (1957). A simple method for the isolation and purification of total lipids from animal tissues. J Biol Chem 226:497–509
- Hwahng SH, Ki SH, Bae EJ, et al. (2009). Role of adenosine monophosphate-activated protein kinase-p70 ribosomal S6 kinase-1 pathway in repression of liver X receptor-alpha-dependent lipogenic gene induction and hepatic steatosis by a novel class of dithiolethiones. Hepatology 49:1913–25
- Hwang JT, Park IJ, Shin JI, et al. (2005). Genistein, EGCG, and capsaicin inhibit adipocyte differentiation process via activating AMP-activated protein kinase. Biochem Biophys Res Commun 338:694–9
- Kondo T, Kishi M, Fushimi T, Kaga T. (2009). Acetic acid upregulates the expression of genes for fatty acid oxidation enzymes in liver to suppress body fat accumulation. J Agric Food Chem 57:5982–6
- Liu YF, Herschkovitz A, Boura-Halfon S, et al. (2004). Serine phosphorylation proximal to its phosphotyrosine binding domain inhibits insulin receptor substrate 1 function and promotes insulin resistance. Mol Cell Biol 24:9668–81
- Lowry OH, Rosebrough N, Farr AL, Randall RJ. (1951). Protein measurement with the Folin phenol reagent. J Biol Chem 193:265–75
- Mandard S, Müller M, Kersten S. (2004). Peroxisome proliferator-activated receptor alpha target genes. Cell Mol Life Sci 61:393–416
- Mohamed Salih S, Nallasamy P, Muniyandi P, et al. (2009). Genistein improves liver function and attenuates nonalcoholic fatty liver disease in a rat model of insulin resistance. J Diabetes 1:278–87
- Oosterveer MH, van Dijk TH, Tietge UJ, et al. (2009). High fat feeding induces hepatic fatty acid elongation in mice. PLoS One 4:e6066
- Ouali F, Djouadi F, Merlet-Bénichou C, et al. (2000). Regulation of fatty acid transport protein and mitochondrial and peroxisomal beta-oxidation gene expression by fatty acids in developing rats. Pediatr Res 48:691–6
- Rijzewijk LJ, van der Meer RW, Lubberink M, et al. (2010). Liver fat content in type 2 diabetes: Relationship with hepatic perfusion and substrate metabolism. Diabetes 59:2747–54
- Saltiel AR, Kahn CR. (2001). Insulin signaling and the regulation of glucose and lipid metabolism. Nature 414:799–806
- Schultz JR, Tu H, Luk A, et al. (2000). Role of LXRs in control of lipogenesis. Genes Dev 14:2831–8
- Shimano H. (2000). Sterol regulatory element-binding protein-1 as a dominant transcription factor for gene regulation of lipogenic enzymes in the liver. Trends Cardiovasc Med 10:275–8
- Soh JR, Shin DH, Kwon DY, Cha YS. (2008). Effect of Cheonggukjang supplementation upon hepatic acyl-CoA synthase, carnitine palmitoyltransferase I, acyl-CoA oxidase and uncoupling protein 2 mRNA levels in C57BL/6J mice fed with high fat diet. Genes Nutr 2:365–9
- Thirunavukkarasu V, Anitha Nandhini AT, Anuradha CV. (2004). Effect of alpha-lipoic acid on lipid profile in rats fed a high-fructose diet. Exp Diabesity Res 5:195–200
- Tremblay F, Brûlé S, Hee Um S, et al. (2007). Identification of IRS-1 Ser-1101 as a target of S6K1 in nutrient- and obesity-induced insulin resistance. Proc Natl Acad Sci USA 104:14056–61
- Um SH, D’Alessio D, Thomas G. (2006). Nutrient overload, insulin resistance, and ribosomal protein S6 kinase 1, S6K1. Cell Metab 3:393–402
- Yap F, Craddock L, Yang J. (2011). Mechanism of AMPK suppression of LXR-dependent Srebp-1c transcription. Int J Biol Sci 7:645–50
- Yki-Järvinen H, Westerbacka J. (2005). The fatty liver and insulin resistance. Curr Mol Med 5:287–95
- Zhang BB, Zhou G, Li C. (2009). AMPK: An emerging drug target for diabetes and the metabolic syndrome. Cell Metab 9:407–16