Abstract
Context: Rabdosia rubescens (Hemsl.) Hara (Lamiaceae) is widely used in traditional Chinese medicines for the treatment of antitumor, antimicrobial, anti-inflammatory and antioxidation. It is also used as a supplement in the treatment of many cancers, such as esophagus, mammary gland, liver and prostate cancers.
Objective: To investigate the multidrug resistance (MDR) reversal effects and its possible mechanism of R. rubescens extracts on human breast cancer cell line MCF-7/Adr (Michigan Cancer Foundation – 7/adriamycin resistance).
Materials and methods: Rabdosia rubescens were extracted by reflux extraction method with different solvent such as petroleum ether, chloroform, ethyl acetate, n-butyl alcohol and water in order and obtain petroleum ether fraction (PEF), chloroform fraction (CF), ethyl acetate fraction (EAF), n-butyl alcohol fraction (BAF) and aqueous fraction (AF). The active extract fractions of R. rubescens were screened by rhodamine123 (Rh123) accumulation assay. Cytotoxicity of the effect fraction was examined by the MTT assay; the intracellular accumulation of adriamycin and expression of P-gp were examined by flow cytometry; the gene transcription of MDR1 was determined by RT-PCR.
Results: CF and EAF fractions could increase the intracellular accumulation of adriamycin in MCF-7/Adr cells, PEF, BAF and AF fractions showed little effect on the intracellular accumulation of adriamycin or Rh123. When adriamycin was used in combination with CF and EAF fractions at non-toxic concentration on MCF-7/Adr cells, CF and EAF fractions can reverse MDR of MCF-7/Adr cells, and the reverse folds were 2.16 (CF, 4 μg/mL), 4.60 (CF, 20 μg/mL), 1.87 (EAF, 4 μg/mL) and 4.02 (EAF, 20 μg/mL), respectively. After treatment with CF (4.20 μg/mL) and EAF (4.20 μg/mL) for 48 h, the MDR1 gene expression level in MCF-7/Adr cells was decreased by 40.17, 48.14, 33.86 and 42.52%, and the abundance of P-gp also decreased by 8.63, 24.53, 27.50 and 34.91% in MCF-7/Adr cells, respectively.
Discussion and conclusion: These results indicate the therapeutic value of chloroform fraction (CF) and ethyl acetate fraction (EAF) from R. rubescens as potential MDR reversing agents and warranted further investigation.
Introduction
Multidrug resistance (MDR) in tumor cells is a protective action against a variety of drugs with different structures and functions; MDR is a crucial factor inducing the failure of cancer chemotherapy (Krishna & Mayer, Citation2000). It is important to develop new MDR reversal agents with lower toxicity and higher efficiency. One mechanism of MDR in tumor cells is associated with the over-expression of P-glycoprotein (P-gp), a member of the ATP binding-cassette (ABC) super family of membrane transporters encoded by the MDR1 gene (Tiwari et al., Citation2009). P-gp can pump drugs out of cancer cells actively, thereby decrease its intracellular accumulation and induce drug resistance of tumor cells (Lage, Citation2003; Ling, Citation1997) Thus, P-gp is an important target for the development of drug resistance reversal agents.
A number of MDR reversal agents have been found to enhance the intracellular accumulation of anticancer drugs via inhibiting the P-gp, such as verapamil (Tsuruo et al., Citation1981), cyclosporin A (Theis et al., Citation2000), valspodar (PSC 833), LY335979, biricodar (Seiden et al., Citation2002), tetrandrine (Fu et al., Citation2004), FG020326 or its derivatives (Chen et al., Citation2004), curcumin (Xiao & Wang, Citation2011) and schizandrins (Huang et al., Citation2008). However, many of them failed to achieve clinical success due to their toxicity and/or alteration of the pharmacokinetics of co-administered anticancer drugs. Therefore, development of safe and effective MDR reversal agents is still urgently required (Watt, Citation2006).
Much effort is being expanded toward identifying natural compounds from plant origins. The herbal medicines used for several thousand years in the traditional Chinese medicines (TCM) are probably the best established and codified sources. Rabdosia rubescens (Hemsl.) Hara (Lamiaceae), one of the most famous Chinese herbal medicines, has been used in antitumor, antimicrobial, anti-inflammatory and antioxidation treatments (Bai et al., Citation2010; Schwarz et al., Citation2003; Xu et al., Citation2009). Its aerial part has long been used for the treatment of esophageal cancer. This is well documented in the Pharmacopoeia of the People’s Republic of China (China Pharmacopaeia Committee, Citation2010). Phytochemical and pharmacological studies have demonstrated that diterpenoids, oridonin and ponicidin, isolated from R. rubescens, has antiangiogenic activity (Lu et al., Citation2007). Additionally, oridonin and ponicidin can inhibit the proliferation of a wide variety of cancer cells originated from breast and laryngeal, and be considered to be potential new anticancer drug candidates (Kang et al., Citation2010; Hsieh et al., Citation2005; Xu et al., Citation2008).
In our research, we focused on the MDR reversal effect of R. rubescens extracts on MCF-7/Adr cells [a multidrug-resistant (MDR) human breast cancer MCF-7 subline]; the mechanism of its MDR reversing effect is also explored.
Materials and methods
Materials
Rhodamine123 (Rh123), 3-(4,5-dimethylthiazol-2-yl)-2,5-diphenyl tetrazolium bromide (MTT), verapamil (Ver) were purchased from the Sigma Chemical (St. Louis, MO); adriamycin (Adr) was obtained from Pfizer Italia S.r.I (Latina, Italia), RPMI1640 and DMEM medium were purchased from GIBCO-BRL (Gaithersburg, MD); Trizol reagent and RT-PCR kit were purchased from TaKaLa (Dalian, China); rabbit antihuman P-gp monoclonal antibody and fluorescein isothiocyanate conjugated (FITC) goat anti-Rabbit lgG were purchased from Beijing BIOSS (Beijing, China); primer pairs and probe were purchased from Sangon Co (Shanghai, China).
Preparation of different extract fractions of R. rubescens
The aerial parts of R. rubescens were collected in WanShou Medicinal materials market of Xi’an, Shaanxi Province, China, in October 2006, and were authenticated by Dr. Zhang Xiaohui (College of Life Sciences, Shaanxi Normal University). A voucher specimen (ID: L20090072) was deposited at the Specimen Room of College of Life Sciences, Shaanxi Normal University. Aerial parts of R. rubescens (500 g) were dried out of direct sun and powdered, then extracted three times with 95% ethanol. The combined ethanol extract was evaporated in vacuo. The dried residue was suspended in water and extracted successively with petroleum ether, chloroform, ethyl acetate and n-butyl alcohol to yield the petroleum ether fraction (PEF), chloroform fraction (CF), ethyl acetate fraction (EAF), n-butyl alcohol fraction (BAF) and aqueous fraction (AF). All fractions were concentrated under reduced pressure and dried in a vacuum drier, then dissolved in dimethyl sulfoxide (DMSO) to a concentration of 1 μg/mL.
Cell lines and culture conditions
Caco-2 cell line, MCF-7 and MCF-7/Adr cell line were obtained from the Institute of Biochemistry and Cell Biology of the Chinese Academy Science in Shanghai. Caco-2 cells were maintained in a complete DMEM medium at 37 °C in a humidified atmosphere of 5% CO2. MCF-7 and MCF-7/Adr cells were cultured in RPMI-1640 medium supplemented with 10% fetal calf serum at 37 °C in a humidified atmosphere of 5% CO2. MCF-7/Adr cells were maintained in the medium containing 1 μg/mL adriamycin, MCF-7/Adr cells were cultured in drug-free medium for 2 weeks before formal experiments.
Effect of different extract fractions of R. rubescens on Rh123 accumulation in Caco-2 cells
Rh123 accumulation in Caco-2 cells was measured based on literature (Perloff et al., Citation2003; Szakacs et al., Citation2008). Aliquots of Caco-2 cells (200 μL) at 1 × 10⁵ cells/mL were seeded into 96-well plates and incubated for 24 h at 37 °C before the addition of modulators. After pre-incubation, cells were treated with various concentrations of extracts (0, 1 and 100 μg/mL) for 10 min, verapamil (5 μg/mL) was used as a positive control. Then cells were incubated with 5 μM of Rh123 in the culture medium in the dark at 37 °C in 5% CO2 for another 1 or 72 h. After the cells were washed twice with ice-cold phosphate-buffered saline (PBS) and suspended by 200 μL PBS. The intracellular mean fluorescence intensity (MFI) associated with Rh123 was determined by a microplate reader (AnthosZenyth3100, Salzburg, Austria). Excitation was performed at 488 nm and the emitted fluorescence was at 530 nm. The fluorescence accumulation multiple (FAM) = (MFI of experimental group/MFI of control group × 100%).
Determination of cytotoxicity and MDR reversal
The in vitro cytotoxicity of the drugs was determined by the MTT assay. Cells were cultured without drug for 2 weeks, and harvested at exponential growth phase. Aliquots of MCF-7 cells (5 × 10⁴ cells/mL, 200 μL) and MCF-7/Adr cells (8 × 10⁴ cells/mL, 200 μL) were plated into 96-well plates. Cells were incubated for 24 h at 37 °C before the addition of anticancer drugs (adriamycin, cisplatin and vincristine). After pre-incubation, the cells were treated with various concentrations of different anti-drugs for 48 h (adriamycin or cisplatin: 0, 0.16, 0.8, 4, 20 or 100 μg/mL; vincristine: 0, 0.024, 0.12, 0.60, 3.00, 15.00 μg/mL). Then 20 μl of freshly prepared MTT was added to each well and incubated for 4 h at 37 °C. After the medium was carefully removed, 150 μL of DMSO were added and agitated for 15 min to dissolve the formazan crystals. The absorbance in each well was read at 570 nm by a microplate reader. IC50 values were calculated by SPSS17. IC50, the half maximal inhibitory concentration, represents the concentration of the modulators that is required for 50% inhibition of cells growth. Resistance index (RI) was calculated using the following formula:
The reversal effects of CF and EAF fractions were further investigated with the similar method. MCF-7 and MCF-7/Adr cells were seeded into 96-well plates and treated with various concentrations of adriamycin alone or in combination with CF and EAF at different concentrations (0, 4 and 20 μg/mL) for 48 h, respectively. The inhibitory rate of adriamycin on cell growth was obtained through IC50 values. The reversal fold (RF) values, as potency of reversal, were calculated from fitting the data to RF = IC50 of adriamycin alone/IC50 of adriamycin incubated with modulators. In all the experiments, verapamil (Ver, 5 μg/mL) was used as a positive control agent. The experiments were repeated twice.
Determination of intracellular accumulation of adriamycin
The intracellular accumulation of adriamycin was determined as previously described (Ji et al., Citation2005). MCF-7 and MCF-7/Adr cells were harvested and aliquots at 2.0 × 10⁵ cells/mL (5 mL) were added into each well into 6-well plates. After incubated for 24 h at 37 °C, the cells were treated either with adriamycin (1 μg/mL) alone or in combination with CF, EAF at different concentrations (4 and 20 μg/mL) or 5 μg/mL verapamil for 48 h at 37 °C. Then cells were placed in ice-water to cease the reaction followed by harvesting and washing twice with ice-cold PBS. The intracellular MFI associated with adriamycin was determined by flow cytometry (FACS, Calibur, San Jose, CA).
Rh123 accumulation assay
The effect of CF and EAF on P-gp activity was assessed by measuring the intracellular accumulation of Rh123. Aliquots of 1 mL MCF-7 and MCF-7/Adr cells suspension (3.0 × 10⁵ cells/mL) were added into 24-well plates per well. After pretreated with CF and EAF at different concentrations (0, 4 and 20 μg/mL) or 5 μg/mL verapamil for 1 h, cells were incubated with 5 μM of Rh123 in culture medium in dark at 37 °C under 5% CO2 for another 1 h. Then cells were washed twice with ice-cold PBS. The MFI associated with Rh123 was measured by FACS. Excitation at 488 nm and the emitted fluorescence was 530 nm.
Semiquantitative analysis of the transcription of MDR1 gene
MCF-7 cells and MCF-7/Adr cells were incubated with CF or EAF at different concentrations (0, 4 and 20 μg/mL) and incubated for 48 h at 37 °C. The total RNA was isolated with the TRIzol reagent of TaKaLa RNAiso™ Plus (Takara Biotechnology Co., Ltd., Dalian, China). cDNA was synthesized through reverse transcription using M-MLV Reverse Transcriptase and oligo(dT) primer. RT-PCR was performed as previously reported (Gao et al., Citation2010). The primers used for MDR1 and β-actin genes were as follows: MDR1, forward 5′-CCCA TCATTGCAATAGCAGG-3′ and reverse 5'-GTTCAAACTTCTGCTC CTCA-3′ for a 157 bp product; β-actin, forward 5′-CTTCTACAATG AGCTGCGTG-3′ and reverse 5′-TCATGAGGTAGTCGTCAG G-3' for a 305 bp product, β-actin was used as the reference gene. Amplification was performed for 35 cycles and consisted of denaturation at 94 °C for 15 s, annealing at 57 °C for 30 s and extension at 72 °C for 30 s. The amplified fragments were detected by 1% (w/v) agarose gel electrophoresis with ethidium bromide staining and analyzed using an image analysis system Tanon 2500. The specific gene expression level was determined semi-quantitatively by calculating the ratio of density metric value from specific genes expressed in relation to the internal standard (MDR1 gene expression/β-actin expression). The experiments were repeated twice.
Detection of P-gp expression
The cell P-gp levels were measured by flow cytometry (Shi et al., Citation2008). MCF-7 and MCF-7/Adr cells were harvested and 5 mL aliquots were added into 6-well plates per well at 2.0 × 10⁵ cells/mL. Different concentrations of CF and EAF (0, 4 and 20 μg/mL) was added after pre-incubation 24 h at 37 °C. The cells were incubated for 48 h at 37 °C before being harvested, and washed twice with ice-cold PBS. Cells were then incubated for 45 min at 4 °C with rabbit monoclonal antibody against human P-gp. The primary antibody was detected by the goat anti-rabbit lgG labeled with fluorescein isothiocyanate conjugated according to the manufacturer’s instruction. The fluorescent intensity was analyzed using flow cytometry with isotype as control.
The HPLC fingerprint analysis of EAF and CF
EAF and CF was sonicated for 30 min with MeOH to prepare a solution of 4 mg/mL. Oridonin (purity >99% by HPLC, provided by Jiulong Pharmaceutical Co. Ltd., Liaoning, China) was dissolved in MeOH to make a standard solution of 0.4 mg/mL. All samples were filtered (0.22 μm) before being analyzed on a LC-2010CHT HPLC system equipped with an SPD-10Avp ultraviolet visible detector (Shimadzu Corporation, Kyoto, Japan). Compounds were eluted at 0.8 mL/min on a Lichrospher C18 RP-18 column (4.6 mm × 250 mm, 5 μm) (Merck Co., Whitehouse Station, NJ). The eluent consisted of 1% aqueous acetic acid in water (A) and 100% methanol (B). A gradient solvent system was used as follows: 30% B and 70% A in the first 5 min; 30–40% B in A from 5 to 30 min. The wavelength of detection was 245 nm. The Oridonin content in EAF and CF was calculated by the standard curve of Oridonin.
Statistical analysis
Data were described as the mean ± SD, statistical analyses were performed using the SPSS17 (IBM Co., Armonk, NY) for windows, Student’s t-test was used for statistical analysis and p < 0.05 was considered as significant.
Results
Effects of different extract fractions of R. rubescens on Rh123 accumulation in Caco-2 cells
After 1 and 72 h incubation with R. rubescens extracts, CF, EAF and AF increased intracellular accumulation of Rh123 in Caco-2 cells significantly in a concentration-dependent manner. The petroleum ether fraction (PEF) treatment did not seem to have any effect on the cells, while a non-significant trend of Rh123 accumulation increase with BAF was noted. The fluorescence accumulation multiple (FAM) of different groups is shown in .
Table 1. The effect of fractions from R. rubescens extracts and Ver modulators on Rh123 accumulations in Caco-2 cells.
Determination of MDR
When the MTT assay was performed, it was found that MCF-7/Adr cells were resistant not only to adriamycin but also to other anticancer drugs. Among them, we have tested cisplatin (DDP) and vincristine (VCR). The IC50 of these drugs to MCF-7/Adr cells increased significantly compared with MCF-7 cells (). MCF-7/Adr cells were about 19-fold more resistant to adriamycin in comparison with the sensitive MCF-7 cells.
Table 2. The IC50 and drug resistance index of anticancer drugs on MCF-7 and MCF-7/Adr cells.
Effects of CF and EAF fractions on the growth of MCF-7/Adr cells
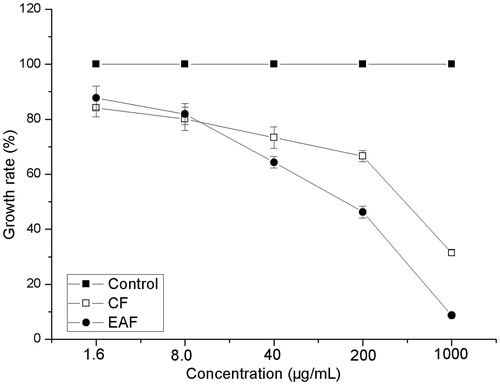
Because the AF fraction could not enhance the accumulation of intracellular adriamycin (), CF and EAF fractions were selected for further studies. The effect of CF and EAF fractions on MCF-7/Adr cell growth was determined with the MTT assay. The viability of the cells was evaluated as described in the “Materials and methods” section. The results showed that CF and EAF fractions from 1.6 to 40 μg/mL had no significant inhibitory effects on the growth of MCF-7/Adr cells (). Low concentrations of CF and EAF (4 and 20 μg/mL) were chosen in the reversal experiments.
Figure 1. Effects of CF, AF and EAF on intracellular accumulations of adriamycin (Adr), measured by flow cytometry. The accumulation of adriamycin was measured with flow cytometry. Mean ± SD from three independent experiments are shown. 1: MCF-7/Adr untreated(control); 2: MCF-7 untreated; 3: MCF-7/Adr treated with 5 μg/mL verapamil; 4: MCF-7/Adr treated with 4 μg/mL CF; 5: MCF-7/Adr treated with 20 μg/mL CF; 6: MCF-7/Adr treated with 4 μg/mL EAF; 7: MCF-7/Adr treated with 20 μg/mL EAF; 8:MCF-7/Adr treated with 4 μg/mL AF; 9 MCF-7/Adr treated with 20 μg/mL AF. **p < 0.01 versus MCF-7/Adr control cells. CF: chloroform fraction; EAF: ethyl acetate fraction.
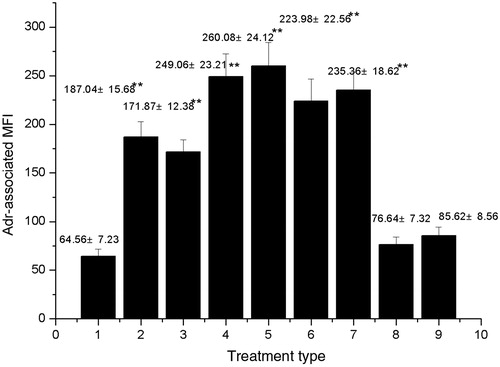
Figure 2. The growth rate of MCF-7/Adr cells with CF and EAF fractions. Cells were incubated with different concentrations of CF and EAF for 48 h and determined by MTT assay. The results are presented as mean ± SD from three independent experiments. CF: chloroform fraction; EAF: ethyl acetate fraction.
The MDR reversal efficacy of CF and EAF fractions
As shown in , CF and EAF fractions significantly enhanced the cytotoxicity of adriamycin to MCF-7/Adr cells in a dose-dependent manner, but they had little effects on that to drug-sensitive MCF-7 cells (data not shown). The RF values of CF and EAF fractions at 20 μg/mL were comparable to that of verapamil at 5 μg/mL on reversing MDR of MCF-7/Adr cells.
Table 3. Effects of CF and EAF fractions on adriamycin cytotoxicity to MCF-7/Adr cells.
Effects of CF and EAF on intracellular accumulation of adriamycin
The accumulation of adriamycin in MCF-7 cells was approximately 2.9-times more than that in MCF-7/Adr cells. After the MCF-7/Adr cells were treated with CF or EAF fractions at 4 and 20 μg/mL, respectively, the intracellular accumulation of adriamycin was markedly increased compared to the control. The intracellular accumulation of adriamycin in 4 μg/mL CF, 20 μg/mL CF, 4 μg/mL EAF, 20 μg/mL EAF and 5 μg/mL verapamil group was 3.97-, 4.21-, 3.61-, 3.83-, and 2.72-fold the control MCF-7/Adr cells group (). The data also indicated that at the same dose, CF fraction is more effective than EAF fraction.
Effects of CF and EAF fractions on intracellular accumulation of Rh123
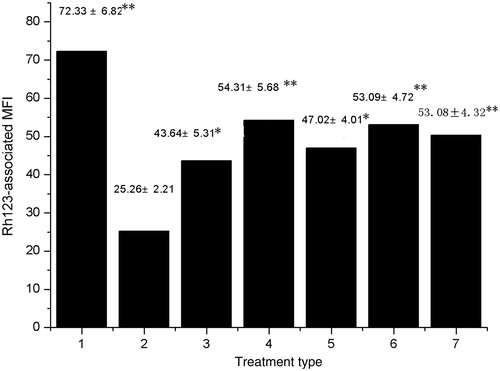
Determining intracellular Rh123-associated MFI was employed to study the effects of CF and EAF fractions on inhibiting P-gp function. As shown in , CF and EAF fractions enhanced intracellular Rh123 accumulation of MCF-7/Adr cells in a concentration-dependent manner. This result is closely similar to CF and EAF`s effects on the intracellular accumulation of adriamycin.
Figure 3. Effect of CF and EAF fractions on the intracellular accumulation of Rh123 in MCF-7/Adr cells. Cells were pretreated with or without CF and EAF for 1 h and then exposed to 5 μM Rh123 for another 1 h. Cellular fluorescence was measured by flow cytometry. 1:MCF-7 untreated; 2: MCF-7/Adr untreated; 3: MCF-7/Adr treated with 4 μg/mL EAF; 4: MCF-7/Adr treated with 20 μg/mL EAF; 5: MCF-7/Adr treated with 4 μg/mL CF; 6: MCF-7/Adr treated with 20 μg/mL CF; 7: MCF-7/Adr treated with 5 μg/mL verapamil. *p < 0.05, **p < 0.01 versus MCF-7/Adr untreated cells. CF: chloroform fraction; EAF: ethyl acetate fraction.
Effects of CF and EAF fractions on the gene transcription of MDR1
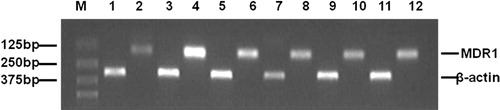
The MDR1 gene encodes the drug efflux pump P-gp, whose over-expression is associated with the MDR phenotype in many selected drug-resistant cell lines. The expression of MDR1 gene was assessed using semi-quantitative RT-PCR, and the relative density metric value was calculated by MDR1 gene expression/β-actin expression. As expected, there was no apparent MDR1 expression in MCF-7 cells, whereas MDR1 expression was clearly observed in MCF-7/Adr cells (). Compared with the relative density metric value of MDR1 gene in untreated MCF-7/Adr cells, the MDR1 gene expression level in MCF-7/Adr cells treated with 4 μg/mL CF, 20 μg/mL CF, 4 μg/mL EAF, 20 μg/mL EAF for 48 h was decreased by 40.17, 48.14, 33.86 or 42.52%, respectively. These results indicated that CF and EAF fractions affected the expression of MDR1 gene in MCF-7/Adr cells.
Figure 4. RT-PCR analysis of MDRI gene expression. The sizes of the specific RT-PCR products were 157 bp for MDR1 and 305 bp for β-actin. M: Marker; 1,2: MCF-7 untreated; 3,4: MCF-7/Adr untreated; 5,6: MCF-7/Adr treated with 4 μg/mL EAF; 7,8: MCF-7/Adr treated with 20 μg/mL EAF; 9,10: MCF-7/Adr treated with 4 μg/mL CF; 11,12: MCF-7/Adr treated with 20 μg/mL CF. CF: chloroform fraction; EAF: ethyl acetate fraction.
Effects of CF and EAF on the abundance of P-gp
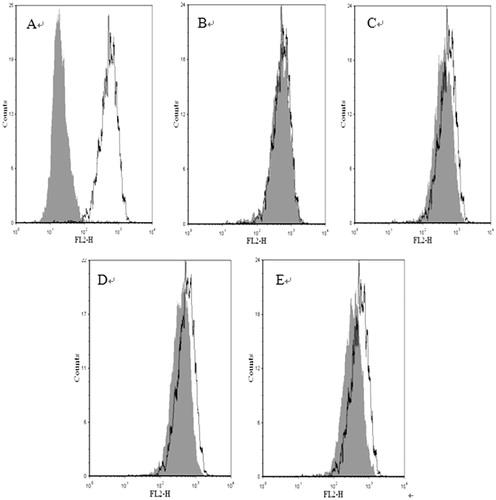
To further confirm if CF and EAF fractions could down-regulate MDR1 gene expression, the abundance of P-gp in MCF-7 cells and MCF-7/Adr cells treated with the two extracts were analyzed by flow cytometry. MCF-7 cells showed virtually fluorescent intensity labeled by immunhistochemical. MCF-7 cells treated with anti-P-glycoprotein monoclonal antibody were used as the blank. MCF-7/Adr cells exhibited stronger fluorescence corresponding to the P-gp. After 48 h incubation with 4 and 20 μg/mL of CF, 4 and 20 μg/mL of EAF, the abundance of P-gp was decreased by 8.63, 24.53, 27.50 or 34.91% in MCF-7/Adr cells, respectively, compared with untreated MCF-7/Adr cells (). These results indicated that CF and EAF could decrease the abundance of P-gp in MCF-7/Adr cells.
Figure 5. P-gp abundance in MCF-7 and MCF-7/Adr cells. Cells were incubated with of CF and EAF fractions for 48 h and P-gp was determined by flow cytometry using FITC-conjugated rabbit anti-human monoclonal antibody against P-gp. A: MCF-7 untreated (left) and MCF-7/Adr untreated (right); B–C: MCF-7/Adr untreated (white background) or with 4, 20 μg/mL of EAF (gray background); D–E: MCF-7/Adr untreated (white background) or with 4, 20 μg/mL of CF (gray background). CF: chloroform fraction; EAF: ethyl acetate fraction.
The HPLC fingerprint of EAF and CF
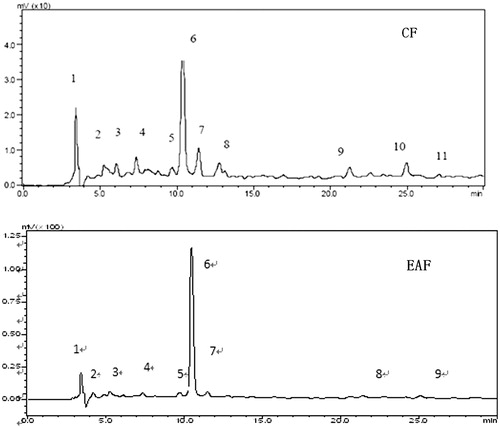
shows the HPLC fingerprint chromatograms of the EAF and CF. On the basis of oridonin standards, the retention time of oridonin is at 10.52 min, which is peak 6 in the fingerprint chromatograms. Quantitative assay results showed that the oridonin in EAF 1.05% and in CF 0.5%. The HPLC fingerprint chromatograms of the EAF and CF show some similarities, area of peak in EAF is less than that of CF, especially those peaks with longer retention time than 11 min. The correlation coefficient of the standard curve was 0.9993, the recovery rate was 98.35% for EAF and 98.73% for CF. the RSD was 3.22% for EAF and 1.86% for CF.
Figure 6. HPLC fingerprints of CF and EAF. CF: chloroform fraction; EAF: ethyl acetate fraction.
Discussion
MDR is one of the major causes for cancer chemotherapeutic treatment failure. The key solution to MDR is to control the high expression of MDR gene in tumor cells (Gottesman, Citation2002; Lee & Swain, 2005). At present, using reversal agents that targeted to P-gp is a principal strategy for developing new drugs (Fojo & Bates, Citation2003). It is of significant clinical importance to screen highly effective drug resistance reversal agents with lower toxicity from natural drugs. It has been reported that some natural drugs have effects on reversing MDR. Their mechanism involved in the inhibition of P-gp efflux function and down-regulation of MDR1 gene expression. This study showed that the CF and EAF fractions from R. rubescens could effectively reverse the MDR of tumor cells MCF-7/Adr cells in vitro.
Rabdosia rubescens is one of the most widely used folk medicines in China. It is widely used in Chinese to treat stomachache, pharyngitis, sore throat and cough. It has also been used as a supplement for the treatment of many different cancers, such as esophagus, cardia, mammary gland, liver and prostate cancers in the last 30 years. The adjuvant therapy mechanism of R. rubescens was considered mainly based on the cytotoxic effect or induced cell apoptosis (Li et al., Citation2011). Studies showed that oridonin extracted from R. rubescens could increase the accumulation of daunorubicin and down-regulate P-gp expressed in K562/A02 cells (Guo et al., Citation2002). Our research showed that the effect component of R. rubescens that has MDR reverse effect on MCF-7/Adr cells is in the fractions of CF and EAF. Thus, its adjunctive treatment effect on tumors may have a multipath effect.
Cell toxicity experimental results showed that R. rubescens had low toxicity on MCF-7/Adr cells, the nontoxicity concentration of CF and EAF is beyond 40 μg/mL on MCF-7/Adr cells. Adriamycin and Rh123 accumulation experiments indicated that CF and EAF fractions could concentration-dependently enhance the accumulation of intracellular adriamycin and Rh123, and inhibit the efflux of Rh123. In contrast, they did not affect that of sensitive MCF-7 cells. So, the active ingredient inside the R. rubescens is a potential reversal agent with low toxicity.
Conclusion
In conclusion, our results show that CF and EAF fractions of R. rubescens extract can reverse adriamycin resistance in MCF-7/Adr cells at non-toxic concentrations. Its mechanism is relevant with the inhibition of the function of P-gp and expression of MDR1 gene. However, further work is still needed to separate and purify the effective components of CF and EAF, and finally find out the active ingredients of the reversing MDR agents in R. rubescens.
Declaration of interest
This study was supported by the Natural Science foundation of Shaanxi Province of China (2012JM4010) and the Fundamental Research Funds for the Central Universities of China (GK261001001).
Related Research Data
References
- Bai N, He K, Zhou Z, et al. (2010). Flavonoids from Rabdosia rubescens exert anti-inflammatory and growth inhibitory effect against human leukemia HL-60 cells. Food Chem 122:831–5
- Chen L, Liang Y, Ruan J, et al. (2004). Reversal of P-gp mediated multidrug resistance in vitro and in vivo by FG020318. J Pharm Pharmacol 56:1061–6
- China Pharmacopoeia Committee. (2010). Pharmacopoeia of the People s Republic of China. Beijing: China Medical Science Press, 106
- Fojo T, Bates S. (2003). Strategies for reversing drug resistance. Oncogene 22:7512–23
- Fu L, Liang Y, Deng L, et al. (2004). Characterization of tetrandrine, a potent inhibitor of P-glycoprotein-mediated multidrug resistance. Cancer Chemoth Pharm 53:349–56
- Gao A, Wang X, Xiang W, et al. (2010). Reversal of P-glycoprotein-mediated multidrug resistance in vitro by doramectin and nemadectin. J Pharm Pharmacol 62:393–9
- Gottesman MM. (2002). Mechanisms of cancer drug resistance. Annu Rev Med 53:615–27
- Guo J, Pan X, Feng C, Zou J. (2002). Study on reversal effects of oridonin on multidrug resistant cell line K562/A02. Shanghai Med J 25:43–5
- Hsieh T, Wijeratne EK, Liang J, et al. (2005). Differential control of growth, cell cycle progression, and expression of NF-κB in human breast cancer cells MCF-7, MCF-10A, and MDA-MB-231 by ponicidin and oridonin, diterpenoids from the Chinese herb Rabdosia rubescens. Biochem Biophys Res Commun 337:224–31
- Huang M, Jin J, Sun H, Liu GT. (2008). Reversal of P-glycoprotein-mediated multidrug resistance of cancer cells by five schizandrins isolated from the Chinese herb Fructus Schizandrae. Cancer Chemoth Pharm 62:1015–26
- Ji BS, He L, Liu GQ. (2005). Reversal of p-glycoprotein-mediated multidrug resistance by CJX1, an amlodipine derivative, in doxorubicin-resistant human myelogenous leukemia (K562/DOX) cells. Life Sci 77:2221–32
- Kang N, Zhang JH, Qiu F, et al. (2010). Inhibition of EGFR signaling augments oridonin-induced apoptosis in human laryngeal cancer cells via enhancing oxidative stress coincident with activation of both the intrinsic and extrinsic apoptotic pathways. Cancer Lett 294:147–58
- Krishna R, Mayer LD. (2000). Multidrug resistance (MDR) in cancer: Mechanisms, reversal using modulators of MDR and the role of MDR modulators in influencing the pharmacokinetics of anticancer drugs. Eur J Pharm Sci 11:265–83
- Lage H. (2003). ABC-transporters: Implications on drug resistance from microorganisms to human cancers. Int J Antimicrob Ag 22:188–99
- Lee JJ, Swain SM. (2005b). Development of novel chemotherapeutic agents to evade the mechanisms of multidrug resistance (MDR). Semin Oncol 32:22–6
- Li C, Wang E, Cheng Y, Bao J. (2011). Oridonin: An active diterpenoid targeting cell cycle arrest, apoptotic and autophagic pathways for cancer therapeutics. Int J Biochem Cell B 43:701–4
- Ling V. (1997). Multidrug resistance: Molecular mechanisms and clinical relevance. Cancer Chemoth Pharm 40:3–8
- Lu Y, Sun C, Liu R, Pan Y. (2007). Effective two-dimensional counter-current chromatographic method for simultaneous isolation and purification of oridonin and ponicidin from the crude extract of Rabdosia rubescens. J Chromatogr A 1146:125–30
- Perloff MD, Störmer E, von Moltke LL, Greenblatt DJ. (2003). Rapid assessment of P-glycoprotein inhibition and induction in vitro. Pharm Res 20:1177–83
- Schwarz RE, Donohue CA, Sadava D, Kane SE. (2003). Pancreatic cancer in vitro toxicity mediated by Chinese herbs SPES and PC-SPES: Implications for monotherapy and combination treatment. Cancer Lett 189:59–68
- Seiden MV, Swenerton KD, Matulonis U, et al. (2002). A phase II study of the MDR inhibitor biricodar (INCEL, VX-710) and paclitaxel in women with advanced ovarian cancer refractory to paclitaxel therapy. Gynecol Oncol 86:302–10
- Shi L, Ma R, Lu R, et al. (2008). Reversal effect of tyroservatide (YSV) tripeptide on multi-drug resistance in resistant human hepatocellular carcinoma cell line BEL-7402/5-FU. Cancer Lett 269:101–10
- Szakacs G, Varadi A, Özvegy-Laczka C, Sarkadi B. (2008). The role of ABC transporters in drug absorption, distribution, metabolism, excretion and toxicity (ADME–Tox). Drug Discov Today 13:379–93
- Theis JGW, Chan HSL, Greenberg ML, et al. (2000). Assessment of systemic toxicity in children receiving chemotherapy with cyclosporine for sarcoma. Med Pediatr Oncol 34:242–9
- Tiwari AK, Sodani K, Wang SR, et al. (2009). Nilotinib (AMN107, Tasigna®) reverses multidrug resistance by inhibiting the activity of the ABCB1/Pgp and ABCG2/BCRP/MXR transporters. Biochem Pharmacol 78:153–61
- Tsuruo T, Iida H, Tsukagoshi S, Sakurai Y. (1981). Overcoming of vincristine resistance in P388 leukemia in vivo and in vitro through enhanced cytotoxicity of vincristine and vinblastine by verapamil. Cancer Res 41:1967–72
- Watt PM. (2006). Screening for peptide drugs from the natural repertoire of biodiverse protein folds. Nat Biotechnol 24:177–83
- Xiao Y, Wang W. (2011). Empirical study of reverse effect on mediated multidrug resistance of U-2OS/ADM cells with curcumin in vitro. J Hyg Res 40:103--6
- Xu Y, Xue Y, Wang Y, et al. (2009). Multiple-modulation effects of oridonin on the production of proinflammatory cytokines and neurotrophic factors in LPS-activated microglia. Int Immunopharmacol 9:360–5
- Xu J, Yang JY, Ran Q, et al. (2008). Synthesis and biological evaluation of novel 1-O- and 14-O-derivatives of oridonin as potential anticancer drug candidates. Bioorg Med Chem Lett 18:4741–4