
Abstract
Context: Curcumin exhibits growth-suppressive activity against a variety of cancer cells, but low bioavailability restricts its application in chemotherapeutic trials. Nowadays, a growing number of curcumin derivatives or analogs are known, hoping to replace curcumin and circumvent this problem. Hydrazinobenzoylcurcumin (HBC) has been synthesized and identified as a potent inhibitor of cell proliferation in previous reports.
Objective: This study presents a novel mechanism of cell autophagy induced by HBC in the human non-small lung epithelial carcinoma (A549) cells.
Materials and methods: Cells were cultured and treated with HBC at different concentrations (10–80 μM) and at different time periods (1–24 h). Microscopic analysis was used to detect the morphology changes and autophagolysosomes of A549 cells. An acridine orange staining assay was conducted to evaluate the autophagolysosomes and autophagic vacuoles was analyzed by monodansylcadaverine (MDC) and GFP-LC3 transfection analysis. Western blotting was used to assess the conversion of microtubule-associated protein light chain 3 (LC3).
Results: HBC could induce A549 cells autophagolysosomes formation in a dose and time-dependent manner and the inhibitory rate of HBC (80 μM) on the viability of A549 cells reached 76.68 ± 5.81% after 24 h of treatment. Autophagic vacuoles increased in a concentration-dependent manner in HBC-treated cell. Furthermore, conversion of LC3-I to LC3-II, accumulation of GFP-tagged LC3 positive intracellular vacuoles and increased fusion of autophagosomes with lysosomes suggested the occurrence of autophagy.
Conclusion: Our data indicate that HBC induced A549 cell autophagy, which is a novel cell death mechanism induced by curcumin derivatives.
Introduction
Autophagy, also known as type II programmed cell death, has been described as a distinct form of cell death that differs from apoptosis (or type I programmed cell death) and necrosis. It is characterized by the formation of autophagic vacuoles in the cytoplasm (Le Grand et al., Citation2011; Lee et al., Citation2011, Citation2012) and is one part of cellular homeostasis mechanisms wherein cytoplasmic organelles and macromolecules are sequestered by a double-membrane vesicular autophagosome under any kind of cellular stress, which fused with lysosomes, forming an autophagolysosome and ultimately degraded the organelles or macromolecules within the vesicle by lysosomal enzymes (Alva et al., Citation2004; Lee et al., Citation2012). Although autophagy normally promotes cell survival, inappropriate hyperactivation of autophagy can lead to non-apoptotic programmed cell death (Choi, Citation2012; Levine, Citation2007). As an important mediator of pathological responses, more attention had been paid on the cell autophagy, especially cancer cell research (Chen et al., Citation2009; Gurusamy & Das, Citation2009; Wang et al., Citation2011).
Curcumin (diferuloylmethane) is a yellow-colored polyphenol, identified as 1,6-heptadiene-3,5-dione-1,7-bis(4-hydroxy-3-methoxyphenyl)-(1 E,6 E). Accumulated evidence suggests that curcumin is a potential chemopreventive agent that could suppress tumor initiation, promotion and metastasis (Aggarwal et al., Citation2003). Consumption of turmeric and curcumin has been associated with beneficial effects on human health. Nevertheless, low stability and a poor pharmacokinetic profile significantly limit its chemotherapeutic applications. One strategy for circumventing this problem could be the creation of synthetic analogs. There were several reports on the new synthetic analogs or derivatives of curcumin to enhance the anti-proliferation activity (Faião-Flores et al., Citation2013; Kumaravel et al., Citation2012; Xiao et al., Citation2012), but these analogs generally led to cancer cell death via the apoptosis pathway.
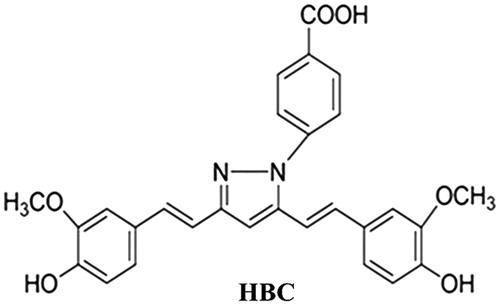
Hydrazinobenzoylcurcumin (HBC) () is one type of curcumin derivative that has been synthesized and identified as a potent inhibitor of cell proliferation (Shim et al., Citation2002), while the specific mechanism of inducing cell death has not been elucidated. Here, we tested HBC for anti-proliferation and antiagiogenic properties in human non-small lung epithelial carcinoma cancer cells (A549). Furthermore, acridine orange staining assay and monodansylcadaverine (MDC) fluorescence analyses were used to monitor autophagolysosomes and autophagic vacuoles, respectively. Western blotting was applied to capture the conversion of LC3-I to LC3-II in HBC-treated A549 cells. Also, the GFP-LC3 recombinant expression vector was transfected into A549 cells for detecting the recruitment of LC3 to autophagic vesicles after HBC treatment. Taken together, we demonstrated that autophagy was an important process involved in HBC-induced cell death.
Figure 1. The chemical structure of HBC. It has a molecular formula C28H24N2O6 with a molecular weight of 484.16 g/mol.
Materials and methods
Chemicals and cells
HBC was synthesized and identified according to a previous reference (Shim et al., Citation2002) and then dissolved in DMSO (stock solution concentration of 0.1 M). The GFP-LC3 eukaryotic recombinant vector was constructed according to the previous report (Zhou et al., Citation2012). A549 cells were kept in our lab, which were cultured in RPMI-1640 medium (GIBCO) supplemented with 10% fetal bovine serum (FBS, Hyclone Laboratories Inc., Logan, UT), in a humidified atmosphere containing 5% CO2 at 37 °C. Cells were grown in tissue culture flasks until they were 80% confluent.
Cell proliferation assay
Cells were plated in 24-well culture plates (Corning) and treated with HBC at different concentrations (10, 20, 40 and 80 μM) and different time periods (from 1 to 24 h). Cellular morphology was observed by Olympus inverted microscope model Nikon Eclipse TS100 (Tokyo, Japan). All the experiments were done in triplicate.
Cell viability assay
Cells were plated in 96-well culture plates and the viability of A549 cells were measured by MTT (3-(4,5-dimethylthiazolyl-2)-2,5-diphenyltetrazolium bromide) assay. A549 cells were treated with HBC at different time periods with the indicated concentrations (0–80 μM). MTT (5 mg/ml) was dissolved in PBS and filter sterilized, then the prepared solution (20 μL) was added to each well and cells were incubated until a purple precipitate was visible. Finally, the plate was placed in the dark for 4 h at 37 °C and DMSO (100 μL) was added. The absorbance was measured on an ELISA reader (BioTek, Winooski, VT) at a test wavelength of 490 nm. Percentage of cell viability was calculated by the following formula: (%) cell viability =[100 − At/As × 100]% (At and As indicated the absorbance of the test substances and solvent control, respectively).
Acridine orange staining
Autophagy is the process of sequestering cytoplasmic proteins into the lytic component and is characterized by the formation and promotion of acidic vesicular organelles (AVOs) (Acharya et al., Citation2011; Wang et al., Citation2012). To detect the development of AVOs, A549 cells were treated with various concentrations of HBC for different lengths of time, and then cells were stained with acridine orange (5 μg/mL) for 40 s at room temperature. Fluorescent micrographs were taken with an Olympus Eclapse TE 2000-u (Japan).
Monodansylcadaverine labeling assay
The autofluorescent agent monodansylcadaverine (MDC) was recently introduced as a specific autophagolysosome marker to analyze autophagy (Liu et al., Citation2009). A549 cells were seeded in 24-well culture plates. After treatment with HBC at identical concentrations and time, cells were incubated for 10 min with MDC (50 μM) at 37 °C and imaged by fluorescence microscopy with a 380 nm excitation filter.
Fluorescence microscopy analysis
To detect the autophagosomes, A549 cells were first transfected with GFP-LC3 recombinant DNA for 24 h according to the protocol of X-tremeGENE HP Transfection Reagent (Roche, Indianapolis, IN), and then cells were treated with 40 μM HBC for 12 h, and incubated with LysoTracker Red (1 mM, Invitrogen, Carlsbad, CA) for 30 min and rinsed several times with PBS. The fluorescence of GFP-LC3 was observed under a fluorescence microscope. To quantify autophagic cells after HBC treatment, the number of autophagic cells demonstrating fluorescent dots (≥10 dots/cell) was counted among 200 LC3-overexpressing cells.
Western blotting
A549 cells were grown on culture dishes (60 mm) in the presence of HBC (0–40 μM) for 24 h. Cells were harvested and extracted in cold lysis buffer (150 mM NaCl, 1% NP-40, 20 mM Tris-HCl, 20 μg/ml aprotinin, 20 μg/ml leupeptin, 1 mM orthovanadate, 2 mM PMSF, pH 7.4). Protein concentrations were estimated by the Bradford method. Proteins were subjected to SDS-PAGE and further transferred to nitrocellulose membranes (Immobilon™-Ny+), which were then incubated with anti-LC3B or anti-Tublin antibody. Secondary antibodies were alkaline phosphatase-conjugated IgG. Membranes were finally incubated by NBT/BCIP solution (Boster). A computer-based Image Analysis program (ImageJ2×) was used to quantify the intensity of each band. Intensity data was represented as the fold increase or decrease with respect to control bands.
Statistical analysis
The data were expressed as means ± SD and statistical analysis was performed with the two-tailed Student’s test. Degrees of significance are indicated by p ≤ 0.05 (*) and p ≤ 0.01 (**).
Results
HBC decreased cell viability in A549 cells
To evaluate the anti-proliferation effect of HBC, A549 cells were treated with different concentrations and at different time periods with HBC while DMSO was the control in all experiments. Microscopic analysis showed that the cellular morphology began to change upon treatment for 1 h (). With the increase in concentration and time, cells became more rounded in appearance and more vacuoles appeared. When incubated with HBC (80 μM) for 24 h, most of the A549 cells detached from the substratum ().
Figure 2. (A) Alteration of cellular morphology upon HBC treatment. Images showed HBC-treated A549 cells at different concentrations and time points. (B) Effects of HBC on viability of A549 cells. A549 cells were followed exposure to various concentrations of HBC at different periods and cell viability was analyzed with the MTT assay. Values were given as mean ± SE; **p ≤ 0.05 (n = 6).
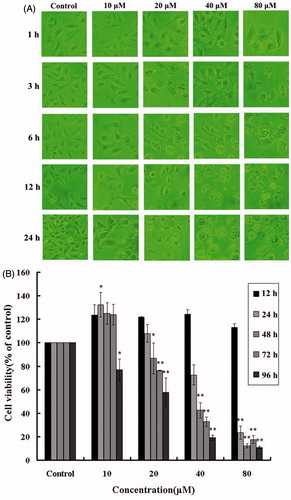
The MTT assay was carried out to assess the effect of HBC on A549 cells viability. In low concentrations and short time of HBC incubation, A549 cells propagated so quickly that the growth rate of A549 cells had reached 32.43 ± 5.78% when treated with HBC (10 μM) for 24 h. But HBC at high concentrations could lead to a marked growth inhibition and a significant decrease in A549 cell viability. From , we could find that the inhibitory rate came to 27.43 ± 2.40% and 76.68 ± 5.81% with HBC incubation (40 and 80 μM) for 24 h, respectively, while the cell inhibition rate of curcumin (80 μM) reached only 17.23 ± 7.57%.
HBC induced acidic vacuole formation in A549 cells
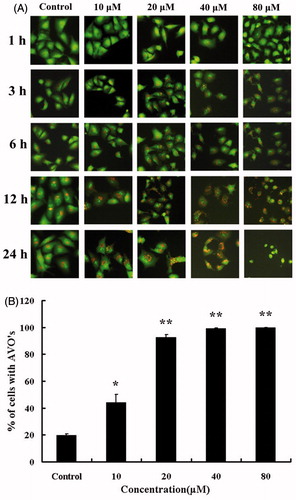
Acridine orange can make the cytoplasm and nuclei with dark red and light green, respectively. During authophagy, autophagosomes fuse with lysosomes to form autophagolysosomes (Acharya et al., Citation2011; Wang et al., Citation2012). Autophagolysosomes could be dyed by acridine-orange which produced the red fluorescence. Our current research showed a concentration-dependent increase of red fluorescent structures in A549 cells after HBC treating for 24 h (), which was the evidence of AVO formation. Also, the percentage of HBC-treated cells with AVOs was counted among 100 cells, which existed increasing in a concentration-dependent manner at 24 h ().
Figure 3. Microscopic detection of AVOs in HBC-A549 cells. Cells were incubated with various concentrations of HBC for different times and stained with acridine-orange. (A) Images were taken with a fluorescence microscope. (B) The percentage of AVO formation was plotted at the different concentrations of HBC. HBC-treaded cells were counted for 100 cells, and more than three areas were selected at random. Data are the means of triplicate experiments; error bars, SE (*p ≤ 0.05, ** p ≤ 0.01).
Wortmannin inhibited HBC-induced A549 cell autophagy
Monodansylcadaverine (MDC) could accumulate in mature autophagic vacuoles and is usually used to detect autophagic vacuoles (Munafo & Colombo, Citation2011). HBC treatment (24 h) resulted in an increase of MDC fluorescences in a concentration-dependent manner, while wortmannin, a PI3K kinase inhibitor, could decrease the intensity of fluoresence at the concentration of 100 nM ().
Figure 4. (A–J) Determination of autophagosomes punctuates by MDC. The fluorescence images of MDC fluorescence were taken by fluorescence microscopy. (K). The effect of wortmannin on HBC-treated A549 cells viability was determined. Data are presented as means, bars ± SE (n = 3), *p ≤ 0.05, **p ≤ 0.01.
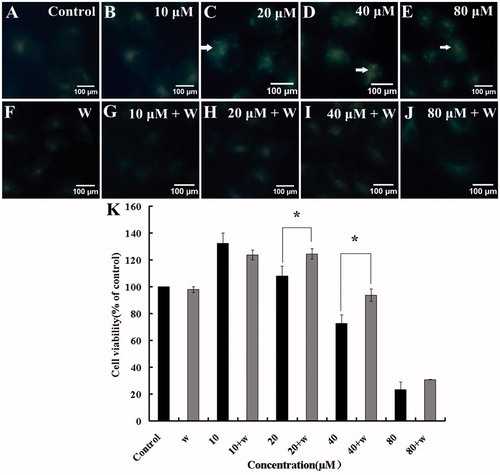
For further investigation, A549 cells were treated with HBC alone or in combination of HBC and wortmannin (100 nM) for 24 h, respectively. And then the MTT assay was used to detect the cell viability. In HBC (20 μM) + W and HBC (40 μM) + W groups, the cell survival rates increased approximately 20 and 30% compared to HBC alone treated group (). It is suggested that the autophagy inhibitor, wortmannin, could inhibit HBC-induced A549 cells autophagy.
HBC increased accumulation of autophagosomes and fusion with lysosomes
During autophagy, LC3-I converts to lipidated LC3-II and associates with the autophagic membrane, which could redistribute from a diffuse cytoplasmic localization to a distinctive puncta cytoplasmic pattern, revealing the recruitment of LC3 to autophagic vesicles (Kabeya et al., Citation2000; Tanida et al., Citation2004). LC3 serves as a marker of the autophagic processes, which can be visualized by transfecting the cells with GFP-LC3 recombinant vector. In order to identify whether the cellular autophagy level was altered in response to HBC, A549 cells were treated with HBC after transfecting with GFP-LC3 plasmid for 24 h. GFP-LC3 recombinant protein was detected as a diffused distribution throughout the cytoplasm in control groups, while upon HBC treatment, GFP-LC3 distributed as perinuclear puncta pattern (). Further quantitative analysis of the percentage of GFP-LC3 fluorescent dot formation cells was performed among the total GFP expressing cells. The result showed that the percentage of cells showing fluorescent dot formation in the HBC-treated group was significantly higher than that in the control group ().
Figure 5. HBC increased formation of autophagosomes and fusion with lysosomes. A549 cells expressing GFP-LC3 were treated with HBC and the accumulation of LC3 II (green), localization of LC3 II with lysosomes (red) staining in response to treatment were analyzed by fluorescence microscopy (Scale bars = 100 μm). (A), (B) and (C) were bright images. (D) A549 cells were transfected with GFP. (E) A549 cells were transfected with GFP-LC3 and treated with DMSO. (F) A549 cells were transfected with GFP-LC3 and treated with HBC. (G–I) A549 cells were stained with LysoTracker Red. (J–L) Green and red images were merged. (M) The percentage of GFP-LC3 dot formation cells was counted in the total GFP expressing cells (n ≥ 3, **p ≤ 0.01).
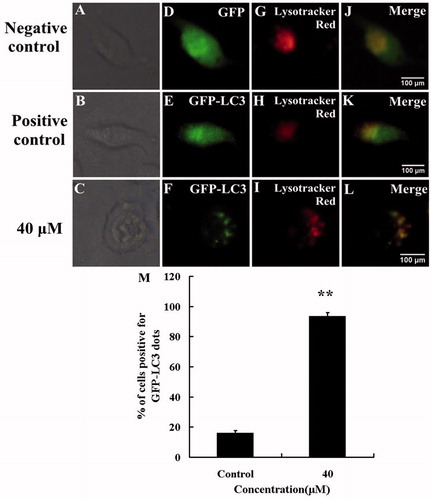
Moreover, HBC increased fusion of LC3-tagged vacuoles with lysosomes, which was confirmed by co-localization of GFP-LC3 with LysoTracker (an organelle-selective, fluorescent probe that labels and tracks acidic organelles) (merged images in ). This demonstrated that HBC increased fusion of autophagosomes with lysosomes, a definitive event in the induction of cellular autophagy.
HBC induced the conversion of LC3-I to LC3-II
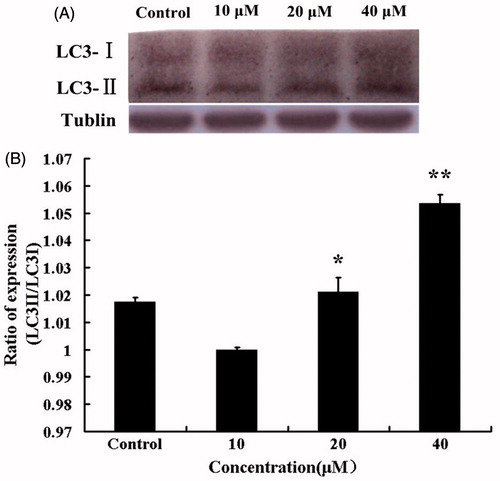
The increased level of LC3-II has been used to represent the autophagy extent (Kabeya et al., Citation2004). In our experiment, lysates of cells treated with DMSO (40 μM) or HBC (10, 20, or 40 μM) for 24 h were subjected to Western blotting analysis. The conversion of LC3-I to LC3-II could be found in . The autophagy level was represented as the ratio of LC3-II to tubulin bands (). The level of LC3-II significantly increased in a dose-dependent manner, which indicated that autophagy was induced after treating A549 cells with HBC.
Figure 6. (A) Western blotting was performed with A549 cells after treatment with HBC (0–40 μM) for 24 h. Tubulin was used as internal control. (B) The ratio of LC3-II to tubulin was calculated to present the autophagic level (n = 3 and *p ≤ 0.05, **p ≤ 0.01).
Discussion
Curcumin and some of its derivatives are known as inhibitors with activities of anti-proliferation, anti-cancer and anti-angiogenesis effects. As one type of curcumin derivative, HBC has been developed and identified for its anti-angiogenic biological activity (Shim et al., Citation2002). In this study, we aim to examine the anti-proliferation mechanism of HBC in A549 cells, especially to confirm autophagy induced by HBC.
Our results showed that A549 cells were protected with low concentrations at short time of HBC treatment, but HBC reduced the A549 cell viability considerably at high concentrations. To elucidate the A549 cell death pathway induced by HBC, acridine-orange staining analysis was done to detect the acidic vacuoles in treated cells, which suggested a concentration-dependent increase of red fluorescent structures for 24 h. Furthermore, HBC treatment (24 h) resulted in an increase of MDC fluorescence in a concentration-dependent manner and it could be abrogated by pre-treating cells with wortmannin (100 nM), a typical autophagy inhibitor (Liu et al., Citation2005; Zhang & Fan, Citation2007). The above results suggested that HBC may lead to A549 cell death via an autophagy pathway.
As a key marker of cell autophagy, LC3 is recruited to the autophagosomal membrane during cell autophagy (Mizushima & Yoshimori, Citation2007). Here, immunofluorescence microscope analysis of A549 cells expressing GFP-LC3 or staining with Lysotracker was preformed. It showed that HBC increased autophagosomes formation and fusion with lysosomes. In order to further confirm that HBC-induced A549 cell autophagy, the lipidated LC3-II was identified by Western blotting analysis, which suggested that HBC could increase LC3-II expression in a dose-dependent manner. Together, these data revealed a novel cell death pathway induced by HBC in A549 cells. However, the definite mechanism of autophagy needs to be done in future work.
Conclusion
HBC could inhibit the proliferation of A549 cells via inducing autophagy. It is different from other curcumin derivatives which mostly induced cell apoptosis. Our study suggested that HBC could be used as a potential therapeutic anti-cancer agent.
Declaration of interest
The authors report no declarations of interest. This work was supported by the National Natural Science Foundation of China (31101931 and 81172240), High-Level Talents Fund from Henan University of Technology (2010BS016), and the Plan for Scientific Innovation Talent of Henan University of Technology (11CXRC13).
Related Research Data
References
- Acharya BR, Bhattacharyya S, Choudhury D, Chakrabarti G. (2011). The microtubule depolymerizing agent naphthazarin induces both apoptosis and autophagy in A549 lung cancer cells. Apoptosis 16:924–39
- Alva AS, Gultekin SH, Baehrecke EH. (2004). Autophagy in human tumors: Cell survival or death? Cell Death Differ 11:1046–8
- Aggarwal BB, Kumar A, Bharti AC. (2003). Anticancer potential of curcumin: Preclinical and clinical studies. Anticancer Res 23:363–98
- Chen Y, Azad MB, Gibson SB. (2009). Superoxide is the major reactive oxygen species regulating autophagy. Cell Death Differ 16:1040–52
- Choi KS. (2012). Autophagy and cancer. Exp Mol Med 44:109–20
- Faião-Flores F, Suarez JA, Maria-Engler SS, et al. (2013). The curcumin analog DM-1 induces apoptotic cell death in melanoma. Tumor Biol 34:1119–29
- Gurusamy N, Das DK. (2009). Autophagy, redox signaling, and ventricular remodeling. Antioxid Redox Signal 11:1975–88
- Kabeya Y, Mizushima N, Ueno T, et al. (2000). LC3, a mammalian homologue of yeast Apg8p, is localized in autophagosome membranes after processing. EMBO J 19:5720–8
- Kabeya Y, Mizushima N, Yamamoto A, et al. (2004). LC3, GABARAP and GATE16 localize to autophagosomal membrane depending on form-II formation. J Cell Sci 117:2805–12
- Kumaravel M, Sankar P, Rukkumani R. (2012). Antiproliferative effect of an analog of curcumin bis-1,7-(2-hydroxyphenyl)-hepta-1,6-diene-3,5-dione in human breast cancer cells. Eur Rev Med Pharmacol Sci 16:1900–7
- Lee J, Giordano S, Zhang JH. (2012). Mitochondria and oxidative stress: Cross-talk and redox signaling. Autophagy 441:523–40
- Lee YJ, Kim NY, Suh YA, Lee C. (2011). Involvement of ROS in curcumin-induced autophagic cell death. Korean J Physiol Pharmacol 15:1–7
- Le Grand JN, Chakrama FZ, Seguin-Py S, et al. (2011). GABARAPL1 antibodies: Target one protein, get one free! Autophagy 7:1098–107
- Levine B. (2007). Cell biology: Autophagy and cancer. Nature 44:745–7
- Liu B, Cheng Y, Zhang B, et al. (2009). Polygonatum cyrtonema lectin induces apoptosis and autophagy in human melanoma A375 cells through a mitochondria-mediated ROS–p38–p53 pathway. Cancer Lett 275:54–60
- Liu Y, Shreder KR, Gai W, et al. (2005). Wortmannin, a widely used phosphoinositide 3-kinase inhibitor, also potently inhibits mammalian polo-like kinase. Chem Biol 11:99–107
- Munafo DB, Colombo MI. (2011). A novel assay to study autophagy: Regulation of autophagosome vacuole size by amino acid deprivation. J Cell Sci 114:3619–29
- Mizushima N, Yoshimori T. (2007). How to interpret LC3 immuno-blotting. Autophagy 3:542–5
- Shim JS, Kim DH, Jung HJ, et al. (2002). Hydrazinocurcumin, a novel synthetic curcumin derivative, is a potent inhibitor of endothelial cell proliferation. Bioorg Med Chem 10:2987–92
- Tanida I, Ueno T, Kominami E. (2004). LC3 conjugation system in mammalian autophagy. Int J Biochem Cell Biol 36:2503–18
- Wang Q, Liang B, Shirwany NA, Zou MH. (2011). 2-Deoxy-d-glucose treatment of endothelial cell induces autophagy by reactive oxygen species-mediated activation of the AMP-activated protein kinase. PLoS One 6:e17234 (1--12)
- Wang Y, Zhou T, Sun HY, Huang B. (2012). Study on the relationship between autophagy and apoptosis in A549 cells induced by curcumin analogue EF24. Chin J Cell Biol 34:590–6
- Xiao J, Wang Y, Peng J, et al. (2012). A synthetic compound, 1,5-bis(2-methoxyphenyl)penta-1,4-dien-3-one (B63), induces apoptosis and activates endoplasmic reticulum stress in non-small cell lung cancer cells. Inter J Cancer 131:1455–65
- Zhou GZ, Jing HJ, Lu YK, et al. (2012). Establishment of the LC3 recombinant vector and its expression in prokaryotic and eukaryotic cells. Biotechnology 22:13–17. (in Chinese)
- Zhang D, Fan D. (2007). Muhidrug resistance in gastric cancer: Recent research advances and ongoing therapeutic challenges. Expert Rev Anticancer Ther 7:1369–78