
Abstract
Context: Initially isolated from fruits of Amorpha fruticosa L. (Fabaceae), amorfrutins are promising antidiabetic natural products as selective peroxisome proliferator-activated receptor γ-agonists.
Objective: The objective of this study is to develop a sensitive and convenient HPLC method to analysis amorfrutins in plant materials derived from genera Amorpha and Glycyrrhiza.
Materials and methods: The reference compounds were isolated from fruits of A. fruticosa and characterized by UV, HR-ESI-MS, and NMR spectrometric techniques. Three amorfrutins were analyzed by HPLC on a Hypersil BDS C18 column (Waters Corporation, Milford, MA) within a gradient elution of acetonitrile and 0.2% glacial acetic acid. HR-ESI-MS spectra were acquired on a quadrupole-time-of-flight (Q-TOF) mass spectrometer.
Results: Three amorfrutins showed good linearity (r2 > 0.999) in the ranges of 4.2–84.5, 4.5–90.2, and 4.6–92.7 μg/mL. The amorfrutins were only detected in fruits of A. fruticosa with the contents of 2-carboxy-3,5-dihydroxy-4-geranylbibenzyl, amorfrutin A, and amorfrutin B in the ranges of 1.31–7.43, 0.54–3.52, and 0.64–4.63 mg/g, respectively. No amorfrutin was detected in fruits of Amorpha canescens Pursh and roots of Glycyrrhiza uralensis Fisch. (Fabaceae), Glycyrrhiza inflate Bat., or Glycyrrhiza glabra L.
Discussion and conclusion: A novel HPLC method was developed, validated, and applied to identify and quantify amorfrutins in complex botanic matrixes and the characteristic MS fragmentation behaviors of amorfrutins were revealed for the first time. The analytical method presented in this study could be used for the quality control of related plant materials and amorfrutin-based nutraceuticals.
Introduction
Over the last few decades, the worldwide prevalence of metabolic diseases such as type 2 diabetes reached an alarming epidemic state, and the global incidence of type 2 diabetes is estimated to shoot up to 366 million in 2030 (Smyth & Heron, Citation2006). The peroxisome proliferator-activated receptor gamma (PPARγ) is a nuclear receptor which plays a key role in glucose and lipid metabolism (Lehrke & Lazar, Citation2005). The widely used antidiabetic thiazolidinediones such as rosiglitazone and pioglitazone are strong PPARγ agonists. Unfortunately, these PPARγ-targeting drugs have been restricted because of undesirable side effects such as weight gain, liver toxicity, and other disorders (Rosen, Citation2010). Given increasing incidences of type 2 diabetes in both developed and developing countries, new strategies are needed for preventing and treating such metabolic diseases.
In recent years, natural products or extracts from edible biomaterials have gained growing interests for their chemical diversity, remarkable health benefits, and satisfactory safety (Muller & Kersten, Citation2003). Several structurally unrelated small molecules derived from edible biomaterials have been observed to interact with PPARγ, such as naringenin (Goldwasser et al., Citation2010), resveratrol (Ulrich et al., Citation2006), punicic acid (Hontecillas et al., Citation2009), and abscisic acid (Guri et al., Citation2007). However, the in vivo molecular and physiological effects of these natural products need to be clarified. Weidner et al. (Citation2012) screened a natural products library consisting of about 8000 pure compounds derived from food ingredients, and a new class of natural PPARγ agonists named amorfrutins was identified from edible parts of two legumes, fruits of Amorpha fruticosa L. (Fabaceae) and roots of Glycyrrhiza foetida Desf. (Fabaceae). In vitro and in vivo tests demonstrated that amorfrutins are promising selective PPARγ agonists with efficient antidiabetic activity seemingly devoid of the adverse effects associated with the application of synthetic PPARγ drugs (de Groot et al., Citation2013; Weidner et al., Citation2012, Citation2013). Moreover, amorfrutins were reported as potent nuclear transcription factor-κB (NF-κB) inhibitors which are able to block NF-κB/DNA binding activity and suppressed the expression of NF-κB target genes (Dat et al., Citation2008). Since the activation of NF-κB is associated with the pathological process of diabetics, the anti-inflammatory activity of amorfrutins may contribute their antidiabetic effects. These findings not only open perspectives for a new generation of nutraceuticals modulating PPARγ but also offer the possibility for using amorfrutins as food additives in the prevention of type 2 diabetes (Lefebvre & Staels, Citation2012).
Amorfrutins were initially isolated in 1981 from fruits of A. fruticosa, an ingredient of some condiments, and amorfrutins A and B were previously reported as antimicrobial agents (Mitscher et al., Citation1981). In addition, amorfrutins were alternatively from edible roots of licorice, G. foetida, which are used as a sweetener and as a traditional herbal medicine (Priya et al., Citation2011; Weidner et al., Citation2012). Although known for more than three decades, only in recent years, the PPARγ modulating and anti-inflammatory properties of these compounds began to be characterized. Because of the increasing interests for amorfrutins as lead compounds for drug discovery and to optimize the procedures leading to amorfrutin-based nutraceuticals, the need for an accurate, convenient, and economical analytical method became obvious. However, no analytical method has been described to reveal the presence of amorfrutins in plant material or natural product. Thus, we wish to report herein a novel HPLC method for the identification and quantification of amorfrutins in complex matrixes from various plant materials.
Materials and methods
Chemicals, reagents, and samples
The reference compounds of 2-carboxy-3,5-dihydroxy-4-geranylbibenzyl (AC), amorfrutin A (AA), and amorfrutin B (AB) were extracted, isolated, and purified from the fruits of A. fruticosa by authors, and their structures were identified by UV, HR-ESI-MS, and NMR spectrometric techniques and comparison with the published data (Dat et al., Citation2008; Mitscher et al., Citation1981). The purity of each compound was more than 98% based on peak area normalization by HPLC-DAD analysis, and their chemical structures are given in . HPLC grade acetonitrile was purchased from TEDIA Co. (Fairfield, OH). Ultra-pure water was obtained from a Milli-Q water system (Millipore, Bedford, MA). All other chemicals and solvents used in this study were of analytical grade. The plant materials were collected from different cultivation regions in China, including fruits of A. fruticosa and A. canescens and roots of G. uralensis, G. inflate and G. glabra. The samples were authenticated by Prof. Hao Zhang of Sichuan University, China. Voucher specimens were deposited at the Department of Medicinal Chemistry, Sichuan Academy of Chinese Medicine Sciences.
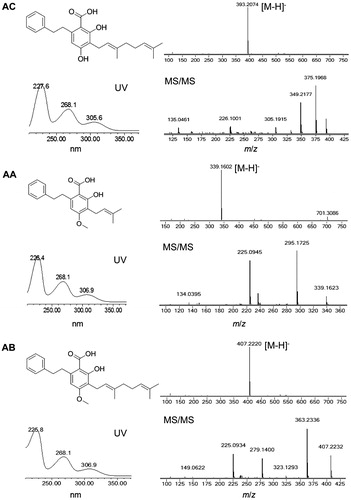
Figure 1. Chemical structures and UV and HR-ESI-MS spectra of three amorfrutins. AC, 2-carboxy-3,5-dihydroxy-4-geranylbibenzyl; AA, amorfrutin A; AB, amorfrutin B.
Instruments and chromatographic conditions
HPLC analysis was performed on a Waters ACQUITY UPLC system (Waters, Milford, MA) equipped with a binary pump, an autosampler, a column oven, and a photodiode array detector. HR-ESI-MS spectra were acquired on an Agilent 6520 quadrupole-time-of-flight (Q-TOF) mass spectrometer (Agilent Technologies, Santa Clara, CA), and the electrospray ionization (ESI) conditions were set as follows: ion mode, negative; dry gas flow, 10 L/min; dry heater, 300 °C; nebulizer pressure, 30 psi; capillary voltage, 3500 V; fragmentor voltage, 135 V; collision voltage, 25 eV.
Amorfrutins were separated on a Thermo Hypersil BDS C18 column (Thermo Fisher Scientific, Waltham, MA) (100 × 4.6 mm i.d., 2.4 μm). The mobile phase consisted of acetonitrile (A) and 0.2% glacial acetic acid in water (v/v, B) using a gradient program of 40% A in 0–1 min, 40–90% A in 1–14 min, 90% A in 14–15 min, 90–40% A in 15–15.5 min followed by 4.5 min re-equilibration for next run. The flow rate was 1.0 mL/min, and the column temperature was maintained at 30 °C. The DAD detector was set at 268 nm for acquiring chromatograms, and the UV absorption spectra were recorded in the range of 210–400 nm.
Preparation of standard solutions
The reference compounds were accurately weighed and dissolved in methanol to produce stock reference solutions. The concentrations of three amorfrutins were 507 μg/mL (AC), 541 μg/mL (AA), and 556 μg/mL (AB). The stock solutions were stored at 4 °C and brought to room temperature before use. Working solutions for calibration curves construction were freshly prepared by appropriate dilution of the stock solutions with methanol.
Preparation of sample solutions
The air-dried plant material was pulverized into powder, and passed through a 60-mesh (0.3 mm) sieve. The ground powders were stored at 4 °C before use. An aliquot of 200 mg of sample was mixed with 4 mL of 80% aqueous methanol (v/v), and the mixture was extracted in an ultrasonic bath (40 kHz, 300 W) at room temperature for 10 min. After each extraction, suspension was centrifuged at 5000 rmp for 10 min. The combined supernatant from two extractions was transferred to a labeled 10 mL volumetric flask and made up with 80% methanol. The sample solution was filtered through a 0.2 -μm membrane filter and an aliquot of 4 μL was injected for HPLC analysis.
Data analysis
All samples were analyzed in triplicate. The results were presented as the means ± standard deviations (SD). Statistical analyses were performed using a one-way analysis of variance ANOVA test (SPSS v.16.0, SPSS Inc., Chicago, IL). The probability value of p < 0.05 was adopted as the criteria for significant differences.
Results and discussion
Selection of chromatographic conditions
Since no analytical method for amorfrutins was reported previously, simultaneous separation and determination of different amorfrutins from complex matrixes were a challenge. In the present study, the resolution of individual amorfrutin was investigated and compared with different reversed phase conditions using a variety of analytical columns such as Shim-pack VP-ODS (Waters Corporation, Milford, MA) (150 × 4.6 mm i.d., 5 μm), Kromasil C18 (Waters Corporation, Milford, MA) (100 × 4.6 mm i.d., 3.5 μm), Hypersil BDS C18 (Waters Corporation, Milford, MA) (100 × 4.6 mm i.d., 2.4 μm), or Waters BEH C18 (Waters Corporation, Milford, MA) (50 × 2.1 mm i.d., 1.7 μm). Mobile phase with acetonitrile had better resolutions, peak shapes and stable baseline than those with methanol. In order to improve the resolutions and peak symmetries, a low concentration of glacial acetic acid was added to restrain the ionization of carboxyl and hydroxyl groups in amorfrutins. The preferred chromatographic condition was found to be using Hypersil BDS C18 column (Waters Corporation, Milford, MA) (100 × 4.6 mm i.d., 2.4 μm) with acetonitrile (A) and 0.2% glacial acetic acid (v/v, B) as the mobile phase. Since the polarity and the solubility of amorfrutins differ greatly, a gradient elution mode was needed for complete separation of the three analytes within a reasonable duration. In the performance of gradient optimization, gradient time, gradient shape, and initial constitute of the mobile phase were taken into consideration. Finally, the gradient program was decided as 40% A in 0–1 min, 40–90% A in 1–14 min, 90% A in 14–15 min, and 90–40% A in 15–15.5 min followed by a re-equilibration of 4.5 min.
In the present study, the UV spectra of the extracts and reference compounds were observed in the range of 210–400 nm. Because of their similar molecular structures, AC, AA, and AB showed similar UV spectra with three maxima at about 226, 268, and 306 nm. Finally, 268 nm was chosen as the detection wavelength because the sensitivities for amorfrutins at 268 nm were higher than those at 306 nm, and the baseline of chromatogram recorded at 268 nm was better than that at 226 nm.
Optimization of sample preparation
Considering the complexity of botanic samples and in order to optimize the extraction efficiency, the extraction parameters such as solvent composition, solvent amount, and extraction time were investigated. The results indicated that methanol, which has good solubility and extraction power for a variety of compounds with different polarities, alone used as extraction solvent was better than ethanol and acetone. However, a significant amount of lipids and lipophilic pigments would be co-extracted as well when using pure methanol as the extraction solvent. In order to reduce lipophilic substances which have strong resistance on C18 column in sample solutions, 80% methanol was preferred to be chosen as the extraction solvent. The effects of extraction time on the content of these target compounds were investigated using 80% methanol as the solvent. The results demonstrated that extraction time (10, 20, or 30 min) had little effect on the recoveries of the analytes. Thus, the duration for single extraction was set as 10 min. No significant different was observed on the extraction efficiency between using methanol and 80% methanol as the solvent if sample was extracted twice.
Method validation of quantitative analysis
A gradient program of HPLC method was developed for separation and quantification of three amorfrutins (AC, AA, and AB) within a single run of 20 min. The representative chromatograms of mixed standards and samples are shown in . The peak purity of individual amorfrutin was confirmed by checking its DAD data in which no indication for impurities was found. Quantification of individual amorfrutin was achieved by the external standard method using the calibration curve obtained with the corresponding reference compound. The retention time, regression equation, linear range, limit of detection (LOD), and quantification (LOQ) of each compound are given in . Each calibration curve was performed by plotting seven different concentrations versus corresponding peak areas. All calibration curves showed good linearity with their correlation coefficients (r2) higher than 0.999. The LOD and LOQ for each analyte were determined by injecting series of standard solutions until the signal-to-noise (S/N) ratio was 3 for LOD and 10 for LOQ. The intra-day repeatability was examined on six individual samples within 1 d, and the inter-day repeatability was determined twice a day for three consecutive days. The relative standard deviations (RSDs) of the contents of the analytes were 0.5–1.8% and 1.1–2.6%, which showed good repeatability of the developed method. The recovery test of the analytes was performed by adding known quantities of standards to known amounts of samples. The fortified samples were then extracted and analyzed with the proposed method. The established analytical method had satisfactory accuracy with the recoveries of AC, AA, and AB in the range of 97.2–101.0%, 97.9–101.2%, and 99.6–103.5%, respectively. The stability was tested with standard solution and sample solution which were stored at room temperature and analyzed every 12 h within 2 d, and the result showed that the analytes were rather stable within 48 h (RSD < 1.5%). These results above indicated that the developed HPLC method was sensitive, precise, and accurate.
Figure 2. HPLC chromatograms of mixed standards (A) and extract of Amorpha fruticosa fruits (B). AC, 2-carboxy-3,5-dihydroxy-4-geranylbibenzyl; AA, amorfrutin A; AB, amorfrutin B.
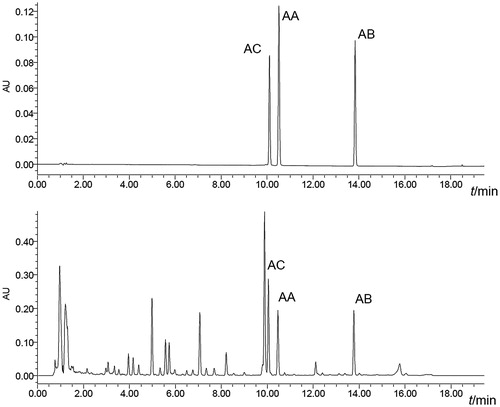
Table 1. Regression equations, correlation coefficients (r2), linear ranges, limits of detection (LOD), and limits of quantification (LOQ) for three amorfrutins.
Qualitative analysis of amorfrutins
The developed HPLC method was applied to identify amorfrutins (AC, AA, and AB) in different plant materials derived from genera Amorpha and Glycyrrhiza. The chromatographic peak of individual amorfrutin was confirmed by comparing its retention time and UV and MS spectrum with those of the corresponding reference compound. The retention time for AC, AA, and AB were 10.11 ± 0.07, 10.52 ± 0.07, and 13.85 ± 0.08 min, respectively. The characteristic UV spectra of AC, AA, and AB with three absorption bands at about 226, 268, and 306 nm were consistent with the published data (Dat et al., Citation2008; Mitscher et al., Citation1981). As depicted in , the HR-ESI-MS spectra gave quasi-molecular ions of AC (m/z 393.2075 [M–H]−, calcd. for C25H29O4 m/z 393.2067), AA (m/z 339.1602 [M–H]−, calcd. for C21H23O4 m/z 339.1597), and AB (m/z 407.2230 [M–H]−, calcd. for C26H31O4 m/z 407.2224). The MS/MS spectra demonstrated characteristic fragmentation behaviors of amorfrutins which was not observed previously: m/z 393 [M–H]− → m/z 349 [(M-H)–CO2]− → m/z 225 [(M–H)–CO2–C9H16]− for AC; m/z 339 [M–H]− → m/z 295 [(M–H)–CO2]− → m/z 225 [(M–H)–CO2–C5H10]− for AA; m/z 407 [M–H]− → m/z 363 [(M–H)–CO2]− → m/z 225 [(M–H)–CO2–C10H18]− for AB. As shown in , AC, AA, and AB were detected only in the fruits of A. fruticosa among the analyzed plant materials. AC was reported as anti-inflammatory agent isolated from the leaves and twigs of A. fruticosa (Dat et al., Citation2008). In this work, the presence of AC in the fruits of A. fruticosa was revealed for the first time. AA and AB were initially isolated from ethanol extract of A. fruticosa fruits for their antimicrobial activities; however, similar extracts from related species, A. canescens and A. nana, were inactive in such screening (Mitscher et al., Citation1981). In the present study, no amorfrutin was detected in the fruits of A. canescens. Additionally, it was reported that amorfrutins were alternatively isolated from the edible roots of licorice, G. foetida, which are traditionally used as a sweetener and as an herbal medicine (Priya et al., Citation2011; Weidner et al., Citation2012). Because G. foetida is native to North Africa and West Asia and unavailable in China, the roots of G. uralensis, G. inflate, and G. glabra which are widely used in food and pharmaceutical industries in China were analyzed as related Glycyrrhiza species (Chinese Pharmacopoeia Commission, Citation2010). However, the results indicated that there was no amorfrutin found in these plant materials.
Table 2. Contents of three amorfrutins in different plant materials (mg/g dry weight)a.
Quantitative analysis of amorfrutins
The contents of AC, AA, and AB in different plant materials were determined by the validated HPLC quantitative method, and the results are given in . Amorfrutins were detected only in the fruits of A. fruticosa, and the contents of AC, AA, and AB were in the range of 1.31–7.43, 0.54–3.52, and 0.64–4.63 mg/g dried plant material, respectively. Significant correlations were observed between the contents of amorfrutins (AC versus AA, r = 0.9987; AC versus AB, r = 0.9970; AA versus AB, r = 0.9992). The contents of AC, AA, or AB accounted for 47.7–54.7% (RSD = 5.4%), 20.8–22.7% (RSD = 3.8%), or 24.5–30.5% (RSD = 8.0%) of their total contents, respectively. The results suggested that the relative abundances of amorfrutins were generally not affected by geographical location, climatic condition, or developmental stage. In addition, the total contents of AC, AA, and AB were in the range of 2.61–15.58 mg/g dried plant material among the analyzed samples. Weidner et al. (Citation2012) reported that the contents of amorfrutins in fruits of A. fruticosa and roots of G. foetida were approximately 0.5 and 3.5 mg/g plant material, respectively. However the composition of amorfrutins was not specified. It was noteworthy that the sample AF-4 collected from Nantong, Jiangsu province of China had the highest total content of amorfrutins (15.58 mg/g dried plant material), which was 3.2-fold higher than that of the second (4.82 mg/g dried plant material). Thus, the sample AF-4 may be considered as a particular and valuable material for breeding new variety for natural amorfrutins. Further investigation will be carried out in the future for better understanding the critical influences on the production and accumulation of amorfrutins.
Conclusion
In conclusion, a novel HPLC method was developed, validated, and applied to identify and quantify amorfrutins in complex botanic matrixes. As we know, no analytical method for amorfrutins was reported to date, and the presence of AC in fruits of A. fruticosa and the characteristic MS fragmentation behaviors of amorfrutins were revealed for the first time. The results indicated that the total contents of amorfrutins (AC, AA, and AB) in the fruits of A. fruticosa ranged from 2.61 to 15.58 mg/g dried plant material. In contrast, no amorfrutin was detected in the fruits of A. canescens, and the roots of G. uralensis, G. inflate, or G. glabra. Based on the growing interests for amorfrutins as antidiabetic and anti-inflammatory agents, the analytical method presented in this study could be used for the quality control of related plant materials and amorfrutin-based nutraceuticals.
Acknowledgements
The authors thank Qing-Miao Li and Xian-Jian Zhou for their help with sample collection.
Declaration of interest
This work was financially supported by the National Natural Science Foundation of China (No. 81202908) and the Basic Scientific Research Foundation of Sichuan Academy of Chinese Medicine Sciences (No. A2012-N29).
References
- Chinese Pharmacopoeia Commission. (2010). Pharmacopoeia of the People’s Republic of China. Beijing: Chinese Medical Science and Technology Press
- Dat NT, Lee JH, Lee K, et al. (2008). Phenolic constituents of Amorpha fruticosa that inhibit NF-κB activation and related gene expression. J Nat Prod 71:1696–700
- de Groot JC, Weidner C, Krausze J, et al. (2013). Structural characterization of amorfrutins bound to the peroxisome proliferator-activated receptor gamma. J Med Chem 56:1535–43
- Goldwasser J, Cohen PY, Yang E, et al. (2010). Transcriptional regulation of human and rat hepatic lipid metabolism by the grapefruit flavonoid naringenin: Role of PPARα, PPARγ and LXRα. PLoS One 5:e12399
- Guri AJ, Hontecillas R, Si H, et al. (2007). Dietary abscisic acid ameliorates glucose tolerance and obesity-related inflammation in db/db mice fed high-fat diets. Clin Nutr 26:107–16
- Hontecillas R, O’Shea M, Einerhand A, et al. (2009). Activation of PPAR gamma and alpha by punicic acid ameliorates glucose tolerance and suppresses obesity-related inflammation. J Am Coll Nutr 28:184–95
- Lefebvre P, Staels B. (2012). Naturally improving insulin resistance with amorfrutins. Proc Natl Acad Sci USA 109:7136–7
- Lehrke M, Lazar MA. (2005). The many faces of PPAR gamma. Cell 123:993–9
- Mitscher LA, Park YH, Al-Shamma A, et al. (1981). Amorfrutin A and B, bibenzyl antimicrobial agents from Amorpha fruticosa. Phytochemistry 20:781–5
- Muller M, Kersten S. (2003). Nutrigenomics: Goals and strategies. Nat Rev Genet 4:315–22
- Priya K, Gupta VRM, Srikanth K. (2011). Natural sweeteners: A complete review. J Pharm Res 4:2034–9
- Rosen CJ. (2010). Revisiting the rosiglitazone story-lessons learned. New Engl J Med 363:803–6
- Smyth S, Heron A. (2006). Diabetes and obesity: The twin epidemics. Nat Med 12:75–80
- Ulrich S, Loitsch SM, Rau O, et al. (2006). Peroxisome proliferator-activated receptor γ as a molecular target of resveratrol-induced modulation of polyamine metabolism. Cancer Res 66:7348–54
- Weidner C, de Groot JC, Prasad A, et al. (2012). Amorfrutins are potent antidiabetic dietary natural products. Proc Natl Acad Sci USA 109:7257–62
- Weidner C, Wowro SJ, Freiwald A, et al. (2013). Amorfrutin B is an efficient natural peroxisome proliferator-activated receptor gamma (PPARγ) agonist with potent glucose-lowering properties. Diabetologia 56:1802–12