
Abstract
Context: Lyoniside is the major constituent of Saraca asoca Linn. (Caesalpiniaceae) bark. There is an immediate need to develop an efficient method to isolate its chemical constituents, since it is a therapeutically important plant.
Objective: A rapid extraction method for lyoniside based on microwave-assisted extraction of S. asoca bark was developed and optimized using response surface methodology (RSM).
Materials and methods: Lyoniside was analyzed and quantified by high-performance liquid chromatography coupled with ultraviolet detection (HPLC-UV). The extraction solvent ratio (%), material solvent ratio (g/ml) and extraction time (min) were optimized using Box–Behnken design (BBD) to obtain the highest extraction efficiency. The optimal conditions were the use of 1:30 material solvent ratio with 70:30 mixture of methanol:water for 10 min duration.
Results: The optimized microwave-assisted extraction yielded 9.4 mg/g of lyoniside content in comparison to reflux extraction under identical conditions which yielded 4.2 mg/g of lyoniside content. Under optimum conditions, the experimental values agreed closely with the predicted values. The analysis of variance (ANOVA) indicated a high goodness-of-fit model and the success of the RSM method for optimizing lyoniside extraction from the bark of S. asoca.
Discussion: All the three variables significantly affected the lyoniside content. Increased polarity of solvent medium enhances the lyoniside yield.
Conclusion: The present study shows the applicability of microwave-assisted extraction in extraction of lyoniside from S. asoca bark.
Introduction
The bark of Saraca asoca Linn. (Caesalpiniaceae), a traditional ayurvedic herbal drug, is used for the treatment of dysmenorrhea. Its ayurvedic formulation, Asokarista (a fermented preparation) is among the top five ayurvedic formulations in India. The main bioactive constituents of S. asoca are lignans, flavonoids, catechin and anthocyanidin. Sadhu et al. (Citation2007) reported five lignan glycosides (lyoniside, nudiposide, 5-methoxy-9 -β-d-xylopyranosyl-(-)-isolariciresinol, icariside E3 and schizandriside) from S. asoca stem bark. Further, Mukherjee et al. (Citation2012) isolated another lignan glycoside, saracoside from S. asoca bark. Mittal et al. (Citation2013) have identified 34 catechin derivatives, 34 flavonoids and 17 other compounds in various parts of S. asoca plant. Ahmad et al. (Citation2015) have isolated 3′,5-dimethoxy epicatechin, 3′-deoxyepicatechin-3-O-β-d-glucopyranoside, 3′-deoxycatechin-3-O-α-l-rhamnopyranoside and epigallocatechin from S. asoca bark. Swamy et al. (Citation2013) showed the cardioprotective activity of alcoholic extract of S. indica bark against cyclophosphamide-induced cardiotoxicity, whereas Arora et al. (Citation2015) have shown significant hepatoprotection against CCl4-induced hepatotoxicity. Yadav et al. (Citation2015) have shown the anti-breast cancer activity of S. indica bark extract along with its safe nature. Recently, Asokan et al. (Citation2015) have studied the in vitro antioxidant activity of S. asoca bark in various assays.
Lyoniside is a xyloside of lyoniresinol, an arylnaphathalene type of lignan, which has a structural similarity to secoisolariciresinol, a precursor of mammalian lignans, enterodiol and enterolactone. Lignans are polyphenolic compounds structurally described by 8–8′ coupling of two phenylpropanoid units (Moss, Citation2000). They occur either in free form or glycosidically linked to a wide variety of different carbohydrates. Some of the plant lignans are metabolized by the colon microflora to the “enterolignans” enterolactone and enterodiol. These enterolignans, also called mammalian lignans, have been reported to possess antiestrogenic, weakly estrogenic, anticarcinogenic, antioxidant and antimicrobial effects (Sicilia et al., Citation2003; Smeds et al., Citation2007).
Recently, several new techniques have been described for efficient extraction of secondary metabolites from complex herbal matrices, i.e., supercritical fluid extraction (Ghoreishi et al., Citation2012), ultrasonic-assisted extraction (Gu et al., Citation2005), accelerated solvent extraction (Cicchetti & Chaintreau, Citation2009), pressurized hot water extraction (Li-Chun et al., Citation2012a,b), microwave-assisted extraction (Delazar et al., Citation2012; Gallo et al., Citation2010; Tomaniová et al., Citation1998). Among all of them, microwave-assisted extraction is quite suitable for extraction of polar metabolites, since it requires a solvent with high dielectric constant.
Further, the variables to be used for extraction of lyoniside were optimized using Box–Behnken method combined with response surface methodology. Box and Wilson introduced response surface methodology (RSM) in 1951 and Montgomery further evolved it (Myers et al., Citation2004). It consists of processing the process optimization work. Originally, it was defined as a statistical technique for multiple regression analysis, which uses data acquired from prior designed experiments for solving multivariate equations.
Response surfaces are graphical representations of these equations, used to explain the individual and collective effect of the independent variables on the dependent variable (response) and to find out the mutual interactions between the independent variables and their subsequent effect on the dependent variable (response) (Mudahar et al., Citation1989; Wei et al., Citation2012). RSM employs design of experiments techniques (DOE), e.g., central composite design (CCD), Box–Behnken design (BBD), full and fractional factorial designs and regression analysis methods. Design of experiments technique is employed before, during and after the regression analysis to estimate the accuracy of the model.
The most desirable condition for the use of experimental design is smallest number of factor levels. The Box–Behnken design is one such method. It is formed by merging two factorials with balanced incomplete block designs, which considerably decreases the number of experiments. In this system, only 15 experiments are required for a three-factor, three-level study. It consists of replicated center points and the area of interest is a set of points located at the midpoints of edges of the multidimensional cube. It is also suitable for the exploration of quadratic response surfaces and creating a second-order polynomial model (Gaur et al., Citation2014).
In the present work, an efficient method has been developed for enhanced extraction of lyoniside from S. asoca stem bark and its process variables have been optimized using the Box–Behnken design.
Materials and methods
Plant material/chemicals
The dried bark of S. asoca was bought from Global herbs, Khari Baoli, New Delhi (March) and identified by Dr. H.B. Singh, Raw Materials Herbarium & Museum, National Institute of Science Communication and Information Resources, New Delhi. A voucher specimen (PRL/JH/11/11) has been kept in Department of Pharmacognosy and Phytochemistry, Jamia Hamdard, New Delhi, India. The cut pieces were washed in distilled water and dried in shade for 4 days. After that, it was ground to obtain a relatively homogenous powder.
HPLC grade methanol and water were purchased from Merck Chemicals (India). Other chemicals were all of analytical grade from CDH Chemicals (New Delhi, India). Standard of lyoniside was purchased from the Chemfaces Ltd (Wuhan, Peoples’ Republic of China).
Microwave-assisted extraction
Microwave extractor oven (CATA-R) from Catalyst systems (Pune, India) outfitted with a magnetron of 2450 MHz with maximum power of 700 W, a reflux unit, time controller and a stirring device was used.
Initially, 10 g powdered material was refluxed with petroleum ether for 2 h. Then it was mixed with appropriate volume of the extracting solvent, a mixture of methanol and water and placed inside the microwave cavity. Power of irradiation was set and extraction was carried out. During the extraction, solvent volume was maintained by condensing the evaporating solvent. The extraction was stopped after completion of exposure time. The obtained extract was filtered and evaporated in a rotary evaporator.
According to preliminary trials (data not shown), the experimental parameters, i.e., solvent ratio (methanol:water; 90:10, 70:30, 50:50), solid to solvent ratio (1:10, 1:20, 1:30) and 10, 20, 30 min extraction duration were selected for the process. All the samples were prepared and analyzed in triplicate.
Conventional extraction
Reflux extraction was performed as one of the conventional extractions according to the optimal condition determined with microwave-assisted extraction. In brief, 10.0 g drug powder of S. asoca was extracted with 300 ml of 70% methanol as extraction solvent and extraction time of 10 min. This process was repeated for three cycles.
HPLC analysis of lyoniside
The lyoniside quantification in S. asoca was performed with an HPLC instrument (Shimadzu, Kyoto, Japan), equipped with a quaternary solvent delivery system, a column oven and an ultraviolet detector. Separation was achieved on a Lichrospher ODS-C-18 column (4.6 mm × 300 mm, 5 μm, pore size 100 Å) from Phenomenex (Torrance, CA). The column temperature was set at 25 °C and detection wavelength was set at 280 nm. Initially, several solvent ratio were tried, i.e., 50:50, 60:40,40:60, 30:70, 15:85, respectively, of methanol and water with flow rates at 1.5, 1.2, 1.0, 0.8, 0.6, 0.4 ml/min. Final mobile phase was methanol:water (15:85) with a flow rate of 0.6 ml/min. The isocratic elution was employed with 20 μl of injection sample.
Mass analysis of lyoniside
The sample was directly injected in mass spectrometer. Agilents’ LCMS (Model: 6410B) was used with RP-LC Column: C18, 50 mm × 2.1 mm, 1.8 μm particle size and maintained at 40 °C. Mass spectra (MS) detection was achieved using an electrospray ion (ESI) source in positive mode. The ionization source of the MS detector had 4.0 kV capillary voltage, 350 °C source temperature and 9 l/min gas flow rate (both gases were nitrogen). Data were acquired and processed using the MassHunter software (Agilent Technologies, Palo Alto, CA).
Preliminary trials
The extraction of lyoniside was initially attempted using either methanol or water, however, the yield was greatly affected when a mixture of methanol and water was used as an extraction solvent, so 70:30 mixture of methanol and water was taken as 0 level of first independent variable. The variations were taken as ±20% resulting in 50:50 and 90:10 ratio. The yield of extract increases when higher quantity of extraction solvent is used. The ratio of 1:10, 1:20, 1:30 have been selected to make a more feasible combination for extraction. The duration of extraction process is a critical factor. In microwave-assisted extraction processes, higher durations have resulted in diminished yield of compounds due to overheating of the samples, whereas lower durations always risk the incompletion of process. The duration of 10, 20 and 30 min have been selected as three levels of third independent factor, extraction time.
Experimental design
The Box–Behnken design (Design-Expert software, Trial Version 7.1.6, Stat-Ease Inc., Minneapolis, MN) was applied to determine the best combination of extraction variables for the yield of lyoniside in S. asoca. Three extraction variables considered in this investigation were A (Solvent ratio), B (Material to solvent ratio) and C (Extraction time). The proper ranges of the three variables were determined according to single-factor experiments. The whole design consisted of 17 experimental points as listed in . Five replicates (run 13–17) at the center of the design were used for estimating a pure error sum of squares.
Table 1. The Box–Behnken experimental design with the independent variables (actual and coded values).
Data analysis
Data were expressed as standard error of the means (SEM) of three replicated determinations. The response obtained from each set of experimental design was subjected to multiple non-linear regressions using the Design-Expert software (Minneapolis, MN). The quality of the fit of the polynomial model equation expressed by the coefficient was checked by F-test and p value.
Results and discussion
Model fitting
In the present investigation, we selected three main parameters for optimization of the extraction of the lyoniside from S. asoca bark. Furthermore, preliminary trials were carried out in order to establish a more realistic extraction mode. Finally, the ranges of methanol concentration (30–90%), extraction time (10–30 min) and material solvent ratio (10, 20, 30) were fixed. presents the experimental design and corresponding response data for the extraction of lyoniside.
shows the analysis of variance (ANOVA) for the extraction yield of lyoniside from S. asoca using the Box–Behnken design. The Model F-value of 615.02 implies that the model is significant. There is only a 0.01% chance that a “Model F-Value” of this large could occur due to noise. The regression model and contribution of each independent variable is shown in . Values of “Prob > F” less than 0.0500 indicate model terms are significant. In this case, A, B, C, BC, A2, B2, C2 are significant model terms. The “Lack of Fit F-value” of 0.35 implies the lack of fit is not significant relative to the pure error. There is a 79.32% chance that a “lack of fit F-value” of this large could occur due to noise. The “Pred R-squared” of 0.9942 is in reasonable agreement with the “Adj R-squared” of 0.9971. “Adeq Precision” measures the signal-to-noise ratio. A ratio greater than 4 is desirable. The ratio of 89.350 indicates an adequate signal. This model can be used to navigate the design space.
Table 2. Analysis of variance for the fitted quadratic polynomial model of extraction of lyoniside.
Table 3. Estimated regression model of the relationship between extraction yield of lyoniside and independent variables (A, B, C).
Response surface optimization of microwave-assisted extraction conditions
show the effects of the independent variables and their mutual interaction on the extraction yield of lyoniside in S. asoca.
Figure 1. Response surface plot and contour plot showing the effect of solvent ratio (A) and material solvent ratio (B) on lyoniside content.
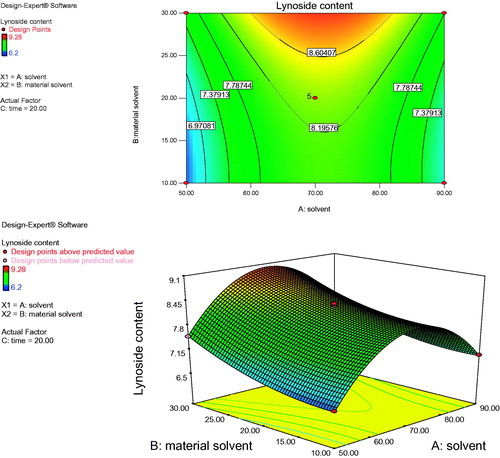
Figure 2. Response surface plot and contour plot showing the effect of solvent ratio (A) and time (C) on lyoniside content.
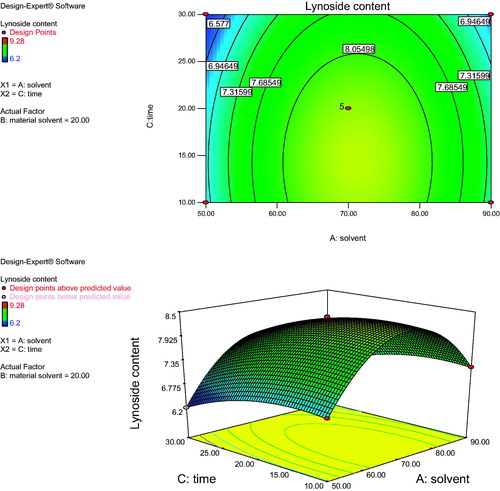
Figure 3. Response surface plot and contour plot showing the effect of material solvent ratio (B) and time (C) on lyoniside content.
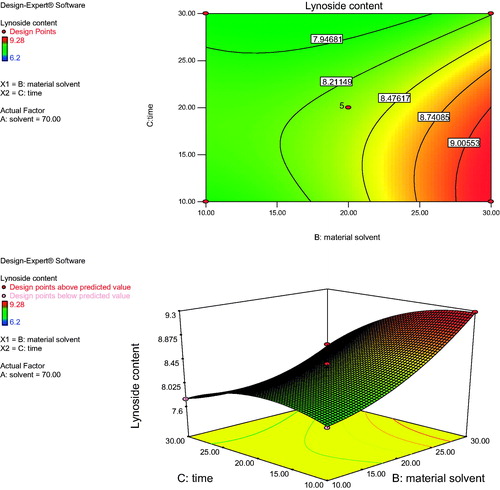
shows the effect of solvent concentration (A) and material solvent ratio (B) on the yield of lyoniside in S. asoca for fixed extraction time. At a definite extraction time, the extraction yield increased with methanol concentration from 50 to 70% and nearly reached a peak at the highest extraction time. However, upon increasing the methanol concentration beyond 70%, there was a gradual decline in the response, and extraction times over 30 min did not show any obvious effect on extraction yield. This result may be explained by the fact that increased methanol content reduces the polarity of solvent, which is unable to extract sufficiently polar lignan glycoside, lyoniside. However, increasing the content of water over a certain value, increases temperature of the extraction medium, further decreasing the content of lyoniside. shows the effect of solvent concentration (A) and extraction time (C) on the yield of lyoniside in S. asoca. As the time increases the content of lyoniside decreases, which could be due to overheating of the material. However, the extraction yield gradually decreased with extraction time over 10 min. It might be possible that increased duration caused the degradation of lyoniside. Further, the developed method was evaluated against conventional extraction (reflux extraction) under identical condition (material solvent ratio, composition of solvent system, time for extraction). Upon increasing the methanol concentration from 50 to 70% with a decrease of extraction time from 30 to 10 min, the extraction yield of lyoniside increased with methanol concentration. shows the effect of the interaction of material solvent ratio (B) and extraction time (C) on the extraction yield. The results indicate that the highest extraction yield could be achieved when using 70% methanol water as the extraction solvent and 10 min as the extraction time.
Optimization of extraction parameters and validation of the model
The best suitable conditions for extraction of lyoniside were selected by using point prediction tool and extraction was done using those selected conditions. The extract obtained after optimized conditions was chromatographed using developed HPLC method and corresponding HPLC chromatogram is shown in . The peak of lyoniside was analyzed by mass analysis. Mass spectra () showed molecular ion peak at m/z 552 and base peak at m/z 420, confirming it to be lyoniside. Other fragments were 217 (32%), 205 (46%), 183 (54%) and 167 (48%). The mass peak at m/z 420 corresponds to the stable aglycone fragment. The agreement between predicted and obtained value also gave the indication of accuracy of the developed method. The obtained values are shown in .
Figure 4. HPLC chromatogram of optimized extract and structure of lyoniside.
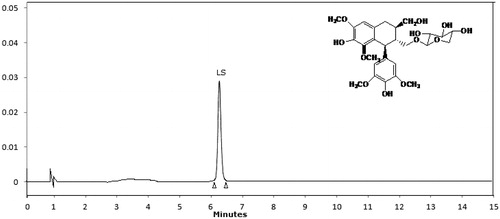
Figure 5. Mass spectra of lyoniside.
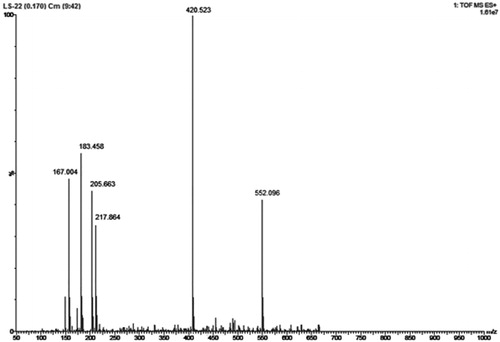
Table 4. Optimum conditions and the predicted and experimental yield at the optimum conditions.
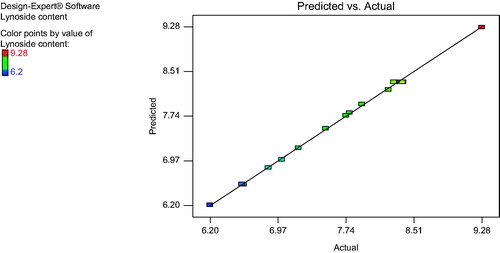
For validation of RSM results, the experimental values of the responses were compared with the anticipated values and the prediction error was found to be +0.13. Linear correlation plot between the actual and the predicted response variable was plotted as shown in .
Figure 6. Correlation plot between the actual and predicted yield of lyoniside content.
Comparison with conventional extraction
Lyoniside has been recently reported from S. asoca bark, so no report has been found on reporting on extraction methods for extracting lyoniside. So the developed method was compared with reflux extraction. The material was refluxed under the same extraction conditions as optimized microwave-assisted extraction. The results indicated that the yield of lyoniside when reflux was used (4.2 mg/g) was significantly lower than when microwave-assisted extraction was used (9.4 mg/g).
In conventional extraction, the heat is transferred from the heating medium to the interior of the sample whereas in microwave-assisted extraction, the heat is dissipated volumetrically inside the irradiated medium. So, the direction of heat transfer and mass transfer are identical in microwave-assisted extraction which further enhances the extraction yield for lyoniside.
Conclusion
Present work indicates the superiority of microwave-assisted extraction over conventional extraction for isolation of lignan, in particular, lyoniside. The use of experimental design further enhances the quality of the process by decreasing the number of trials and effectively utilizing the resources and extraction time.
Declaration of interest
The authors declare that none of the competing interest exists for the article. The authors are solely are responsible for the content and writing of the article.
This work was supported by the grant in aid from Department of Science & technology, Ministry of Home affairs, Government of India (SR/WOS-A/LS-119/2011).
References
- Ahmad F, Misra L, Tewari R, et al. (2015). Anti-inflammatory flavanol glycosides from Saraca asoca bark. Nat Prod Res. [Epub ahead of print]. doi: 10.1080/14786419.2015.1023728
- Arora B, Choudhary M, Arya P, et al. (2015). Hepatoprotective potential of Saraca ashoka (Roxb.) De Wilde bark by carbon tetrachloride induced liver damage in rats. Bull Fac Pharm – Cairo University 53:23–8
- Asokan A, Thangavel M, Nisha P. (2015). In vitro antioxidant activity of Saraca indica methanolic bark extract. Int J Curr Microbiol Appl Sci 4:515–20
- Cicchetti E, Chaintreau A. (2009). Comparison of extraction techniques and modeling of accelerated solvent extraction for the authentication of natural vanilla flavors. J Sep Sci 32:1957–64
- Delazar A, Nahar L, Hamedeyazdan S, et al. (2012). Microwave-assisted extraction in natural products isolation. Methods Mol Biol 864:89–115
- Gallo M, Ferracane R, Graziani G, et al. (2010). Microwave assisted extraction of phenolic compounds from four different spices. Molecules 15:6365–74
- Gaur PK, Mishra S, Kumar A, et al. (2014). Development and optimization of gastroretentive mucoadhesive microspheres of gabapentin by Box–Behnken design. Artif Cells Nanomed Biotechnol 42:167–77
- Ghoreishi SM, Kamali H, Ghaziaskar HS, et al. (2012). Optimization of supercritical extraction of linalyl acetate from lavender via Box–Behnken design. Chem Eng Technol 35:1641–8
- Gu X, Cai J, Zhu X, et al. (2005). Dynamic ultrasound-assisted extraction of polyphenols in tobacco. J Sep Sci 28:2477–81
- Li-Chun ZH, Ying D, Xin Y, et al. (2012a). Response surface modeling and optimization of accelerated solvent extraction of four lignans from Fructus schisandrae. Molecules 17:3618–28
- Li-Chun ZH, Ying D, Xin X, et al. (2012b). Ultrasound-assisted extraction of syringin from the bark of Ilex rotunda Thumb using response surface methodology. Int J Mol Sci 13:7607–16
- Mittal A, Kadyan P, Gahlaut A, et al. (2013). Nontargeted identification of the phenolic and other compounds of Saraca asoca by high performance liquid chromatography – Positive electro-spray ionization and quadrupole time-of-flight mass spectrometry. ISRN Pharmaceutics 2013:293935
- Moss GP. (2000). Nomenclature of lignans and neolignans (IUPAC recommendations 2000). Pure Appl Chem 72:1493–523
- Mudahar GS, Toledo RT, Floros JD, et al. (1989). Optimization of carrot dehydration process using response surface methodology. J Food Sci 54:714–19
- Mukherjee T, Chowdhury S, Kumar A, et al. (2012). Saracoside: A new lignan glycoside from Saraca indica, a potential inhibitor of DNA topoisomerase IB. Nat Prod Comm 7:767–9
- Myers RH, Montgomery DC, Vining GG, et al. (2004). Response surface methodology: A retrospective and literature survey. J Quality Technol 36:53–77
- Sadhu SK, Khatun A, Phattanawasin P, et al. (2007). Lignan glycosides and flavonoids from Saraca asoca with antioxidant activity. J Nat Med 61:480–2
- Sicilia T, Niemeyer HB, Honig DM, et al. (2003). Identification and stereochemical characterization of lignans in flaxseed and pumpkin seeds. Agric Food Chem 51:1181–8
- Smeds AI, Eklund PC, Sjoholm RE, et al. (2007). Quantification of a broad spectrum of lignans in cereals, oilseeds, and nuts. Agric Food Chem 55:1337–46
- Swamy AV, Patel UM, Koti B, et al. (2013). Cardioprotective effect of Saraca indica against cyclophosphamide induced cardiotoxicity in rats: A biochemical, electrocardiographic and histopathological study. Indian J Pharmacol 45:44–8
- Tomaniová M, Hajšlova J, Pavelka Jr J, et al. (1998). Microwave-assisted solvent extraction – A new method for isolation of polynuclear aromatic hydrocarbons from plants. J Chromatogr A 827:21–9
- Wei LZ, Li-Chun S, Yin-Shi L, et al. (2012). Optimization of pressurized liquid extraction of three major acetophenones from Cynanchum bungei using a Box–Behnken design. Int J Mol Sci 13:14533–44
- Yadav NK, Saini KS, Hossain Z, et al. (2015). Saraca indica bark extract shows in vitro antioxidant, antibreast cancer activity and does not exhibit toxicological effects. Oxid Med Cell Longev 2015:205360