
Abstract
Context: Xysmalobium undulatum (L.) Aiton f var. (Asclepiadaceae), commonly known as uzara, is an ethnomedicinally important plant from southern Africa used to treat a variety of ailments. In addition to local use in African Traditional Medicine (ATM), formulations containing uzara have been successfully marketed by a number of pharmaceutical companies. Despite its commercialization, published adequate quality control (QC) protocols are lacking.
Objective: The study was conducted to develop QC protocols for uzara based on chromatographic and spectroscopic techniques.
Materials and methods: High performance thin layer chromatography (HPTLC) and liquid chromatography coupled to mass spectrometry (LC-MS) were used to develop phytochemical fingerprints of ethanolic root extracts of 47 uzara samples collected from eight distinct localities in South Africa. Mid-infrared (MIR) spectroscopy was also explored as a suitable alternative technique for rapid and economic quantification of uzarin.
Results: Adequate chromatographic profiles were obtained using both HPTLC and LC-MS analyses. The chromatographic patterns showed qualitative similarities among plants collected from different locations. The levels of uzarin, the major constituent of uzara, were highly variable between locations, ranging from 17.8 to 139.9 mg/g (dry weight). A good coefficient of determination (R2 = 0.939) and low root mean square error of prediction (RMSEP = 7.9 mg/g) confirmed the accuracy of using MIR-PLS calibration models for the quantification of uzarin.
Discussion and conclusion: Both HPTLC and LC-MS can be used as tools in developing quality control procedures for uzara. MIR in combination with chemometrics provides a fast alternative method for the quantification of uzarin.
Introduction
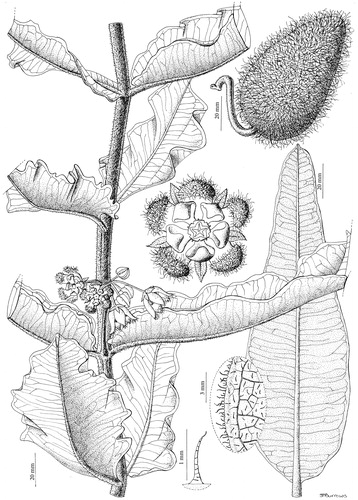
Xysmalobium undulatum (L.) Aiton f var. undulatum (Asclepiadaceae), commonly known as uzara, is also referred to as wild cotton, milk bush or “bitterhout” (Afrikaans) (). This southern African plant grows to 1 m in height and has a strong flowering stem with the opposite leaves discharging milky latex when broken. Traditionally, the plant is used by various local ethnic groups to treat a broad range of diseases. Uzara is used as a remedy for diarrhea and to treat afterbirth cramps, stomach cramps, dysmenorrhea, and headaches, and exhibits a diuretic effect (Van Wyk & Wink, Citation2004). Dried root powder has been applied topically for wound healing and the treatment of sores and abscesses (Steenkamp et al., Citation2004). Xhosa people in the former Transkei area of South Africa administer a decoction of the roots to treat hysteria (Nelson et al., Citation2009).
Figure 1. Line drawing of Xysmalobium undulatum aerial parts (prepared for this publication by Sandra Burrows).
The biological activities of uzara have been reported in several studies (Pedersen et al., Citation2008; Steenkamp et al., Citation2004). The cardenolide cardiac glycosides of uzarigenin and other polar cardenolide glycosides present in root extracts exhibit antidiarrheal activities via an antisecretory mechanism (Schulzke et al., Citation2011). Weak antidepressant activity was exhibited by the ethanolic root (Stafford et al., Citation2005, Citation2008) and leaf extracts in animal models (Pedersen et al., Citation2008; Nielsen et al., Citation2004). Uzara has a digitalis-like effect on the heart in high doses (Schulzke et al., Citation2011) and additive effects may be possible when concomitantly administered with digoxin in patients suffering from cardiovascular disease (Miller et al., Citation2004). Melero et al. (Citation2000) confirmed that the steroidal framework of the glycosides is considered to be the pharmacophoric moiety and those uzara glycosides which have the A/B trans configuration, as opposed to the A/B cis configuration of digitalis like glycosides, exhibit reduced cardiac activity. In South Africa, uzara is formulated as an alcoholic-aqueous root extract to treat acute diarrhea and relieve tension. The plant has been successfully marketed by a German pharmaceutical company (Hemopharm) since 1911 as UZARA® for the latter therapeutic effects.
The chemistry of the plant has been investigated and the roots have been reported to contain various cardenolide cardiac glycosides, the chief compounds being uzarin () and xysmalorin and their isomers allo-uzarin and allo-xysmalorin (Schulzke et al., Citation2011; Van Wyk & Wink, Citation2004). The cardenolide aglycones, uzarigenin and xysmalogenin, are present as minor constituents (Schmelzer, Citation2011). The natural variability of the constituents of botanicals poses a challenge in the quality control (QC) of such products. Most of the work on ethnomedicines focuses on the chemistry and biological activities, while quality control aspects are often neglected.
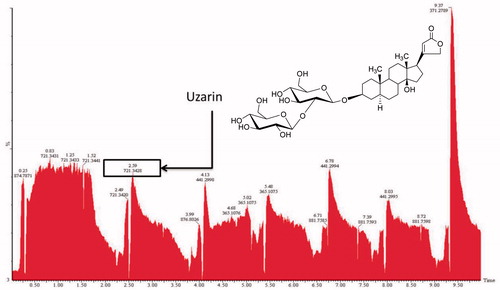
Figure 2. HPTLC-MS chromatogram of Xysmalobium undulatum root extract and the chemical structure of uzarin.
Like many developing countries, South Africa has no official herbal pharmacopoeia that provides monographs of indigenous medicinal plants (Patel et al., Citation2010). The World Health Organisation (WHO) and the Department of Health in South Africa have recommended that all herbal products should be regulated in terms of safety, efficacy, and quality.
Various methods have been used for quality control of herbal products such as thin layer chromatography (TLC), high performance liquid chromatography (HPLC), gas chromatography coupled to mass spectrometry (GC-MS), liquid chromatography-mass spectrometry (LC-MS), and near infrared (NIR) spectroscopy. However, TLC is the most widely used analytical method for the quality control of phytomedicines (Balammal et al., Citation2012). It is surprising that no data on quality control protocols of X. undulatum are available although the plant has been marketed since early in the last century. This lack of suitable analytical methods for quality control prompted an investigation into the possible development of a QC protocol for uzara using chromatographic and spectroscopic techniques.
Materials and methods
Plant material and reagents
A total of 47 uzara root samples were collected from eight different localities in South Africa (). The plant material was identified by A. Viljoen and voucher specimens (1A–11B) were retained in the Department of Pharmaceutical Sciences at the Tshwane University of Technology. The uzarin standard used was previously isolated in our laboratory by column chromatography and the purity confirmed (≥99%) using NMR and LC-MS analysis. Analytical grade ethyl acetate, ethanol, methanol, sulfuric acid, and acetic acid were purchased from Merck (Darmstadt, Germany).
Table 1. Xysmalobium undulatum samples collected from different localities in South Africa and the corresponding uzarin content (mean ± SD) as determined by LC-MS.
Extraction and isolation of uzarin standard
The crude methanolic extract (from the roots of Xysmalobium undulatum) was fractionated by vacuum liquid chromatography using dichloromethane, ethyl acetate, acetone, and methanol successively. The various fractions obtained were in turn concentrated to dryness in vacuo. The ethyl acetate and acetone fractions had similar TLC patterns and were pooled. This fraction was fractionated on silica gel using a gradient of n-hexane, ethyl acetate, and acetone resulting in different fractions. The fractions were subjected to gradient elution on a silica column using toluene-acetone and purified further on silica using the same solvent system. The fraction was also separated on Sephadex LH-20 using methanol-water to obtain pure uzarin detected by the use of H2SO4 spray reagent. Proton Nuclear Magnetic Resonance (1H-NMR) spectra were recorded and a Xevo G2 QToF MS/MS (Water’s Corporation, Milford, MA) was used to acquire the accurate mass.
Sample extraction and preparation
Air-dried uzara roots were ground to fine powder using a ball mill (Retsch GmbH, Haan, Germany). Each sample was weighed (1 g), extracted with ethanol (25 mL) by sonication (Sonorex digital 10 P, Bendelin Electronic, Berlin, Germany) at 35 °C for 20 min at 100% power. The extract was filtered through Whatman No. 1 filter paper and the filtrate was collected. This extraction process was repeated three times with fresh ethanol to maximize the yield, the filtrates were pooled and concentrated to dryness in vacuo. The weight of the dried extracts was recorded. A concentration of 10 and 1 mg/mL in LC-MS grade methanol were used, respectively, for HPTLC and LC-MS analyses. The uzarin standard solution was prepared to yield a final stock concentration of 1 mg/mL.
Qualitative HPTLC analysis
A volume of 2 µL of root extract (10 mg/mL) and the reference standard uzarin (1 mg/mL) were spray-applied onto a glass HPTLC plate silica gel 60 F254 (20 × 10 cm, Merck, Darmstadt, Germany) with a 25 μL Hamilton syringe, connected to nitrogen gas, using a CAMAG automatic TLC Sampler 4. The samples were applied as 8 mm bands, 8 mm from the lower edge and 15 mm from left and right edges of the plate. The plate was developed for 20 min in a saturated ADC2 automatic development chamber with ethyl acetate, methanol, ethanol, and water (8.1:1.1:0.4:0.8, v/v/v/v) as solvent over a distance of 70 mm. The derivatising reagent was prepared by mixing 20 mL acetic acid (99%), 170 mL methanol, 10 mL sulfuric acid (98–100%), and 1 mL of anisaldehyde (Wagner & Bladt, Citation1996). After being developed, the plate was immersed in the derivatising reagent for 1 s using the plate immersion device, and heated at 100 °C for 5 min on a TLC plate heater. The electronic image acquisition Digistore Reprostar system (CAMAG, Muttenz, Switzerland) was used to photograph the derivatized plate in visible mode.
HPTLC–ESI–MS interface
In order to confirm the presence of uzarin in the plant extracts, the TLC-MS interface (CAMAG, Muttenz, Switzerland) was used. The MS was equipped with an electro-spray interface (ESI) operated in a positive ion mode with the following instrumental parameters: the flow rate of 0.1 mL/min; sampling and capillary cone of 45 V and 3500 V, respectively; source and desolvation temperatures at 100 °C and 450 °C, respectively; cone gas flow and desolvation gas flow were 10 L/h and 550 L/h, respectively. The mass range of acquisition was 100–1200 m/z. Data were acquired and processed with MassLynx 4.1 software (Waters Corporation, Milford, MA).
Qualitative LC-MS fingerprinting
Uzara root extract and uzarin standard were analyzed using a Waters Acquity Ultra Performance Liquid Chromatographic system coupled to a PDA detector (Waters, Milford, MA). The chromatographic separation was achieved using an Acquity UPLC BEH C18 column (150 mm × 2.1 mm, i.d., 1.7 μm particle size, Waters Corporation, Milford, MA) interfaced with a Xevo G2QTof MS (Waters Corporation, Milford, MA) at a constant temperature of 40 °C. The mobile phase consisted of 0.1% formic acid in water (A) and acetonitrile (B). The gradient elution was executed as follows: 85% A: 15% B to 65% A: 35% B in 8 min, changed to 50% A: 50% B in 30 s, then maintained for 1 min and then reverted to the initial ratio in 1.5 min with a flow rate of 0.3 mL/min. The injection volume was 2.0 μL (full-loop injection). The positive and negative ion modes were examined and the positive ion mode selected as it showed higher sensitivity. Nitrogen (N2) was used as the desolvation gas. Data were acquired in the mass range of 100 and 1200 m/z. The capillary voltages and the sampling cone voltages were 3500 V and 45 V, respectively. The extraction cone and the source temperature were set at 4 °C and 100 °C, respectively. Other parameters optimized include desolvation temperature at 450 °C; cone gas flow rate at 10 L/h, and desolvation gas flow at 550 L/h. Chromatographic software MassLynx 4.1 (Waters Corporation, Milford, MA) was used to capture and process the chromatographic data.
Quantification of uzarin: method validation
Accuracy
The accuracy of the analytical method was ascertained by recording, in triplicate, the recovery of the standard from study samples using different amounts of the reference standard (uzarin). The sample was spiked with three concentrations (10, 25, and 100 μg/mL) of uzarin. The recovery was calculated for each spiked amount.
Linearity
Eight concentrations (ranging from 0.5 to 100 μg/mL) of uzarin were used to develop the calibration curve by plotting the concentration against peak area. Concentrations against peak area were treated by least-squares linear regression analysis and used to calculate the calibration equation and coefficient of determination.
Limits of detection and quantification
Limits of detection (LOD) and quantification (LOQ) were determined based on the standard deviation of the response and the slope of the calibration plot, using the following equation: LOD = 3.3*(σ/S) and LOQ = 10*(σ/S); where S is the slope of the calibration curve and σ is the standard deviation of the response.
Precision
Intra-day variability was determined for repeatability with low, medium, and high standard concentrations (1, 10, and 100 μg/mL) and inter-day variability was measured for intermediate precision at one concentration of the standard (10 μg/mL) on three different days. The results were expressed as percentage relative standard deviation (%RSD).
Mid-infrared spectroscopy
A small aliquot of uzara root powder was placed on the surface of the attenuated total reflectance (ATR) diamond on the MIR spectrophotometer (Bruker OPTIK GmbH, Ettlingen, Germany). The operating software, OPUS 6.5 (Bruker Optics Inc., Billerica, MA), was used to record the spectral data in absorbance mode from 4000 to 550 cm−1 at 4 cm−1 interval. A total of 32 scans were performed to obtain an average spectrum. A background measurement was performed after every 10 measurements (Sandasi et al., Citation2013).
Chemometric data analysis
Chemometrics is usually applied on a data matrix to filter out meaningful chemical information from complex multivariate data such as those generated in MIR spectroscopy. SIMCA-P + 13.0 (Bruker Optics Inc., Billerica, MA) was used to analyze the generated MIR spectral data with the objective of developing a PLS calibration model to quantify the active constituent uzarin. Principal component analysis (PCA) was applied to the spectral data initially for pattern recognition and any variations observed were noted. Partial least squares regression analysis was used to develop a calibration model between quantitative uzarin data obtained using the LC-MS reference method and MIR spectral data. Different scaling methods (pareto, unit variance (UV), and centre scaling) were investigated on the MIR data. In addition, different spectral filtering methods including multiplicative scatter correction (MSC), standard normal variate (SNV), orthogonal signal correctional (OSC), and derivatives were applied to reduce physical interference in the spectral data. The PLS calibration model was built from a dataset of 40 samples scanned in duplicate where 70% (28) were randomly selected for calibration and 30% (12) for internal validation. To evaluate the goodness of the model, the following parameters were assessed; A is the number of components; R2Xcum is the cumulative X variation modeled from A components; R2Ycum is the cumulative Y variation modeled from A components; Q2cum is the cumulative variation of Y that can be predicted by A components as estimated by cross-validation; R2 is the coefficient of determination; RMSEE is the root mean-square error of estimation; and RMSEP is the root mean-square error of prediction. Seven test samples were introduced into the PLS model to predict uzarin content based on MIR spectra. This was done as an additional step for external validation.
Results and discussion
Qualitative HPTLC fingerprinting
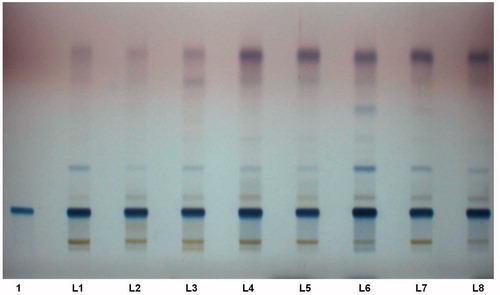
The quality of herbal plant material can be assessed by the chromatographic fingerprint which provides a visible pattern of bands that can be considered fundamental for the identification of a plant species. The consistency and the stability of plant materials are usually determined from the TLC fingerprint and marker compounds play an important role in the fingerprinting of phytomedicines (Balammal et al., Citation2012). The composition of the mobile phase was investigated by testing numerous systems of different polarities. The optimized mobile phase was composed of ethyl acetate, methanol, ethanol, and water (8.1:1.1:0.4:0.8). The HPTLC fingerprint of uzara root obtained after derivatization is shown in . Tracks 2-8 exhibit bands of different colours, including the reference standard uzarin (track 1) that is dominant in all the samples. The eight tracks exhibit a dominant blue spot (Rf value 0.35) that is the major biomarker, uzarin. The results obtained showed that there were no significant qualitative variations between plants collected from the eight different locations, with uzarin identified in all the samples investigated.
Figure 3. HPTLC fingerprints of uzara root extracts observed under white light. L1–L8 represent one collection in each of the eight localities and the reference standard uzarin, in track 1.
Confirmation of uzarin by HPTLC–ESI–MS interface
The mass spectrum presented for the selected band, corresponding to Rf of 0.35, displayed a dominant m/z signal of 721.71 (). The molecular weight of uzarin is 698 and in the mass fragmentation of HPTLC-MS, the molecular weight of uzarin plus sodium confirms the presence of the biomarker in the extract at Rf of 0.35 (). The characteristic MS fragmentation ions (m/z) to confirm uzarin in the extract are 681.35 [M + H–H2O]+, 537.31 [M + H–Glu]+, 519.30 [M + H–Glu–H2O]+, 375.25 [M + H–Glu–Glu]+, 357.24 [M + H–Glu–Glu–H2O]+, and 339.23 [M + H–Glu–Glu–H2O–H2O]+ in the positive mode.
LC-MS chromatographic fingerprint
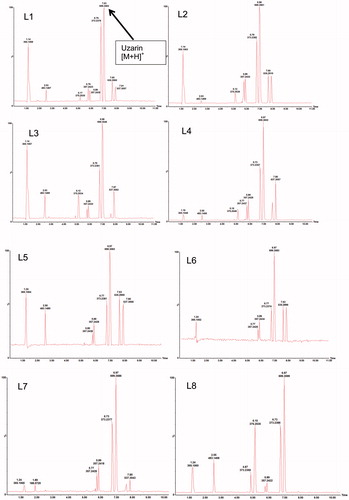
The identity of uzarin was confirmed by LC-MS. The qualitative identification of the major peak was made using the retention time (Rt) at 6.98 min and mass fragmentation pattern (). The LC-MS fingerprint (methanol extract) of uzara representing eight different collections of Xysmalobium undulatum is remarkably similar. As with HPTLC fingerprints, the LC-MS chromatograms exhibit little qualitative variation within and between the eight populations, suggesting a conservative chemical profile for uzara ().
Figure 4. Representative LC-MS chromatograms of uzara root extract from eight populations.
Quantification of uzarin
The calibration curve for uzarin was linear over the concentration range of 0.5–100 μg/mL. Linear regression analysis (y = 3771.79x + 369.39) with a correlation of determination R2 = 0.992 was used to quantify the amount of uzarin in the root extracts. As shown in , the LOQ and LOD are 0.928 and 0.306 μg/mL, respectively. The recovery range was between 99.95% and 103.30% with the %RSD lower than 2% which is within the range reported in previous studies (ICH, Citation2005; Kamatou et al., Citation2012). For both intra-day and inter-day precisions, the variation in the %RSD is less than 2%, indicating that the method is reproducible and precise. The level of uzarin as determined by LC-MS ranged from 17.8 ± 0.03 mg/g to 139.9 ± 0.32 mg/g (n = 3) of dried root from Thaba Chweu (). The variation in the level of uzarin indicates the need for standardization in uzara commercial formulations. The results obtained in this study are, therefore, consistent with those of Brendler et al. (Citation2010) as the level of uzarin is about 5 mg/g dry weight. Wild populations of some plant species have higher levels of phytoconstituents due to the production of secondary metabolites under certain conditions such as stress in their natural environment, and it is these metabolites which are mainly responsible for medicinal properties (Vermaak et al., Citation2010). In this study, the variation in the level of uzarin in samples from different geographical areas could be attributed to factors such as the location, weather, harvesting time, and soil type.
Table 2. Validation results of LC-MS method for quantification of uzarin in Xysmalobium undulatum.
MIR-PLS calibration model for uzarin
A PLS calibration model was developed by regressing MIR spectral data on LC-MS-derived uzarin values. The best model was obtained using pareto scaled and SNV pre-treated spectral data. The quantitative LC-MS values were UV scaled. The whole wavenumber region was included in the model and only the most valuable PLS factors that avoid over- or under-fitting of the model as determined by the Q2 value were used. In this model, only three PLS factors were used and the calibration model () showed good calibration statistics with a high coefficient of determination (R2 = 0.94) and a high predictive ability (Q2 = 0.89). The errors of estimation (RMSEE) and prediction (RMSEP) were obtained as 5.8 and 7.9 mg/g, respectively, by cross validation. External validation of the model was performed by introducing seven test samples into the model and the results are presented in . All seven samples were accurately predicted to contain uzarin levels close to those determined by the LC-MS reference method. The statistical accuracy of the predictions was assessed using the values of model membership probability (PModXPS+), which was superior to 0.05 and distance to the model (DModXPS+), less than 1.2. As reported in , the PModXPS+ and DModXPS+ values were within the critical limits and confirmed the accuracy of predicting the external samples. The cost associated with the FT-MIR is approximately 90% lower than the costs associated with LC-MS. The results obtained clearly support the possibility of using FT-MIR to determine the concentration of uzarin in X. undulatum raw materials and can, therefore, be used for routine quality control.
Figure 5. PLS calibration plot of quantitative LC-MS data for uzarin versus predicted MIR values. Random selection was used to define a 70% calibration set ![]()
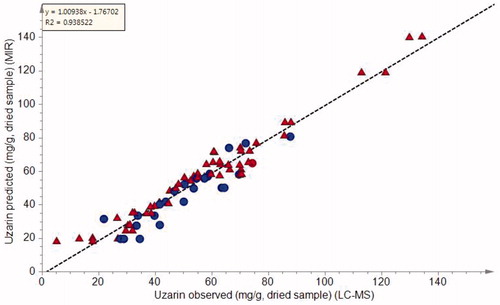
Table 3. Prediction of uzarin content (mg/g, dried sample) in seven test samples using the developed MIR-PLS calibration model.
Conclusions
The analytical methods presented are a viable tool for quality control of uzara-containing commercial products. The broad range for uzarin content (17.8–139.9 mg/g) clearly emphasizes the need for standardization to meet the quality, safety, and efficacy goals for medicinal products required by regulatory bodies.
Declaration of interest
The authors report that they have no conflicts of interest. Tshwane University of Technology and the National Research Foundation are thanked for financial support.
References
- Brendler T, Eloff JN, Gurib-Fakim A, et al. (2010). African Herbal Pharmacopeia. Port Louis, Mauritius: Association for African Medicinal Plants Standards (AAMPS)
- Balammal G, Babu MS, Reddy PJ. (2012). Analysis of herbal medicines by modern chromatographic techniques. Int J Preclin Pharm Res 3:50–63
- International Conference on Harmonisation (ICH). (2005). ICH Harmonised Tripartite Guideline – Validation of Analytical Procedures, Text and Methodology Q2 (R1). Available from: http://www.ich.org/fileadmin/Public_Web_Site/ICH_Products/Guidelines/ [last accessed 23 Feb 2015]
- Kamatou GPP, Chen W, Viljoen AM. (2012). Quantification of rosmarinic acid in Salvia species indigenous to South Africa by HPTLC. J Planar Chromatogr Mod TLC 25:403–8
- Melero CP, Medarde M, Feliciano AS. (2000). A short review on cardiotonic steroids and their aminoguanidine analogues. Molecules 5:51–81
- Miller KL, Liebowitz RS, Newby LK. (2004). Complementary and alternative medicine in cardiovascular disease: A review of biologically based approaches. Am Heart J 147:401–11
- Nelson GM, Maria G, Joao MC, et al. (2009). Plants with neurobiological activity as potential targets for drug discovery. Prog Neuro-Psychopharmacol Biol Psychiatry 33:1372–89
- Nielsen ND, Sandager M, Stafford MG, et al. (2004). Screening of indigenous plants from South Africa for affinity to the serotonin reuptake transport protein. J Ethnopharmacol 94:159–63
- Patel KG, Patel VG, Patel KV, et al. (2010). Validated HPTLC method for quantification of myricetin in the stem bark of Myrica esculenta Buch.Ham.Ex D. Don, Myricaceae. J Planar Chromatogr 23:326–31
- Pedersen ME, Szewczyk B, Stachowicz K, et al. (2008). Effects of South African traditional medicine in animal models for depression. J Ethnopharmacol 119:542–8
- Sandasi M, Kamatou GPP, Combrinck S, et al. (2013). A chemotaxonomic assessment of four indigenous South African Lippia species using GC-MS and vibrational spectroscopy of the essential oils. Biochem Syst Ecol 51:142–52
- Schmelzer GH. (2011). Xysmalobium undulatum (L.) W.T. Aiton. In: Schmelzer GH, Gurib-Fakim A, eds. Medicinal Plants/Plantes Médicinales 2. Wagenigen, the Netherlands: PROTA
- Schulzke JD, Andres S, Amasheh M, et al. (2011). Anti-diarrheal mechanism of the traditional remedy Uzara via reduction of active chloride secretion. PLoS One 6:e18107
- Stafford GI, Jäger AK, Van Staden J. (2005). Activity of traditional South African sedative and potentially CNS-acting plants in the GABA-benzodiazepine receptor assay. J Ethnopharmacol 100:210–15
- Stafford GI, Pedersen ME, Van Staden J, et al. (2008). Review on plants with CNS – Effects used in traditional South African medicine against mental diseases. J Ethnopharmacol 119:513–37
- Steenkamp V, Mathiva E, Gouws MC, et al. (2004). Studies on antibacterial, antioxidant and fibroblast growth stimulation of wound healing remedies from South Africa. J Ethnopharmacol 95:353–7
- Van Wyk B-E, Wink M. (2004). Medicinal Plants of the World. Pretoria (South Africa): Briza Publications
- Vermaak I, Hamman JH, Viljoen AM. (2010). High performance thin layer chromatography as a method to authenticate Hoodia gordonii raw material and products. S Afr J Bot 76:119–24
- Wagner H, Bladt S. (1996). Plant Drug Analysis: A Thin Layer Chromatography Atlas. Berlin (Germany): Springer-Verlag