
Abstract
Context Flavokawains are secondary metabolites from the kava plant (Piper methysticum Forst. f., Piperaceae) that have anticancer properties and demonstrated oral efficacy in murine cancer models. However, flavokawains also have suspected roles in rare cases of kava-induced hepatotoxicity.
Objective To compare the toxicity flavokawains A and B (FKA, FKB) and monitor the resulting transcriptional responses and cellular adaptation in the human hepatocyte cell line, HepG2.
Materials and methods HepG2 were treated with 2–100 μM FKA or FKB for 24–48 h. Cellular viability was measured with calcein-AM and changes in signalling and gene expression were monitored by luciferase reporter assay, real-time PCR and Western blot of both total and nuclear protein extracts. To test for subsequent resistance to oxidative stress, cells were pretreated with 50 μM FKA, 10 μM FKB or 10 μM sulphoraphane (SFN) for 24 h, followed by 0.4–2.8 mM H2O2 for 48 h, and then viability was assessed.
Results FKA (≤100 μM) was not toxic to HepG2, whereas FKB caused significant cell death (IC50=23.2 ± 0.8 μM). Both flavokawains activated Nrf2, increasing HMOX1 and GCLC expression and enhancing total glutathione levels over 2-fold (p < 0.05). FKA and FKB also activated HSF1, increasing HSPA1A and DNAJA4 expression. Also, flavokawain pretreatment mitigated cell death after a subsequent challenge with H2O2, with FKA being more effective than FKB, and similar to SFN.
Conclusions Flavokawains promote an adaptive cellular response that protects hepatocytes against oxidative stress. We propose that FKA has potential as a chemopreventative or chemotherapeutic agent.
Keywords:
Introduction
Kava (Piper methysticum Forst. f., Piperaceae) is a perennial plant that has been utilised for centuries in Pacific Island communities for medicinal, social and ceremonial purposes (Lebot et al. Citation1992; Gounder Citation2006). Various means of kava preparation exist, with most traditional methods yielding an aqueous extract from powdered root material that contains an emulsion of hydrophobic constituents, which are consumed by drinking. Kava has several effects on the human body, both peripherally and on the central nervous system. Among its many central actions, kava has been demonstrated to possess anxiolytic, sedative-hypnotic and anticonvulsant properties (Gleitz et al. Citation1996; Geier & Konstantinowicz Citation2004; Sarris et al. Citation2013). In the periphery, kava has documented immunosuppressive as well as antineoplastic effects (Folmer et al. Citation2006; Kwon et al. Citation2013). The biological actions of kava have been attributed to the various secondary metabolites present in kava extracts, including several unique lactones (kavalactones), alkaloids and chalcones (flavokawains).
Following the introduction of kava into Western markets, there have been sporadic reports of hepatotoxicity associated with kava consumption (Teschke Citation2010b). The mechanism of kava-induced liver damage has not been conclusively established, although several potential causes have been investigated, including possibilities of overdose, or susceptibility to liver damage based on pharmacogenetic differences (Teschke Citation2010a). An additional hypothesis contends that the ethanolic extracts of kava exported to Western countries contain a profile of constituents that differ from, and are more hepatotoxic than those found in traditional kava preparations (Currie & Clough Citation2003; Jhoo et al. Citation2006; Teschke et al. Citation2009). Accordingly, the relative toxicities of several kava metabolites have been evaluated in an effort to identify the responsible hepatotoxin or toxins. Among the compounds tested, the chalcone-based flavokawains are of particular interest (Olsen et al. Citation2011).
Apart from having a suspected role in hepatotoxicity, flavokawains have also been investigated as potential antineoplastic compounds. Notably, flavokawains A and B (FKA, FKB) have demonstrated anticancer activity in preclinical experiments, including murine models of breast, bladder and prostate cancers (Zi & Simoneau Citation2005; Tang et al. Citation2010; Abu et al. Citation2015). But, while FKA and FKB are orally active in mice, they are also suspected to either cause or potentiate liver damage by other agents including ethanol or acetaminophen (Li & Ramzan Citation2010; Narayanapillai et al. Citation2014). For this reason, we have sought to better understand the relative toxicities of FKA and FKB in human liver cells and evaluate their effects on intracellular signalling related to hepatocyte viability.
Here, we evaluate both FKA and FKB on the human hepatocyte cell line, HepG2 and provide a direct comparison of their toxicities. We have also examined the cellular responses to FKA and FKB that are known to affect cell viability. Our data show a marked enhancement in cytoprotective signalling in HepG2, including activation of both the antioxidant and heat shock responses. These responses are mediated by transcription factors that promote changes in gene expression that afford subsequent protection against stress-induced cell death. The antioxidant response is initiated by nuclear factor, erythroid 2-like 2 (Nrf2), which increases the expression of antioxidant genes such as heme oxygenase-1 (HMOX1) as well as enzymes that enhance glutathione (GSH) biosynthesis (Baird & Dinkova-Kostova Citation2011). The heat shock response is initiated by heat shock factor 1 (HSF1), which promotes the expression of protein chaperones and antiapoptotic machinery (Anckar & Sistonen Citation2011). Together, our results demonstrate a cellular response to sub-toxic levels of flavokawains in HepG2 that promotes viability and confers resistance to subsequent oxidative damage.
Materials and methods
Cell culture and treatment
The HepG2 human hepatocyte cell line was obtained from American Type Culture Collection (ATCC) and grown in a humidified 5% CO2 incubator at 37 °C in RPMI media containing 10% foetal bovine serum. Cells were split at a 1:4 ratio upon reaching 80% confluence and maintained to no more than 25 passages. FKA, FKB and R, S-sulphoraphane were obtained from Enzo Life Sciences (Farmingdale, NY) and dissolved in dimethyl sulphoxide (DMSO). For cell culture treatments, test compounds were dissolved in DMSO at a 1000-fold concentration and subsequently diluted into culture media for a final amount of 0.1% DMSO. For vehicle controls, 0.1% DMSO alone was used. Cells were then maintained for the indicated durations at 37 °C.
Toxicity assays
HepG2 cells were seeded in 96-well plates at a density of 1 × 10⁴ per well, adhered overnight, then treated with 0.1% DMSO (vehicle control) or compounds at concentrations indicated in the text. After 48 h treatment, media was replaced with 2 μM calcein-AM (Life Technologies, Carlsbad, CA) diluted in phosphate-buffered saline. Cells were then incubated at room temperature for 30 min and fluorescence read using a BioTek Synergy MX multiwell plate reader (λex = 494 nm, λem = 517 nm) (Winooski, VT). Fluorescence data were normalised to vehicle (0.1% DMSO)-treated cells and nonlinear curve-fitting of log-transformed data (n ≥ 6 per condition) was performed in GraphPad Prism (La Jolla, CA), using the equation:
Inhibitory concentration 50% (IC50) values were determined from curve-fitting analysis and are reported ±95% confidence intervals.
Luciferase assays
Monitoring HSF1- and Nrf2-mediated gene expression was performed with firefly luciferase reporter constructs bearing the respective consensus binding elements. For HSF1, we cloned an oligonucleotide bearing five repeats of the sequence 5′-TTCnnGAA-3′ into the parent vector pGL4.27 (Promega, Madison, WI), to generate pGL4-HSE as previously described (Samarasinghe et al. Citation2014). For these experiments, pGL4.27 was used as a negative control plasmid. For assessing Nrf2, an oligonucleotide containing the binding site 5′-GTGACnnnGC-3′ was cloned into the vector pGL3-Promoter (Promega). This construct, pGL3-ARE, was generously provided by Lawrence Marnett (Vanderbilt University, Nashville, TN) (West & Marnett Citation2005). The parent vector pGL3-Promoter was used as a negative control. Transient transfections were achieved with Lipofectamine 3000 in Opti-MEM media, and cells were subsequently seeded into black-walled 96-well plates (Corning, Corning, NY) at a density of 1 × 10⁴ per well. Twenty-four hours following cell treatment, luciferase activity was monitored using the Luciferase-Glo Assay (Promega) per instructions and read using a BioTek Synergy MX plate reader. Statistical analysis: Luciferase data are represented as mean luminescence units (n ≥ 6 per condition), with error bars showing standard deviations. Nonlinear curve-fitting of log-transformed data was performed in GraphPad Prism, using the equation:
Effective concentration 50% (EC50) values were determined from curve-fitting analysis and are reported ±95% confidence intervals. NC, data are non-convergent (calculation of EC50 not performed).
RNA collection and real-time RT-PCR
Cells were scraped and collected by centrifugation. Cell pellets were resuspended in 1 ml TRIzol reagent (Sigma, St Louis, MO) and incubated at 25 °C for 5 min. Chloroform (200 μl) was then added and mixed by vigorous shaking. After centrifugation at 14 000g, the aqueous phase was transferred to a separate 1.5 ml tube and equal volume of 70% EtOH was added. Total RNA was then collected using RNeasy RNA collection kit (Qiagen, Venlo, Netherlands). Digestion of trace DNA was performed with DNAfree reagent (Ambion, Grand Island, NY). Samples were quantified by absorbance at 260 and 280 nm and diluted in nuclease-free water to 100 ng/μl. Total RNA (1 μg) was then used in a reverse transcription reaction with iScript reagent (Bio-Rad). One-tenth of each reaction volume (2 μl) was used per well in subsequent Real Time PCR analysis using iQ SYBR Green Supermix (Bio-Rad). Primer sequences used include HSPA1A: forward 5′-GCCAACAAGATCACCATCAC-3′, reverse 5′-GCTCAAACTCGTCCTTCTC-3′; DNAJA4: forward 5′-AATGCCCATCTACAAAGCAC-3′, reverse 5′-CAAAACTCCTTCAGCTCCAC-3′; HMOX1: forward 5′-TCCGATGGGTCCTTACACTC-3′, reverse 5′-TAAGGAAGCCACGGAAGAGA-3′; GCLC: forward 5′-TCCTGGACTGATCCCAATTC-3′, reverse 5′-TGCGATAAACTCCCTCATC-3′ and 18S rRNA (control) forward 5′-GCCCGAGCCGCCTGGATACC-3′, reverse 5′-TCACCTCTAGCGGCGCAATACG-3′. Real-time PCR reactions were performed using a Bio-Rad CFX96 thermocycler. Relative differences in gene expression between samples were calculated using the formula R = 2ΔΔCT and normalised to 18S rRNA as a housekeeping control. Values are normalised to vehicle (0.1% DMSO)-treated control and shown along with standard deviations for n = 4.
Protein collection and Western blots
Total proteins were collected using M-PER Lysis Buffer (Thermo, Grand Island, NY) containing HALT protease and phosphatase inhibitor cocktail (Thermo). Lysates were centrifuged at 14 000g for 10 min and stored at −20 °C. For nuclear proteins, cells were collected by centrifugation then resuspended in 800 μl ice-cold buffer A (10 mM HEPES, pH 7.9; 10 mM KCl; 0.1 mM EDTA; 0.1 mM EGTA; 0.5 mM dithiothreitol; 0.5 mM PMSF) then 50 μl of Igepal CA-630 (NP-40) was added. Nuclei were pelleted by centrifugation at 1000g for 5 min at 4 °C, and washed twice with buffer A. Proteins were extracted from nuclear pellets by the addition of M-PER. Protein concentrations were determined by the Bio-Rad protein assay. For Western blotting, equal quantities of protein (typically 10 μg) per lane were resolved by SDS–PAGE, then transferred to a 0.2-μm nitrocellulose membrane (Bio-Rad). Membranes were blocked (Sea Block, Thermo) prior to incubation with primary antibody overnight at 4 °C. Membranes were then washed four times in Tris-buffered saline with 1% Tween 20, incubated 1 h with near-IR dye-conjugated secondary antibody and washed again. Imaging of Western blots was performed using the LI-COR Odyssey Infrared Imaging System. HSF1, Nrf2 and Actin primary antibodies were obtained from Cell Signaling Technologies (Danvers, MA). HO-1 and Hsp70-1 antibodies were obtained from BD Biosciences (Franklin Lakes, NJ). Near-IR conjugated secondary antibodies were obtained from LI-COR. Western blot images are representative from n ≥ 3.
Total GSH assay
Total cellular GSH content was determined using the GSH/GSSG-Glo Assay (Promega) per the manufacturer’s protocol. Briefly, HepG2 were seeded in 96-well plates at a density of 1 × 10⁴ per well, adhered overnight, then treated with 0.1% DMSO (vehicle control) or compounds at concentrations indicated in the text. After 24 h of treatment, cells were lysed with either total GSH or oxidised GSH lysis reagents. Luciferin Generation Reagent was added and incubated for 30 min, followed by Luciferin Detection Reagent, which was incubated for 15 min. Luminescence was read using a BioTek Synergy MX plate reader, using GSH for standard curve generation. Relative light units were normalised to 0.1% DMSO-treated samples. Data represent mean normalised values for GSH + GSSG content ± standard deviations for n = 8 samples.
Statistical analysis
Data obtained from toxicity and luciferase assays are shown as mean values of n ≥ 6 per condition with error bars representing standard deviations. The degree of statistical significance was determined using Student’s t-test. p Values below 0.05 are considered to be significant and are indicated by asterisks (*) in the figure legends.
Results
Comparative toxicity of FKA and FKB in HepG2 cells
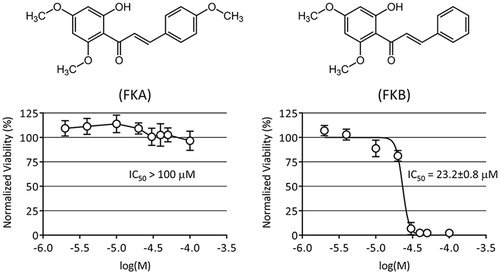
To assess the toxicity of FKA and FKB in the HepG2 cell line, cells were seeded in 96-well plates and attached overnight. HepG2 were then treated with either 0.1% DMSO in cell culture media as a vehicle control, or varying concentrations of either FKA or FKB (2–100 μM). Cells were returned to 37 °C for 48 h. Afterwards, cell viability was determined using the fluorescent viability indicator calcein-AM. Our data show that FKA is considerably less toxic than FKB to HepG2. Accordingly, no statistical difference in cell viability between vehicle control and the highest concentration of FKA (100 μM) was observed. Higher amounts of FKA were not soluble in the cell culture media, so a determination of an IC50 for FKA could not be made and is therefore reported as >100μM (). In contrast, a reduction in HepG2 viability was observed beginning in the range of 10–20 μM FKB. An IC50 value of 23.2 ± 0.8 μM in HepG2 was determined by nonlinear regression as described in the “Materials and methods” section.
Figure 1. Cellular viability following treatment with flavokawains. HepG2 were treated with 2–100 μM FKA or FKB, or with vehicle control (0.1% DMSO) for 48 h. Viability was measured by calcein-AM fluorescence assay, normalising data to vehicle control (100%). IC50 values were determined by nonlinear regression as described in the “Materials and methods” section. Chemical structures of FKA and FKB are shown for reference.
FKA and FKB activate Nrf2 and HSF1
Firefly luciferase reporter constructs bearing consensus DNA binding sites for Nrf2 or HSF1 were used to evaluate their activities in flavokawain-treated HepG2. Nrf2 and HSF1 are transcription factors that enhance the expression of genes mediating the antioxidant and heat shock responses, respectively. Cells were allowed to adhere in 10 cm dishes, then transfected with either the Nrf2 or HSF1 reporter construct, or their corresponding parent vector as a negative control. After transfection cells were incubated for 24 h, then treated for an additional 24 h with increasing concentrations of either FKA (1–100 μM) or FKB (1–20 μM). The maximal concentration of FKB tested in these experiments was lower than that of FKA because higher amounts were toxic to HepG2 and could therefore not be assessed. EC50 values for luciferase activity were determined by nonlinear regression as described in the “Materials and methods” section. The EC50 values for Nrf2 activation indicate that the potency is similar for FKA (14.1 ± 1.3 μM) and FKB (9.0 ± 4.8 μM) (). FKA and FKB also enhanced HSF1-driven luciferase expression, however, only an EC50 value for FKA (7.9 ± 2.3 μM) could be obtained. In contrast, data from FKB-treated cells did not converge on a maximal response (plateau), and higher concentrations were toxic to HepG2, so an EC50 for HSF1-activation by FKB could not be determined. Although we were not able to calculate the EC50, it is noteworthy that HSF1 activation was significantly increased at 10–20 μM FKB.
Figure 2. Activation of Nrf2 and HSF1. (A) Luciferase reporter assay of Nrf2 and HSF1 following FKA or FKB treatment. HepG2 were transfected with firefly luciferase reporter constructs for Nrf2 (pGL3-ARE), HSF1 (pGL4-HSE) or their respective parent vectors (pGL3-Promoter, pGL4.27) as empty plasmid controls. Transfected cells were subsequently treated with FKA, FKB or vehicle control (0.1% DMSO) for 24 h and luciferase was measured. EC50 values for the enhancement of luciferase expression were calculated by nonlinear regression as described in the “Materials and methods” section. (B) Nuclear expression of Nrf2 and HSF1 is enhanced by FKA or FKB. HepG2 were treated with the indicated concentrations of FKA, FKB or vehicle control (0.1% DMSO, 0 μM) for 24 h and total protein was collected and analysed by Western blot using nuclear β-actin levels as a loading control.
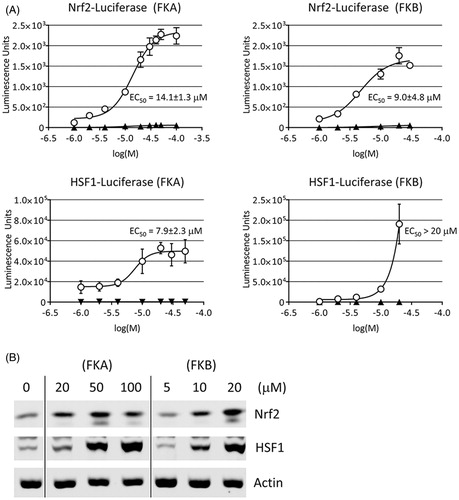
The activities of Nrf2 and HSF1 are regulated by nuclear translocation. Under nonstressed conditions, both transcription factors are prevented from entering the nucleus and controlling gene expression through their associations with the regulatory proteins, Keap1 and Hsp90, respectively (Zou et al. Citation1998; Itoh et al. Citation1999). As described above, we observed an increase luciferase following flavokawain treatment of cells transfected with either the Nrf2 or HSF1 reporter constructs. To confirm that these increases in luciferase activity are associated with enhanced nuclear expression of Nrf2 and HSF1, we monitored their levels in nuclear extracts by Western blot. Our results confirm that there are concentration-dependent increases in the nuclear levels of both Nrf2 and HSF1, consistent with our reporter assay data ().
FKA and FKB induce antioxidant and heat shock gene expression
Once activated, Nrf2 and HSF1 mediate the expression of genes which constitute the antioxidant and heat shock responses, thus protecting the cell from subsequent damage. We used real-time PCR to monitor the activation of these transcriptional responses to FKA and FKB. Levels of the 18S rRNA were also measured and used for the normalisation of gene expression.
For the antioxidant response, we measured the relative levels of HMOX1 and glutamate-cysteine ligase, catalytic subunit (GCLC). The HMOX1 gene, whose product is commonly referred to as HO-1, catalyses the conversion of heme to biliverdin. Together with bilirubin, biliverdin forms a redox active couple that protects cells against lipophilic oxidants (Stocker Citation2004). GCLC is the active component of glutamate-cysteine ligase, which catalyses the rate-limiting step in GSH biosynthesis. Acting in a redox couple with glutathione disulphide (GSSG), GSH also helps to mitigate oxidative stress (Forman & Dickinson Citation2003). After treating HepG2 with FKA or FKB, we observed a profound increase in the expression of HMOX1 mRNA (). Relative to vehicle-treated cells, 50 μM FKA caused an approximate 30-fold increase HMOX1 levels. At 100 μM FKA, HMOX1 expression was approximately 45-fold higher than control cells. We used lower concentrations of FKB for these experiments on account of its greater toxicity. In cells treated with 10 μM FKB, HMOX1 was increased approximately 8-fold, while in cells treated 20 μM FKB, HMOX1 was 95-fold higher than in vehicle-treated controls. We also observed increases in the expression of GCLC mRNA of 2- to 3-fold over control in both FKA- and FKB-treated cells.
For the heat shock response we measured the relative levels of HSPA1A and DNAJA4. HSPA1A encodes an HSF1-inducible Hsp70 isoform (Hsp70-1) that helps to stabilise existing proteins against aggregation during thermal or chemically-induced unfolded protein stress (Li and Srivastava Citation2004). DNAJA4 is an HSF1-inducible Hsp40 isoform. Hsp40 proteins associate with and stimulate the catalytic, protein-folding activity of Hsp70 (Qiu et al. Citation2006). FKA and FKB both induced concentration-dependent increases in HSPA1A and DNAJA4 expression in HepG2 cells after 24 h of treatment ().
Figure 3. FKA and FKB increase the expression of antioxidant and heat shock genes. (A) HepG2 were treated with the indicated concentrations of FKA, FKB or vehicle control (0.1% DMSO, 0 μM) for 24 h and RNA was collected and analysed by real-time RT-PCR for the expression of HMOX1, GCLC, HSPA1A and DNAJA4. 18S rRNA was use as a loading control for the normalisation of data. Data are represented relative to gene expression in vehicle-treated cells. Error bars indicate standard deviations (n=4, *p<0.05). (B) Protein expression of HO-1 (HMOX1) and Hsp70-1 (HSPA1A) following FKA or FKB addition for 24 h at the indicated concentrations. Data representative of n=3.
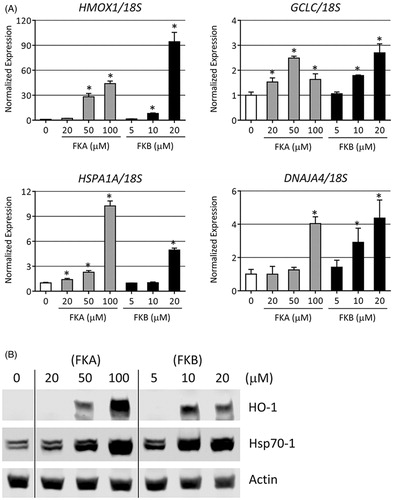
To confirm expression at the protein level, we analysed total extracts from FKA or FKB-treated HepG2 cells by Western blot for HO-1 and Hsp70. These were chosen since the transcripts that encode them, HMOX1 and HSPA1A, respectively, were robustly enhanced by flavokawain treatment, and are highly representative of the antioxidant and heat shock responses. Following addition of either FKA or FKB, we observed significant, concentration-dependent increases in both HO-1 and Hsp70-1 (). The highest level of HO-1 induction occurred following the addition of 100 μM FKA. This is interesting since 20 μM FKB caused the greatest increase in HMOX1 mRNA. We suspect that the moderate toxicity of 20 μM FKB may account for this difference, while 100 μM FKA causes no apparent cell death, as demonstrated in . Protein levels of Hsp70-1 also increased significantly following FKA and FKB treatment. The antibody for Hsp70-1 used in our analysis detects two bands. The higher of these bands, at approximately 71–73 kDa, does not increase following FKA or FKB treatment. We suspect this upper, non-inducible band represents a constitutive Hsp70 isoform that is cross-reactive with Hsp70-1, and is possibly heat shock cognate protein 70 (Hsc70). As with HO-1, expression of Hsp70-1 protein is highest following treatment with 100 μM FKA.
FKA and FKB increase total GSH levels
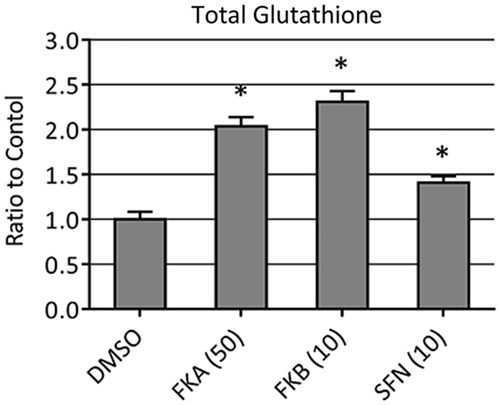
One aspect of the antioxidant response is, it mitigates oxidative damage in cells in the increased biosynthesis of GSH (Lu Citation2013). We used a commercial luminescence-based assay to determine total GSH content (GSH + GSSG) in cells following FKA or FKB treatment. Vehicle (0.1% DMSO) was used as a negative control, while sulphoraphane (SFN), a known activator of the antioxidant response was used as a positive control. Total cellular GSH content increased approximately 2.0-fold following treatment with 50 μM FKA and 2.3-fold with 10 μM FKB (). At 24 h after SFN addition, total GSH was increased about 1.5-fold, which is comparable with previous reports (Kim et al. Citation2003; Kerns et al. Citation2010).
Figure 4. Total GSH levels in HepG2 following 24 h treatment with 0.1% DMSO (vehicle control), 50 μM FKA, 10 μM FKB or 10 μM SFN. Data are represented relative to total GSH + GSSG in vehicle-treated cells. Error bars indicate standard deviations (n=8, *p<0.05).
Protection from H2O2-mediated cell death
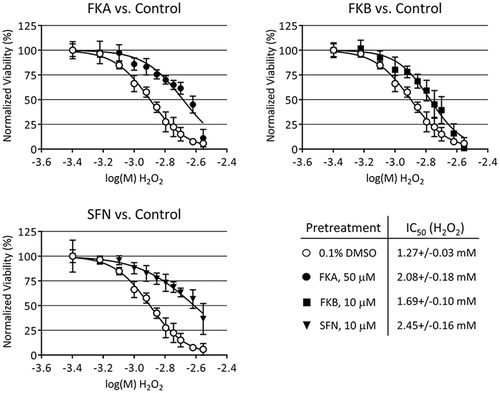
Having shown that sub-toxic amounts FKA and FKB activate both the antioxidant and heat shock responses and increase total GSH, we next decided to test if HepG2 would be protected from subsequent chemical injury. Cells were pretreated for 24 h with FKA, FKB or SFN, then challenged with various concentrations of H2O2 for an additional 48 h. Afterwards, calcein-AM was used to measure cell viability and determine IC50 values for H2O2. Treatment with FKA, FKB or SFN each caused a rightward-shift in the concentration–response to H2O2, which is consistent with a cytoprotective effect (). A greater degree of protection was afforded by pretreatment with either FKA or SFN, which reduced the toxicity of H2O2 by 39% and 48%, respectively, as determined from the shift in IC50 values. Pretreatment with FKB also caused protection against H2O2, although to a lesser degree than the other compounds tested.
Figure 5. Toxicity of H2O2 to HepG2 following 24 h pretreatment with 0.1% DMSO (vehicle control), 50 μM FKA, 10 μM FKB or 10 μM SFN. After pretreatment, media was changed and H2O2 added in concentrations from 0.4 to 2.8 mM and incubated for an additional 48 h. Viability was measured by calcein-AM fluorescence assay, normalising data to vehicle control (100%). IC50 values were determined by nonlinear regression as described in the “Materials and methods” section.
Discussion
Biologically active constituents of kava have received attention as potential agents for cancer therapy, with the flavokawains FKA and FKB showing efficacy in preclinical models (Abu et al. Citation2013). However, this is complicated by their possible roles in kava-induced hepatotoxicity (Olsen et al. Citation2011). With this in mind, we compared the toxicities of FKA and FKB in the human hepatocyte cell lines, HepG2 and examined the cellular responses which could influence hepatocyte viability. Our results show a major difference between the two flavokawains, with FKB being significantly more toxic than FKA. This finding is consistent with previous reports which demonstrate that FKB is the more hepatotoxic flavokawain species (Jhoo et al. Citation2006; Li et al. Citation2008).
The recent work of Martin et al. has revealed a significant degree of variability in metabolite profiles among 25 commercially available kava products (Martin et al. Citation2014). The solvent used in preparing kava extracts was shown to have a major influence on metabolite content, with ethanol favouring the extraction of FKA and FKB. There was also significant variability among different commercial sources with regard to their anticancer activities, highlighting the need for standardisation of kava products if kava is to be utilised for cancer therapy or prevention. It is notable that FKA has been reported to constitute as much as 0.46% the dry weight of ethanolic kava extracts, being up to 30-fold more abundant than FKB (Dharmaratne et al. Citation2002). Although more toxic than FKA, the lesser abundance of FKB in kava extract has brought into question its role in case reports of kava-induced hepatotoxicity. Calculations by Teschke et al. have shown that the dose of FKB obtained from an ethanolic kava extract is 250-fold below the amount needed to cause modest hepatotoxicity, based on rodent studies (Teschke et al. Citation2011).
We also demonstrate that FKA and FKB activate the antioxidant and heat shock responses in HepG2. For FKA, the activation of these cytoprotective pathways is notable because unlike FKB, the treatment of HepG2 with FKA does not cause apparent toxicity. Also, while FKA did not cause significant death in HepG2 at levels up to 100 μM, it is reported to cause apoptosis in various cancer cell lines with IC50 values ranging from 7.9 to 20.8 μM (Tang et al. Citation2008). These findings suggest that authentic FKA may have utility in cancer prevention or therapy, similar to SFN (Clarke et al. Citation2008; Lenzi et al. Citation2014).
The engagement of Nrf2 and resulting activation of antioxidant gene expression is known to protect cells from subsequent damage by oxidants like H2O2. In our experiments, the degree of protection from H2O2-induced cell death was similar between FKA and SFN, but less for FKB. Activation of the heat shock response and the resulting expression of Hsp70-1 is also known to mediate protection against oxidant-induced cell death in various cell types (Chen et al. Citation1999; Chiu et al. Citation2009). This consequence of HSF1 and the heat shock response is believed to complement the protective effects of the antioxidant response by Nrf2 (Kalmar & Greensmith Citation2009). Together, HO-1 and cellular GSH have complementary cytoprotective roles against oxidative stress (Sedlak et al. Citation2009).
The structures of the flavokawains may provide some insight into their mechanism of actions in HepG2. FKA and FKB both possess an electrophilic α,β-unsaturated carbonyl, which may account their ability to activate Nrf2 as well as HSF1. In untreated cells, Nrf2 is excluded from the nucleus and targeted for proteasomal degradation by its physical interaction with Keap1 (Itoh et al. Citation1999; McMahon et al. Citation2003). Covalent modification of critical cystine residues within Keap1 or Nrf2 by electrophilic compounds can disrupt this interaction, resulting in Nrf2 stabilisation and nuclear translocation (Ma & He Citation2012). A similar mechanism may be responsible for initiation of the heat shock response in FKA- or FKB-treated cells. Of note, electrophilic modification of Hsp90 by 4-hydroxynonenal, which also contains an electrophilic α,β-unsaturated carbonyl, disrupts its interaction with client proteins and leads to the activation of HSF1 (Jacobs & Marnett Citation2010; Connor et al. Citation2011).
Conclusions
The flavokawains, FKA and FKB, have demonstrated efficacy in both cell culture and animal models for the treatment of various cancers (Tang et al. Citation2010; An et al. Citation2012; Hseu et al. Citation2012; Liu et al. Citation2013; Abu et al. Citation2014,Citation2015). Although FKA kills cancer cells and limits tumour growth, it has no apparent toxicity to HepG2 hepatocytes in our experiments. Like FKA, FKB has also demonstrated efficacy both in vitro and in vivo for the treatment of cancer. However, because it is toxic in HepG2 and has a suspected role in kava-induced liver damage, we believe that FKB has less clinical potential.
In addition, FKA induces a strong cytoprotective response without notable toxicity in HepG2. For this reason, it is also interesting as a potential chemopreventative agent, since its effects are similar to SFN. Like FKA, FKB also induced a cytoprotective effect, thereby reducing the toxicity of H2O2 in a subsequent challenge. However, the degree of protection that FKB afforded was not as significant as either FKA or SFN.
Acknowledgements
The plasmid pGL3-ARE was provided by Lawrence J. Marnett.
Declaration of interest
Keanu Pinner is the son of Dean Pinner, owner of Pinner Creek Organics in Hilo, HI. All other authors of this work have no conflicts of interest. Funding for this work was provided by Hawaii IDeA Network for Biomedical Research Excellence III (INBRE-III) project: NIGMS Grant 5P20GM103466.
References
- Abu N, Akhtar MN, Yeap SK, Lim KL, Ho WY, Zulfadli AJ, Omar AR, Sulaiman MR, Abdullah MP, Alitheen NB. 2014. Flavokawain A induces apoptosis in MCF-7 and MDA-MB231 and inhibits the metastatic process in vitro. PLoS One. 9:e105244.
- Abu N, Ho WY, Yeap SK, Akhtar MN, Abdullah MP, Omar AR, Alitheen NB. 2013. The flavokawains: uprising medicinal chalcones. Cancer Cell Int. 13:102.
- Abu N, Mohamed NE, Yeap SK, Lim KL, Akhtar MN, Zulfadli AJ, Kee BB, Abdullah MP, Omar AR, Alitheen NB. 2015. In vivo antitumor and antimetastatic effects of flavokawain B in 4T1 breast cancer cell-challenged mice. Drug Des Dev Ther. 9:1401–1417.
- An J, Gao Y, Wang J, Zhu Q, Ma Y, Wu J, Sun J, Tang Y. 2012. Flavokawain B induces apoptosis of non-small cell lung cancer H460 cells via Bax-initiated mitochondrial and JNK pathway. Biotechnol Lett. 34:1781–1788.
- Anckar J, Sistonen L. 2011. Regulation of HSF1 function in the heat stress response: implications in aging and disease. Annu Rev Biochem. 80:1089–1115.
- Baird L, Dinkova-Kostova AT. 2011. The cytoprotective role of the Keap1-Nrf2 pathway. Arch Toxicol. 85:241–272.
- Chen HC, Guh JY, Tsai JH, Lai YH. 1999. Induction of heat shock protein 70 protects mesangial cells against oxidative injury. Kidney Int. 56:1270–1273.
- Chiu HY, Tsao LY, Yang RC. 2009. Heat-shock response protects peripheral blood mononuclear cells (PBMCs) from hydrogen peroxide-induced mitochondrial disturbance. Cell Stress Chaperones. 14:207–217.
- Clarke JD, Dashwood RH, Ho E. 2008. Multi-targeted prevention of cancer by sulforaphane. Cancer Lett. 269:291–304.
- Connor RE, Marnett LJ, Liebler DC. 2011. Protein-selective capture to analyze electrophile adduction of hsp90 by 4-hydroxynonenal. Chem Res Toxicol. 24:1275–1282.
- Currie BJ, Clough AR. 2003. Kava hepatotoxicity with Western herbal products: does it occur with traditional kava use? Med J Aust. 178:421–422.
- Dharmaratne HR, Nanayakkara NP, Khan IA. 2002. Kavalactones from Piper methysticum, and their 13C NMR spectroscopic analyses. Phytochemistry. 59:429–433.
- Folmer F, Blasius R, Morceau F, Tabudravu J, Dicato M, Jaspars M, Diederich M. 2006. Inhibition of TNFalpha-induced activation of nuclear factor kappaB by kava (Piper methysticum) derivatives. Biochem Pharmacol. 71:1206–1218.
- Forman HJ, Dickinson DA. 2003. Oxidative signaling and glutathione synthesis. Biofactors. 17:1–12.
- Geier FP, Konstantinowicz T. 2004. Kava treatment in patients with anxiety. Phytother Res. 18:297–300.
- Gleitz J, Friese J, Beile A, Ameri A, Peters T. 1996. Anticonvulsive action of (+/-)-kavain estimated from its properties on stimulated synaptosomes and Na+ channel receptor sites. Eur J Pharmacol. 315:89–97.
- Gounder R. 2006. Kava consumption and its health effects. Pac Health Dialog. 13:131–135.
- Hseu YC, Lee MS, Wu CR, Cho HJ, Lin KY, Lai GH, Wang SY, Kuo YH, Kumar KJ, Yang HL. 2012. The chalcone flavokawain B induces G2/M cell-cycle arrest and apoptosis in human oral carcinoma HSC-3 cells through the intracellular ROS generation and downregulation of the Akt/p38 MAPK signaling pathway. J Agric Food Chem. 60:2385–2397.
- Itoh K, Wakabayashi N, Katoh Y, Ishii T, Igarashi K, Engel JD, Yamamoto M. 1999. Keap1 represses nuclear activation of antioxidant responsive elements by Nrf2 through binding to the amino-terminal Neh2 domain. Genes Dev. 13:76–86.
- Jacobs AT, Marnett LJ. 2010. Systems analysis of protein modification and cellular responses induced by electrophile stress. Acc Chem Res. 43:673–683.
- Jhoo JW, Freeman JP, Heinze TM, Moody JD, Schnackenberg LK, Beger RD, Dragull K, Tang CS, Ang CY. 2006. In vitro cytotoxicity of nonpolar constituents from different parts of kava plant (Piper methysticum). J Agric Food Chem. 54:3157–3162.
- Kalmar B, Greensmith L. 2009. Induction of heat shock proteins for protection against oxidative stress. Adv Drug Deliv Rev. 61:310–318.
- Kerns M, DePianto D, Yamamoto M, Coulombe PA. 2010. Differential modulation of keratin expression by sulforaphane occurs via Nrf2-dependent and -independent pathways in skin epithelia. Mol Biol Cell. 21:4068–4075.
- Kim BR, Hu R, Keum YS, Hebbar V, Shen G, Nair SS, Kong AN. 2003. Effects of glutathione on antioxidant response element-mediated gene expression and apoptosis elicited by sulforaphane. Cancer Res. 63:7520–7525.
- Kwon DJ, Ju SM, Youn GS, Choi SY, Park J. 2013. Suppression of iNOS and COX-2 expression by flavokawain A via blockade of NF-κB and AP-1 activation in RAW 264.7 macrophages. Food Chem Toxicol. 58:479–486.
- Lebot V, Lindstrom L, Merlin M. 1992. Kava: the pacific drug. New Haven (CT): Yale University Press.
- Lenzi M, Fimognari C, Hrelia P. 2014. Sulforaphane as a promising molecule for fighting cancer. Cancer Treat Res. 159:207–223.
- Li N, Liu JH, Zhang J, Yu BY. 2008. Comparative evaluation of cytotoxicity and antioxidative activity of 20 flavonoids. J Agric Food Chem. 56:3876–3883.
- Li XZ, Ramzan I. 2010. Role of ethanol in kava hepatotoxicity. Phytother Res. 24:475–480.
- Li Z, Srivastava P. 2004. Heat-shock proteins. Curr Protoc Immunol. Appendix 1:Appendix 1T.
- Liu Z, Xu X, Li X, Liu S, Simoneau AR, He F, Wu XR, Zi X. 2013. Kava chalcone, flavokawain A, inhibits urothelial tumorigenesis in the UPII-SV40T transgenic mouse model. Cancer Prev Res (Phila). 6:1365–1375.
- Lu SC. 2013. Glutathione synthesis. Biochim Biophys Acta. 1830:3143–3153.
- Ma Q, He X. 2012. Molecular basis of electrophilic and oxidative defense: promises and perils of Nrf2. Pharmacol Rev. 64:1055–1081.
- Martin AC, Johnston E, Xing C, Hegeman AD. 2014. Measuring the chemical and cytotoxic variability of commercially available kava (Piper methysticum G. Forster). PLoS One. 9:e111572.
- McMahon M, Itoh K, Yamamoto M, Hayes JD. 2003. Keap1-dependent proteasomal degradation of transcription factor Nrf2 contributes to the negative regulation of antioxidant response element-driven gene expression. J Biol Chem. 278:21592–21600.
- Narayanapillai SC, Leitzman P, O'Sullivan MG, Xing C. 2014. Flavokawains A and B in kava, not dihydromethysticin, potentiate acetaminophen-induced hepatotoxicity in C57BL/6 mice. Chem Res Toxicol. 27:1871–1876.
- Olsen LR, Grillo MP, Skonberg C. 2011. Constituents in kava extracts potentially involved in hepatotoxicity: a review. Chem Res Toxicol. 24:992–1002.
- Qiu XB, Shao YM, Miao S, Wang L. 2006. The diversity of the DnaJ/Hsp40 family, the crucial partners for Hsp70 chaperones. Cell Mol Life Sci. 63:2560–2570.
- Samarasinghe B, Wales CT, Taylor FR, Jacobs AT. 2014. Heat shock factor 1 confers resistance to Hsp90 inhibitors through p62/SQSTM1 expression and promotion of autophagic flux. Biochem Pharmacol. 87:445–455.
- Sarris J, Stough C, Bousman CA, Wahid ZT, Murray G, Teschke R, Savage KM, Dowell A, Ng C, Schweitzer I. 2013. Kava in the treatment of generalized anxiety disorder: a double-blind, randomized, placebo-controlled study. J Clin Psychopharmacol. 33:643–648.
- Sedlak TW, Saleh M, Higginson DS, Paul BD, Juluri KR, Snyder SH. 2009. Bilirubin and glutathione have complementary antioxidant and cytoprotective roles. Proc Natl Acad Sci USA. 106:5171–5176.
- Stocker R. 2004. Antioxidant activities of bile pigments. Antioxid Redox Signal. 6:841–849.
- Tang Y, Li X, Liu Z, Simoneau AR, Xie J, Zi X. 2010. Flavokawain B, a kava chalcone, induces apoptosis via up-regulation of death-receptor 5 and Bim expression in androgen receptor negative, hormonal refractory prostate cancer cell lines and reduces tumor growth. Int J Cancer. 127:1758–1768.
- Tang Y, Simoneau AR, Xie J, Shahandeh B, Zi X. 2008. Effects of the kava chalcone flavokawain A differ in bladder cancer cells with wild-type versus mutant p53. Cancer Prev Res (Phila). 1:439–451.
- Teschke R. 2010a. Kava hepatotoxicity: pathogenetic aspects and prospective considerations. Liver Int. 30:1270–1279.
- Teschke R. 2010b. Kava hepatotoxicity – a clinical review. Ann Hepatol. 9:251–265.
- Teschke R, Genthner A, Wolff A. 2009. Kava hepatotoxicity: comparison of aqueous, ethanolic, acetonic kava extracts and kava-herbs mixtures. J Ethnopharmacol. 123:378–384.
- Teschke R, Qiu SX, Lebot V. 2011. Herbal hepatotoxicity by kava: update on pipermethystine, flavokavain B, and mould hepatotoxins as primarily assumed culprits. Dig Liver Dis. 43:676–681.
- West JD, Marnett LJ. 2005. Alterations in gene expression induced by the lipid peroxidation product, 4-hydroxy-2-nonenal. Chem Res Toxicol. 18:1642–1653.
- Zi X, Simoneau AR. 2005. Flavokawain A, a novel chalcone from kava extract, induces apoptosis in bladder cancer cells by involvement of Bax protein-dependent and mitochondria-dependent apoptotic pathway and suppresses tumor growth in mice. Cancer Res. 65:3479–3486.
- Zou J, Guo Y, Guettouche T, Smith DF, Voellmy R. 1998. Repression of heat shock transcription factor HSF1 activation by HSP90 (HSP90 complex) that forms a stress-sensitive complex with HSF1. Cell. 94:471–480.