
Abstract
Context The effect of 6-gingerol (6G), the bioactive component of Zingiber officinale Roscoe (Zingiberaceae), in the reduction of Vibrio cholerae (Vibrionaceae)-induced inflammation has not yet been reported.
Materials and methods Cell viability assay was performed to determine the working concentration of 6G. Elisa and RT-PCR were performed with Int 407 cells treated with 50 μM 6G and 100 multiplicity of infection (MOI) V. cholerae for 0, 2, 3, 3.5, 6 and 8 h to determine the concentration of IL-8, IL-6, IL-1α and IL-1β in both protein and RNA levels. Furthermore, the effect of 50 μM 6G on upstream MAP-kinases and NF-κB signalling pathways was evaluated at 0, 10, 15, 30, 60 and 90 min.
Results The effective dose (ED50) value of 6G was found to be 50 μM as determined by cell viability assay. Pre-treatment with 50 μM 6G reduced V. cholerae infection-triggered levels of IL-8, IL-6, IL-1α and IL-1β by 3.2-fold in the protein level and two-fold in the RNA level at 3.5 h. The levels of MAP-kinases signalling molecules like p38 and ERK1/2 were also reduced by two- and three-fold, respectively, after 30 min of treatment. Additionally, there was an increase in phosphorylated IκBα and down-regulation of p65 resulting in down-regulation of NF-κB pathway.
Conclusion Our results showed that 6G could modulate the anti-inflammatory responses triggered by V. cholerae-induced infection in intestinal epithelial cells by modulating NF-κB pathway.
Introduction
Vibrio cholerae (Vibrionaceae), the causative agent of fatal diarrhoeal disease cholera, is a highly motile non-invasive Gram-negative organism which colonises the small intestine and produces a potent enterotoxin called the cholera toxin (CT). CT is a major virulence factor that is primarily responsible for the diarrhoeal syndrome (Kaper et al. Citation1995), characterised by profuse water and ion loss. Although cholera has been traditionally classified as a non-inflammatory diarrhoeal disease, some evidences point towards an inflammatory component in the pathogenesis of the disease. Reports suggest that certain V. cholerae strains as well as CT may stimulate a modest intestinal inflammatory response (Sears & Kaper Citation1996). CT has been demonstrated to strongly promote the production of interleukin-6 (IL-6) in rat intestinal epithelial cells (IECs) (Saha et al. Citation2000), and CT treatment in IEC-17 cells stimulated both IL-1 and IL-6 secretion (Qadri et al. Citation2002). The development of inflammation and localised release of tumour necrosis factor (TNFα), high serum titres of IL-6 by accessory toxins of V. cholerae has been described in a mouse pulmonary cholera model (Fullner et al. Citation2002). This evidence suggests the existence of an inflammatory component in clinical cholera. A few reports have also revealed the release of IL-8 upon V. cholerae infection in the IECs (Rodriguez et al. Citation2001; Zhou et al. Citation2004). Previous reports from our laboratory have shown the release of IL-8 during cholera infection (Sarkar & Chaudhuri Citation2004) as well as the induction of pro-inflammatory cytokines like IL-1α, IL-1β, IL-6 and TNF-α in IECs upon V. cholerae infection (Bandyopadhaya et al. Citation2007). Extracellular signal-regulated kinases (ERK1/2), p38 mitogen-activated protein kinases (MAPK), have been reported by Caffrey et al. (Citation1999) to be extremely conserved during response to stress and immunity in macrophages and neutrophil activation. Furthermore the reports from our laboratory also suggested that V. cholerae flagellin could activate ERK1/2 and p38 MAPK in IECs (Bandyopadhaya et al. Citation2008).
Ginger is a rich source of antioxidants. 6G, a marker substance of ginger, has a wide array of pharmacological effects. Ginger and its constituents at doses up to 2.0 g daily have shown very low levels of toxicity and tolerability in both animals and humans with only mild gastrointestinal complaints being reported (Chrubasik et al. Citation2005). Young et al. (Citation2005) have reported anti-inflammatory activity of 6G. Evidence of anti-inflammatory activity of 6G have also been suggested by Kim et al. (Citation2005) where 12-O-tetradecanoylphorbol-13-acetate (TPA)-induced cyclooxygenase-2 (COX-2) expression is inhibited by 6G via the p38 MAPK nuclear factor kappa beta (NF-κB) signalling cascade in a mouse model. A recent study has demonstrated that the gingerol fraction from Zingiber officinale (Zingiberaceae) promotes anti-inflammatory activity during gentamycin-induced nephrotoxicity (Rodriguez et al. 2014). Furthermore, 6G inhibits TNFα-induced NF-κB transcription factor recruitment to pro-inflammatory gene promoters in marine IECs (Ruiz et al. Citation2007). Also, our recent publication showed that 6G binds to CT and in turn inhibits the binding of CT to the ganglioside galactosyl-N-acetylgalactosaminyl-(sialyl)-galactosylglucosylceramide (GM1) receptor present on the surface of human IECs (Saha et al. Citation2013). Unlike non-steroidal anti-inflammatory drugs (NSAIDs), 6G has no gastrointestinal and renal side effects. But little information is available on the effect of 6G in V. cholerae-induced inflammation in the gut lumen.
In the present study, we aimed at investigating the modulatory effect of 6G against V. cholerae-induced inflammatory response and the downstream signalling pathway in human epithelial cells – V. cholerae infection model. This finding might find its use in the management of V. cholerae-induced pathogenesis by 6G.
Materials and methods
Chemicals and reagents
Streptomycin, 2, 2-diphenyl-1-picrylhydrazyl (DPPH), Folin–Ciocalteu reagent, gallic acid, 2,2′-azobis (2-amidinopropane) dihydrochloride (ABAP), Hanks’ balanced salt solution (HBSS), dimethyl sulphoxide (DMSO) and 6G were purchased from Sigma-Aldrich (St. Louis, MO). CT-containing V. cholerae supernatant was prepared as follows. Vibrio cholerae O395 was grown for 16 h, and the cells were collected by centrifugation, washed and suspended in phosphate-buffered saline (PBS), and sonicated. The debris was further removed by centrifugation, and the supernatant was used for further experimentation.
Bacterial strains and growth conditions
Vibrio cholerae O395 cells carrying a streptomycin resistance marker were grown in Luria–Bertani (LB) medium with 1 mg/mL streptomycin and maintained in −70 °C in LB medium containing 20% (v/v) glycerol (Qualigens, Gujarat, India).
Cell culture and infection
Int407 (human IEC line) and HepG2 (liver hepatocellular carcinoma cell line) were purchased from NCCS, Pune, India. Int407 cells were grown and maintained in minimal essential medium (MEM) (GIBCO-BRL, Gaithersburg, MD) were supplemented with 10% foetal bovine serum (GIBCO-BRL, Gaithersburg, MD), 50 units/mL penicillin, 100 units/mL streptomycin and 100 μg/mL gentamicin in the presence of 5% CO2 at 37 °C. Cells were seeded in canted-neck T-75 tissue culture flasks (Falcon, Austin, TX). After the cells reached to 80–90% confluency, the medium was removed, the cells were washed with PBS, and fresh MEM, with or without antibiotic (whichever was appropriate) was added. Bacteria were grown overnight and suspended in fresh cell culture medium without antibiotic and then were added to Int407 cells at a multiplicity of infection (MOI) of ∼100. Control plates were replenished with fresh medium, and infected plates were incubated at 37 °C under 5% CO2.
Determination of the antioxidant activity of 6G
DPPH-radical scavenging assay was used to assess the antioxidant capacity of 6G. Various concentrations of 6G (10–100 μM) were mixed with a methanolic solution of DPPH (0.2 mM), and left to stand at room temperature (30 min) in the dark. The absorbance was read at 517 nm (EMax Precision Micro-Plate Reader, Molecular Devices, Sunnyvale, CA). The ability of 6G to scavenge DPPH was calculated using the following equation: % radical scavenging activity (RSA) = [(ADPPH−AS)/ADPPH] × 100, where ADPPH and AS are the absorbance of DPPH solution alone and with a particular concentration of 6G, respectively.
Determination of total phenolic content
Total phenolic content was determined as gallic acid equivalents (Lu et al. Citation2011). Sodium carbonate [2 mL, 20% (w/v)] was added to different concentrations of 6G solutions individually. Then, 0.1 mL Folin–Ciocalteu reagent (50% v/v) was added and the volume was adjusted to 10 mL H2O. After incubation at 30 °C for 1 h, the absorbance at 750 nm was measured and compared with a gallic acid calibration curve.
Cellular antioxidant activity (CAA) assay for 6G
Int407 and HepG2 cells were seeded at 6 × 10⁴ cells/well on a 96-well microplate in 100 μL of growth medium/well. Twenty-four hours after seeding cells were treated with 6G (10–100 μM) with 25 μM DCFH-FA dissolved in treatment medium for 1 h. Cells were washed with PBS and treated with 600 μM ABAP was applied to the cells in 100 μL of HBSS. Emission fluorescence intensity at 528 nm with excitation at 485 nm was recorded every 5 min for 1 h at 37 °C using spectrofluorimeter (LS-55, Perkin-Elmer, Waltham, MA). Cells treated with DCFH-FA and HBSS + ABAP were used as the positive control (+veC) and cells treated with DCFH-FA and, only HSBB without ABAP were used as the negative control (−veC). After subtraction of − veC from the fluorescence readings, CAA value of each 6G treatment was calculated by using area-under-the-curve (AUC) for the plot of fluorescence intensity against time. CAA value was calculated as, CAA = 100 − [1 − {AUC (6G)−AUC (−veC)}/{AUC (+veC)−AUC (−veC)}]. Afterwards, Fa/Fu, where Fa=CAA (fraction affected) and Fu = 100 − CAA (fraction unaffected) by the 6G treatment, was plotted against the concentration of 6G on double-logarithmic scale. EC50 value was determined as the concentration where Fa/Fu = 1 and linear regression equation was calculated.
MTT assay
The in vitro growth inhibition effect of 6G (10–100 μM) on Int407 and HepG2 cells was determined by using the 3-(4,5-dimethylthiazol-2-yl)-2,5-diphenyl-2-tetrazoliumbromide (MTT) assay. Briefly, cells were seeded in a 96-well microtitre plate. Exponentially growing cells were exposed to various concentrations of 6G for 24 h. MTT solution was added to each well, and the mixture was incubated for 4 h at 37 °C. To achieve solubilisation of formazan crystals formed in viable cells, 100 μL of DMSO was added to each well and the optical density was measured at 550 nm (OD550) (EMax precision microplate reader; Molecular Devices, Sunnyvale, CA). The percentage of cytotoxicity was calculated as cytotoxicity = (1−Atest/Acontrol) × 100.
RNA extraction, cDNA preparation and semiquantitative RT-PCR
Int407 cells, treated or untreated, were washed with PBS and total RNA was extracted from each group by RNeasy Mini Kit (Qiagen Inc., Valencia, CA). For cDNA preparation, 5 μg RNA was treated with RNAse-free DNase (GIBCO-BRL, Waltham, MA) in a 10 μL volume according to the protocol of the manufacturer. DNase-treated RNA (2 μL) were reverse transcribed using the SUPERSCRIPT ™ First-Strand Synthesis System (Invitrogen, Waltham, MA) with 0.50 μg oligo (dT) 12–18 with a total volume of 20 μL. The cDNA was synthesised at 42 °C for 50 min. c-DNA (2 μL) was PCR amplified in a 30 μL reaction volume containing 10 mM Tris/HCl (pH 8.3), 50 mM KCl, 1.5–2.5 mM MgCl2, 0.26 mM of each dNTPs and 25 pmol of each primer as described earlier (Bandyopadhaya et al. Citation2007). For each chemokine gene, the primers were designed using primer3 software (GraphPad Software, La Jolla, CA). To determine the chemokine gene expression, reactions were heat denatured for 5 min at 95 °C and then were amplified with 35 PCR cycles each comprising successive incubations at 95 °C for 30 s, annealing (52–57 °C) for 1 min and extension at 72 °C for 30 s. A further extension step was done at 72 °C for 7 min. PCR experiments were followed as described (Rimoldi et al. Citation2005). All PCR reactions were normalised by the expression of the gene-encoding glyceraldehyde-3-phosphate dehydrogenase (GAPDH). Amplicons were identified by ethidium bromide staining of agarose gels and scanned in gel documentation system (BioRad, Hercules, CA).
Western blot analysis
Samples were loaded on SDS-polyacrylamide gel (12%), and electrophoresis was carried out as described earlier (Chakrabarti et al. Citation1996). The gel was then electro-transferred to polyvinylidene difluoride (PVDF) membrane (Millipore, Billerica, MA) and analysed for the extracellular signal-regulated kinases (ERK1/2 or p44/42 mitogens-activated protein kinases (MAPK) by Western blots. The primary antibodies (1:1000 dilution) used were rabbit phospho-p44/42 (ERK) MAPK, p44/p42 MAPK, p38, phospho-p38, inhibitor of nuclear factor of kappa light polypeptide gene enhancer alpha (IκBα) and p65 (1:1000, Cell Signalling Technology, Danvers, MA), and mouse β-actin (1:5000 dilution, Sigma, St. Louis, MO) in Tris-buffered saline and Tween 20 (TBST) buffer containing 5% BSA. The secondary antibodies used were alkaline phosphatase (ALP)-conjugated goat anti-rabbit IgG or rabbit anti-mouse IgG (GENEI) at 1:2000 dilutions. The ALP positive bands were visualised in a developing solution of 1 × 5-bromo-4-chloro-3-indolyl phosphate/nitro blue tetrazolium (1 × BCIP/NBT [GENEI]) in dark (Bandyopadhaya et al. Citation2007).
Elisa
IL-8, IL-6, IL-1α and IL-1β concentrations were determined by commercially available ELISA kits (R&D Systems, Minneapolis, MN). Int 407 supernatant was taken as a negative control and test samples were Int 407-V. cholerae infection treated with various doses of 6G.
Statistical analysis
All the data were recorded as the mean and standard deviation (mean ± SD) from at least three different experiments. Differences in the mean values were analysed by Student's t-test. The CAA value and linear regression analysis were calculated by using GraphPad prism 5 software (GraphPad Software, La Jolla, CA). The correlation between CCA and RSA (%) was calculated by using non-parametric test. The semiquantitative RT-PCR and Western blots were quantified by using the image analysis software Image-J (NIH, Bethesda, MD) (http://rsb.info.nih.gov/ij/index.html). The p value <0.05 was considered as level of significance.
Results
Effect of 6G on cell viability
To determine whether 6G has any cytotoxic effect on the Int407 and HepG2 cells, MTT assay was performed with 0, 20, 40, 50, 70, 100, 200 and 400 μM 6G. No significant reduction in tetrazolium salt reflecting decrease in formazan production was observed for 6G up to 100 μM on both Int407 and HepG2 cells (Supplementary Figure 1). 6G of 50 μM of was reported to have 30% cytotoxicity and higher doses reported almost 35–40% cytotoxicity. Hence, further experiments were carried out with a 50 μM dosage of 6G.
Reduction of pro-inflammatory cytokines with treatment of 6G
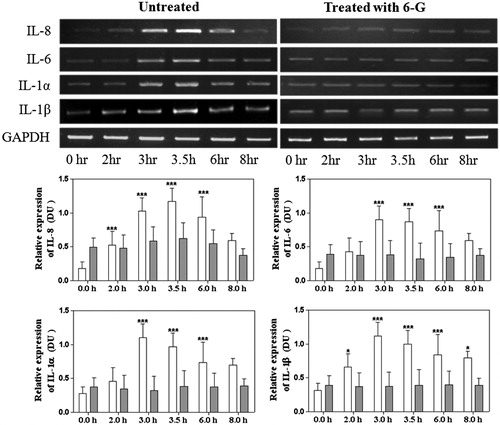
To determine whether 6G is able to reduce the pro-inflammatory cytokine production in human IECs (Int 407) followed by V. cholerae infection, Int407 cells were pre-treated with 6G for 1 h and then infected with V. cholerae at MOI 100 (bacteria/cell). The expression of IL-8, IL-6, IL1α and IL1β was determined in the supernatant of 6G-treated and -untreated IECs after 2, 3, 3.5, 6 and 8 h by ELISA (). The V. cholerae-induced Int 407 cells show an increase in all cytokine levels at different time points. However, the rise in cytokine level was subdued by pre-treatment with 50 μM dosages of 6G. In our previous publication, we have reported that 6G has no antibacterial effect up to a concentration of 100 μg/mL towards V. cholerae O395 (Saha et al. Citation2013). Hence the possibility that 6G has reduced the bacterial growth and thus modulated its inflammatory effect could be negated. The next obvious question to ask is whether the decrease in cytokine expression is at the transcriptional level. To resolve this, mRNA expression specificity of the above cytokines was examined from the same time point by RT-PCR (). The RT-PCR data were clearly corroborated with the ELISA result. This indicates that with treatment of 6G, the increased mRNA levels of the cytokines in V. cholerae infected IECs have reduced both in mRNA and in protein level.
Figure 1. The representation of quantitative bar diagram of the cytokine levels in intestinal epithelial cells by ELISA without treatment of 6G (white colour bar) or with treatment of 6G (grey colour bar) post V. cholerae infection at different time points. Int 407 cells were treated with 6G and were stimulated with V. cholerae for 0, 2, 3, 3.5, 6 and 8 h and analysed by ELISA for IL-8, IL-6, IL-1 α and IL-1 β. The bar diagram represents data in mean ± SD of three independent experiments. The standard deviation is shown by the error bars (*, ** and *** represents level of significance at <0.05, <0.001 and <0.0001, respectively).
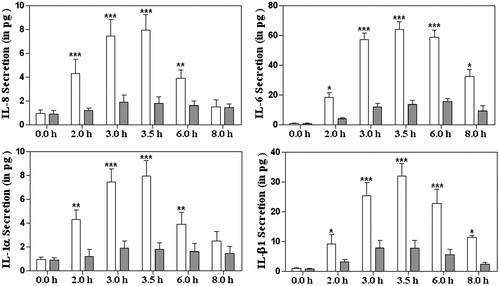
Figure 2. The representation and quantitification of cytokines levels at the mRNA levels in intestinal epithelial cells without treatment of 6G (white colour bar) or with treatment of 6G (grey colour bar) post V. cholerae infection at different time points. Int 407 cells were treated with 6G and were stimulated with V. cholerae for 0, 2, 3, 3.5, 6 and 8 h, mRNA extracted and RT-PCR was performed for IL-8, IL-6, IL-1 α and IL-1 β. The bar diagram represent data in mean ± SD of three independent experiments. The standard deviation is shown by the error bars (* and *** represents level of significance at <0.05 and <0.0001, respectively).
Activation of ERK1/2 and p38 by V. cholerae and its modulation with 6G
To determine whether 6G exposure affects the activity of the specific factors involved in signalling, we used antibody against phosphorylated ERK 1/2 and p38 to examine the effect of 6G on MAPK pathways induced by V. cholerae using Western blot. The immunoblot data revealed that V. cholerae-stimulated IECs showed an increase in ERK 1/2 and p38 phosphorylation after 15 and 30 min of treatment (). However, the ERK1/2 and p38 activity was substantially reduced by the treatment of 50 μM 6G.
Figure 3. Effects of 6G on ERK, p38 MAP-kinase, Iκ-Bα activation and reduction of p-65 post V. cholerae infection in intestinal epithelial cells without treatment of 6G (white colour bar) or with treatment of 6G (grey colour bar) post V. cholerae infection at different time points. Int 407 cells were treated with 6G which were stimulated with V. cholerae for 0, 10, 15, 30, 60 and 90 min and samples were run on SDS-PAGE and proteins were blotted on PVDF membrane. The blots were probed with anti-phospho-ERK1/2 anti-phospho-p38 and normalisation of the p-ERK1/2 and p-p38 was carried out with non-phosphorylated ERK1/2 and p38, respectively. The blots were probed with anti-p65 and anti-IκBα (G&H) and normalisation of the p-65 and IκBα was carried out with β-actin. The bar diagram represent data in mean ± SD of three independent experiments. The standard deviation is shown by the error bars. ** and *** represents level of significance at <0.001 and <0.0001 respectively). Int 407 epithelial without treatment of 6G (white colour bar) or with treatment of 6G. [*] Denotes level of significance at < 0.05.
![Figure 3. Effects of 6G on ERK, p38 MAP-kinase, Iκ-Bα activation and reduction of p-65 post V. cholerae infection in intestinal epithelial cells without treatment of 6G (white colour bar) or with treatment of 6G (grey colour bar) post V. cholerae infection at different time points. Int 407 cells were treated with 6G which were stimulated with V. cholerae for 0, 10, 15, 30, 60 and 90 min and samples were run on SDS-PAGE and proteins were blotted on PVDF membrane. The blots were probed with anti-phospho-ERK1/2 anti-phospho-p38 and normalisation of the p-ERK1/2 and p-p38 was carried out with non-phosphorylated ERK1/2 and p38, respectively. The blots were probed with anti-p65 and anti-IκBα (G&H) and normalisation of the p-65 and IκBα was carried out with β-actin. The bar diagram represent data in mean ± SD of three independent experiments. The standard deviation is shown by the error bars. ** and *** represents level of significance at <0.001 and <0.0001 respectively). Int 407 epithelial without treatment of 6G (white colour bar) or with treatment of 6G. [*] Denotes level of significance at < 0.05.](/cms/asset/e5cedd98-e663-467e-9ad0-cb8c742fea4e/iphb_a_1110598_f0003_b.jpg)
Effect of 6G on phosphorylation of IκBα and p65 in IECs
Activation of MAPKs pathway involves the activation of NF-κB which in turn is responsible for the translocation of transcription factor p65 to the nucleus which is involved in V. cholera infection and hence causes an increase in the synthesis of the pro-inflammatory cytokines downstream. We further investigated the role of 6G in the p65 translocation and observed down-regulation of p65 with the administration of 6G. The inhibitor of p65 is IκBα which is activated by phosphorylation and blocks p65 translocation. Stimulation of epithelial cells with V. cholerae caused significant degradation of IκBα at 10 and 15 min that leads to NF-κB activation. With treatment of 6G, we observed increase in phosphorylated IκBα which directs that p65 is down-regulated, which could result in down-regulation of the pro-inflammatory cytokines () and also decreased levels of p65 in cells treated with 6G which also corroborates to the fact that 6G causes a decrease in free p65 levels and thus a down-regulation in NF-κB pathways ().
Cellular antioxidant activity of 6G
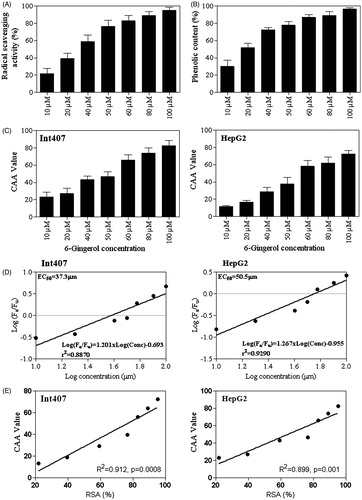
Reactive oxygen species (ROS) often act as signalling molecules to stimulate proinflammatory cytokine production (Naik & Dixit Citation2011). 6G is reported to have antioxidant properties and has been proven to be anti-inflammatory in several cases. Hence, we assessed the antioxidant potential of 6G by DPPH free radical scavenging assay both in vitro and in vivo or cellular environment. Experimental results revealed that the antioxidant capacity of 6G increases in vitro gradually with increasing up to 50 μM concentration of 6G and then levelled off (). At 50 μM 6G concentration, 76.57 ± 7.205% antioxidant activity was observed. Total phenolic content was also measured with the Folin–Ciocalteu method and 6G showed linear increases in the phenolic content along with an increase in the concentration (). Intracellular antioxidants activity of 6G was measured in Int407 and HepG2 cells following the assay procedure based on Wolfe and Liu (Citation2007). 6G showed remarkable inhibition of oxidation induced by 2′,7′-dichlorofluorescin DCFH. The CAA value for 6G at increasing concentration (10–100 μM) to DCFH oxidation in both Int407 and HepG2 cells by peroxyl radicals generated from ABAP is shown in . The CAA values for Int407 cell for 6G at 50 μM and 100 μM were 46.57 and 83.44, respectively. While the CAA values for HepG2 cell at 50 μM and 100 μM were 39.23 and 73.12, respectively. This suggested that the intracellular antioxidant activity of 6G varies in a dose-dependent manner and has the sensitivity for Int407 cell than HepG2 cells. The EC50 value was further calculated by Fa/Fu from the linear regression of the median effect curve (). The EC50 values of 6G for Int407 and HepG2 cells were found to be 37.3 μM and 50.5 μM, respectively. The relationship between CAA values and RSA (%) was significantly correlated (R2 = 0.912, p = 0.0008 for Int407 and R2 = 0.899, p = 0.001 for HepG2) ().
Figure 4. (A) Total anti-oxidant capacity of 6G at various concentrations (10–100 μM) by DPPH radical scavenging activity assay (RSA). (B) Total phenolic content of 6G at various concentrations (10–100 μM) by the Folin–Ciocalteu reagent against gallic acid equivalents. (C) The CAA value of 6G in Int407 and HepG2 cells treated with various concentrations (10–100 μM). (D) Median effect plots for inhibition of peroxyl radical-induced DCFH oxidation by 6G for Int407 and HepG2 cells. (E) The correlation between CCA and RSA (%) for Int407 and HepG2 cells was calculated by using spearman correlation test (R2, spearman coefficient and p-value with level of significance <0.05). The bar diagram represent data in mean ± SD of three independent experiments. The standard deviation is shown by the error bars.
Discussion
Ginger is the medicinal plant with interesting pharmacological and physiological activities such as antioxidant, anti-inflammatory and antitumour promoting activities (Surh Citation1999). Antioxidant effect of ginger extracts due to the formation of free radicals and lipid peroxidation has been reported (Surh Citation1999; Ahmed et al. Citation2000). Chemoprotective and antipoliferative effects in gastric-intestinal cancers and induced apoptosis activity in pro-myelocytic leukaemia HL-60 cells for 6G have been reported by Lee and Surh (Citation1998) and Park et al. (Citation2006). Also, the advantageous effects in the prevention of several tissues damage including heart and kidney of 6G have been reported (Kuhad et al. Citation2006). Apart from this, the chemical constituents found in ginger are very effective in decreasing the symptoms of rheumatoid arthritis (Srivastava & Mustafa Citation1992) and suppression of both cyclo-oxygenase and lipoxygenase (Tjendraputra et al. Citation2001). The organic extracts from ginger rhizomes inhibited LPS-induced PGE2 production in U937 cells and suggested to be predominant involvement of gingerols or shogaols at inhibiting LPS-induced PGE2 production (Jolad et al. Citation2005). However, there is no such report of 6G on bacteria-induced inflammation in the host system. This is to our best knowledge first report where 6G is involved in reducing V. cholerae-induced inflammation in IECs. This study also elucidates the signalling pathways which are down-regulated when treated with 6G.
Over the past few decades, antibiotic pressure has caused the evolution of resistant V. cholera to every clinically used antibiotic. Accumulating evidence suggests the acceptance of herbal drugs in reducing the severity of inflammation associated with cholera. In brief, it can be stated that herbal therapy can be developed as a tool of anti-inflammatory drug. In inflammatory response, activated neutrophil releases several free radicals. It has been reported that extracts of natural products impart their anti-inflammatory activity by means of elevated antioxidant activities (Wang et al. 2013). Our experiments revealed that 6G posses >75% antioxidative activity by DPPH assay at a concentration of 50 μM of 6G and intracellular antioxidant activity in Int407 cells with EC50 value = 37.3 μM. Likely, the mitigation in inflammatory response in V. cholerae infected IECs. The decrease in cytokine expression was also verified at the transcriptional level as mRNA expression specifically for the above cytokines decreased with treatment of 6G in V. cholera-infected IECs.
Studies were also undertaken to assess signalling pathways involved with the anti-inflammatory effects of 6G. Our laboratory previously reported the stimulation of ERK1/2 and p38 activity in response to V. cholera infection leads to the activation of the NF-κB transcriptional factors (Bandyopadhaya et al. Citation2008) which remain as dimers and in bound state to inhibitory proteins IκBα in un-stimulated cells. A response to inflammation or stress includes phosphorylation of IκBα which in turn releases the NF-κB dimer. The released NF-κB dimer translocates to the nucleus and stimulates the transcription of the target Int407 cells treated with 50 μM of 6G may be due to its antioxidant property without hampering a viability of Int 407 cells.
Inflammatory response to V. cholerae is characterised by secretion of several pro-inflammatory cytokines in the intestinal epithelium (Speelman et al. Citation1985; Qadri et al. Citation2002). Chemotactic cytokines like IL-8, IL-6, IL1-β and IL-1α are released from infected IECs and are responsible in regulating inflammation of the epithelial mucosa in V. cholera infection (Jang & Kim Citation2002). 6G administration produces a significant reduction of these pro-inflammatory cytokines in the genes. Our previous publications have also shown association of increased NF-κB activity in V. cholera-infected cells with the up-regulation of pro-inflammatory cytokines (Bandyopadhaya et al. Citation2007). To be more precise, we have also shown higher levels of NF-κB-p65 (ser536) in V. cholera-infected cells (Bandyopadhaya et al. Citation2007). Our present immunoblot data are consistent with our previous findings and also revealed the down-regulation in levels of ERK1/2 and p38 activity on the administration of 6G. Our previous studies have shown the association of cytokine expression along with the activation of NF-κB-p65 (Bandyopadhaya et al. Citation2007). Interestingly, we found out reduction of NF-κB-p65 expressions of 6G-treated infected cells in comparison with untreated cells. As a result, we can come to the conclusion that the anti-inflammatory effect of 6G may be mediated by its deactivation of NFκB-p65, leading to a fall in cytokine levels. We also noticed higher levels of IκBα protein on the application of 6G in cholera-infected cells. Our result suggested that 6G may exert its anti-inflammatory activity by inhibiting phosphorylation of IκBα. Indeed, our results map a probable mechanism by which aggravated inflammation associated with V. cholera can be reduced by 6G.
Conclusions
In summary, our data strongly supported the fact that 6G inhibits the subsequent release of pro-inflammatory cytokines in IECs following V. cholerae infection. Our data propose that 6G could be considered as a potential therapeutic for pathogenic process initiated by V. cholerae. Thus, this present study is a comprehensive investigation of anti-inflammatory activity and the mode of action of 6G during V. cholerae infection. However, further study is required to be undertaken to elucidate the current findings.
Declaration of interest
The work was supported by the Council of Scientific & Industrial Research (CSIR), Govt. of India. P. S. and B. D. are grateful to CSIR for a research fellowship and A. K. is grateful to ICMR for a senior research fellowship.
References
- Ahmed RS, Seth V, Banerjee BD. 2000. Influence of dietary ginger (Zingiber officinales Rosc) on antioxidant defense system in rat: comparison with ascorbic acid. Indian J Exp Biol. 38:604–606.
- Bandyopadhaya A, Sarkar M, Chaudhuri K. 2007. Transcriptional upregulation of inflammatory cytokines in human intestinal epithelial cells following Vibrio cholerae infection. FEBS J. 274:4631–4642.
- Bandyopadhaya A, Sarkar M, Chaudhuri K. 2008. IL-1beta expression in Int407 is induced by flagellin of Vibrio cholerae through TLR5 mediated pathway. Microb Pathog. 44:524–536.
- Caffrey DR, O'Neill LA, Shields DC. 1999. The evolution of the MAP kinase pathways: coduplication of interacting proteins leads to new signaling cascades. J Mol Evol. 49:567–582.
- Chakrabarti SR, Chaudhuri K, Sen K, Das J. 1996. Porins of Vibrio cholerae: purification and characterization of OmpU. J Bacteriol. 178:524–530.
- Chrubasik S, Pittler MH, Roufogalis BD. 2005. Zingiberis rhizoma: a comprehensive review on the ginger effect and efficacy profiles. Phytomedicine 12:684–701.
- Fullner KJ, Boucher JC, Hanes MA, Haines III GK, Meehan BM, Walchle C, Sansonetti PJ, Mekalanos JJ. 2002. The contribution of accessory toxins of Vibrio cholerae O1 El Tor to the proinflammatory response in a murine pulmonary cholera model. J Exp Med. 195:1455–1462.
- Jang CH, Kim YH. 2002. Characterization of cytokines present in pediatric otitis media with effusion: comparison of allergy positive and negative. Int J Pediatr Otorhinolaryngol. 66:37–40.
- Jolad SD, Lantz RC, Chen GJ, Bates RB, Timmermann BN. 2005. Commercially processed dry ginger (Zingiber officinale): composition and effects on LPS-stimulated PGE2 production. Phytochemistry 66:1614–1635.
- Kaper JB, Morris JG Jr, Levine MM. 1995. Cholera. Clin Microbiol Rev. 8:48–86.
- Kim SO, Kundu JK, Shin YK, Park JH, Cho MH, Kim TY, Surh YJ. 2005. [6]-Gingerol inhibits COX-2 expression by blocking the activation of p38 MAP kinase and NF-kappaB in phorbol ester-stimulated mouse skin. Oncogene 24:2558–2567.
- Kuhad A, Tirkey N, Pilkhwal S, Chopra K. 2006. 6-Gingerol prevents cisplatin-induced acute renal failure in rats. Biofactors 26:189–200.
- Lee E, Surh Y-J. 1998. Induction of apoptosis in HL-60 cells by pungent vanilloids, [6]-gingerol and [6]-paradol. Cancer Lett. 134:163–168.
- Lu X, Rasco BA, Jabal JMF, Aston DE, Lin M, Konkel ME. 2011. nvestigating antibacterial effects of garlic (Allium sativum) concentrate and garlic-derived organosulfur compounds on Campylobacter jejuni by using Fourier Transform Infrared Spectroscopy, Raman Spectroscopy, and Electron Microscopy. Anal Chem. 83:4137–4146.
- Naik E, Dixit VM. 2011. Mitochondrial reactive oxygen species drive proinflammatory cytokine production. J Exp Med. 208:417–420.
- Park YJ, Wen J, Bang S, Park SW, Song SY. 2006. [6]-Gingerol induces cell cycle arrest and cell death of mutant p53-expressing pancreatic cancer cells. Yonsei Med J. 47:688–697.
- Qadri F, Raqib R, Ahmed F, Rahman T, Wenneras C, Das SK, Alam NH, Mathan MM, Svennerholm AM. 2002. Increased levels of inflammatory mediators in children and adults infected with Vibrio cholerae O1 and O139. Clin Diagn Lab Immunol. 9:221–229.
- Rimoldi M, Chieppa M, Salucci V, Avogadri F, Sonzogni A, Sampietro GM, Nespoli A, Viale G, Allavena P, Rescigno M. 2005. Intestinal immune homeostasis is regulated by the crosstalk between epithelial cells and dendritic cells. Nat Immunol. 6:507–514.
- Rodríguez BL, Rojas A, Campos J, Ledon T, Valle E, Toledo W, Fando R. 2001. Differential interleukin-8 response of intestinal epithelial cell line to reactogenic and nonreactogenic candidate vaccine strains of Vibrio cholerae. Infect Immun. 69:613–616.
- Ruiz PA, Braune A, Hölzlwimmer G, Quintanilla-Fend L, Haller D. 2007. Quercetin inhibits TNF-induced NF-kappaB transcription factor recruitment to proinflammatory gene promoters in murine intestinal epithelial cells. J Nutr. 137:1208–1215.
- Saha DR, Niyogi SK, Nair GB, Manna B, Bhattacharya SK. 2000. Detection of faecal leucocytes & erythrocytes from stools of cholera patients suggesting an evidence of an inflammatory response in cholera. Indian J Med Res. 112:5–8.
- Saha P, Das B, Chaudhuri K. 2013. Role of 6-gingerol in reduction of cholera toxin activity in vitro and in vivo. Antimicrob Agents Chemother. 57:4373–4380.
- Sarkar M, Chaudhuri K. 2004. Association of adherence and motility in interleukin 8 induction in human intestinal epithelial cells by Vibrio cholerae. Microbes Infect. 6:676–685.
- Sears CL, Kaper JB. 1996. Enteric bacterial toxins: mechanisms of action and linkage to intestinal secretion. Microbiol Rev. 60:167–215.
- Speelman P, Rabbani GH, Bukhave K, Rask-Madsen J. 1985. Increased jejunal prostaglandin E2 concentrations in patients with acute cholera. Gut. 26:188–193.
- Srivastava KC, Mustafa T. 1992. Ginger (Zingiber officinale) in rheumatism and musculoskeletal disorders. Med Hypotheses. 39:342–348.
- Surh Y-J. 1999. Molecular mechanisms of chemopreventive effects of selected dietary and medicinal phenolic substances. Mutat Res. 428:305–327.
- Tjendraputra E, Tran VH, Liu-Brennan D, Roufogalis BD, Duke CC. 2001. Effect of ginger constituents and synthetic analogues on cyclooxygenase-2 enzyme in intact cells. Bioorg Chem. 29:156–163.
- Wang BS, Huang GJ, Lu YH, Chang LW. 2007. Anti-inflammatory effects of an aqueous extract of Welsh onion green leaves in mice. Food Chem. 138:751–756.
- Wolfe KL, Liu RH. 2007. Cellular antioxidant activity (CAA) assay for assessing antioxidants, foods, and dietary supplements. J Agric Food Chem. 55:8896–8907.
- Young HY, Luo YL, Cheng HY, Hsieh WC, Liao JC, Peng WH. 2005. Analgesic and anti-inflammatory activities of [6]-gingerol. J Ethnopharmacol. 96:207–210.
- Zhou X, Gao DQ, Michalski J, Benitez JA, Kaper JB. 2004. Induction of interleukin-8 in T84 cells by Vibrio cholerae. Infect Immun. 72:389–397.