
Abstract
Context: Naringenin, a flavonone and a nutritive antioxidant which is mostly obtained from grapefruit, orange or tomato skin, has been extensively studied due to its radical scavenging activity.
Objective: The present study investigates the protective effect of naringenin on rat kidney after streptozotocin-induced diabetes.
Materials and methods: Sixty male Wistar rats were divided into six groups. Diabetes was induced by a single intraperitoneal injection of streptozotocin (50 mg/kg) in groups II, III and IV. Naringenin 5 mg/kg body weight was given to groups III and V, but 10 mg/kg was given to groups IV and VI, orally once a day for 10 weeks. After which all animals were sacrificed, and the biochemical, histopathological, immunohistochemical and apoptotic assays were conducted.
Results: Naringenin treatment with 5 and 10 mg/kg significantly decreased (p < 0.05) the serum biochemical parameters, elevated tissue malondialdehyde levels and increased (p < 0.01) the reduced superoxide dismutase, catalase and reduced glutathione enzyme activities in the diabetic kidney. Diabetes-induced naringenin-treated groups showed an improved histology and revealed a significant reduction in apoptosis activity (7.2 ± 0.01 and 1.8 ± 0.05) and in expression of TGF-β1 (18.9 ± 3.4 and 10.2 ± 2.1) at a dose of 5 and 10 mg/kg, respectively. Similarly, in contrast to the diabetic group, a significant difference was observed in the IL-1 expression (15.68 ± 4.3) in 5 mg/kg and (9.85 ± 2.1) in 10 mg/kg naringenin-treated groups.
Conclusion: Naringenin acts as a protective agent in diabetic renal impairment by altering oxidative stress, modulation of cytokines expression and apoptotic events.
Introduction
Diabetes mellitus, characterised as a chronic metabolic disorder, has become a major concern for a healthy society and shows high prevalence rate (Wild et al. Citation2004). It has been estimated that diabetes mellitus will increase by 65% in 2030 worldwide and, in India, this increase is estimated to be 58% in 2030 (Ramachandran & Snehalata et al. Citation2009). There is a strong association between hyperglycaemia and the incidence as well as progression of microvascular and macrovascular complications (Klein Citation1995). Diabetic nephropathy (DN) is a common complication in patients with either type 1 or type 2 diabetes mellitus (Remuzzi et al. Citation2002). It is now the first cause of end-stage renal disease (ESRD) and it is estimated that ∼20% of diabetic patients reach ESRD during their lifetime leading to severe morbidity and mortality (Ayodele et al. Citation2004).
Various hyperglycaemia-induced metabolic and hemodynamic derangements, including increased formation of advanced glycation end products (AGEs), enhanced reactive oxygen species (ROS) generation, activation of protein kinase C (PKC), polyol pathway and renin–angiotensin system (RAS), are considered to contribute to the development and progression of diabetic nephropathy (Yamagishi & Imaizumi Citation2005). Elevated levels of glucose during diabetes cause oxidative stress, creating an imbalance between production of reactive oxygen species (ROS), and limit the antioxidant defence mechanism present in biological systems (Bonnefont Citation2002). The implication of oxidative stress in the pathogenesis of diabetes is suggested, not only by oxygen free-radical generation but also due to auto-oxidation of glucose (Mullarkey et al. Citation1990), impaired glutathione metabolism (Mclennan et al. Citation1991), alteration in antioxidant enzymes (Strain Citation1991) and lipid peroxides formation (Baynes Citation1991). Hyperglycaemia induces expression of various proinflammatory cytokines like TGF-β, IL-1, IL-6, NF-kβ and TNF-α in the glomerulus of diabetic kidney (Cochrane & Robinson Citation1995). Emerging evidence suggests that transforming growth factor-β (TGF-β) is an important mediator of diabetic nephropathy (Ziyadeh et al. Citation2000) and TGF-β shows a causal role in the structural and functional abnormalities of diabetic nephropathy (Ziyadeh et al. Citation2000). Apoptosis plays an important role in the development and function of renal cell (Kerr et al. Citation1995). It is prominent during acute or chronic kidney disorder (Andrade et al. Citation2000) and contributes to the late structural abnormalities in the diabetic kidney (Nagata Citation1997). It was suggested that apoptosis may be more operative in hypertrophic glomeruli, resulting in fewer glomerular cells and podocytes in diabetic nephropathy (Jung et al. Citation2012).
Flavonoids are naturally occurring polyphenolics phytoconstituents present in fruits, vegetables, tea, wine and grains (Hertog et al. Citation1993). Due to their abundance of dietary products and their potential beneficial pharmacological and nutritional effects, the flavonoids are of considerable interest for drug as well as a health food supplement.
Flavonoids have drawn attention in recent years in the area of diabetes and its post complications. Naringenin, a flavanone, is responsible for the bitter taste in grapefruits and has been extensively studied in recent years. In vivo studies have demonstrated its potential as a normolipidemic agent in reducing circulating levels of low-density lipoprotein (LDL) (Jung et al. Citation2003) and VLDL (Kurowska et al. Citation2004). Similarly, the cholesterol-lowering effects of naringenin have been demonstrated in rabbits (Kurowska et al. Citation2000) and rats (Kim et al. Citation2006). It was demonstrated that naringenin acts as PPARϒ agonist and inhibits LXRa activation. Naringenin also ameliorates the dyslipidemia leading to decreased atherosclerosis in rats (Erin et al. Citation2011). It was demonstrated that naringenin is useful for activating insulin-signalling pathways important for the regulation of hepatocyte lipid homeostasis and naringenin is a non-toxic assembly inhibitor of HCV (Goldwasser et al. Citation2011).
The role of naringenin in diabetes-associated nephropathy has not yet been evaluated; therefore, the present study was designed to demonstrate the effect of naringenin on the glucose homeostasis, antioxidant defence systems, serum biochemical parameters, histological changes and cell damage biomarkers which correlate with apoptosis in streptozotocin-induced diabetic rat kidneys.
Materials and methods
Animals
Male Wistar rats (140–180 g) were procured from Indian Institute of Chemical Biology, Kolkata, India, and were used for the experiment. Rats were maintained in an air-conditioned room (20 ± 1 °C) with a normal night and day cycle. Rats were fed according to the standard diet and demineralised drinking water ad libitum. The rats were allowed to acclimatise to the laboratory environment for a week before the start of the experiment. All experimental procedures were conducted in conformity with Institutional Animal Ethics committee CPCSEA (Reg. no. 1458/PO/a/11/CPCSEA) for the care and use of animals and were strictly followed throughout the study.
Experimental design
After acclimatisation, rats were randomly divided into six groups with 10 animals in each.
Group I – Control.
Group II – Untreated diabetic rats.
Group III – STZ + naringenin (5 mg/kg).
Group IV – STZ + naringenin (10 mg/kg).
Group V – Naringenin alone treated rats (5 mg/kg).
Group VI – Naringenin alone treated rats (10 mg/kg).
Experimental procedure
Diabetes was induced in groups II, III and IV rats following overnight fasting by a single intraperitoneal (i.p.) injection of streptozotocin (50 mg/kg). Streptozotocin was dissolved in a freshly prepared 0.01 M citrate buffer at pH 4.5 while control rats were injected with buffer alone. Streptozotocin-injected animals were given 5% glucose for 24 h to prevent initial streptozotocin-induced hypoglycaemic mortality. An experiment was conducted up to 10 weeks. Naringenin was administered via orogastric route by dissolving in distilled water.
After 10 weeks of the experiment, blood samples were collected from a retro-orbital vein for the biochemical estimations, then rats were sacrificed by ether anaesthesia and kidneys were isolated for histopathological and immunohistochemical studies.
Dose selection of naringenin
The doses of naringenin 5 and 10 mg/kg body weight/day were selected based on the previously reported article where naringenin acts as a protective and antioxidant agent in STZ-induced diabetic rat (Roy et al. Citation2013). In the present study, rats were treated with naringenin (5 and 10 mg/kg) given once a day orally for 10 weeks, starting 3 d after STZ injection.
Chemicals
Streptozotocin, naringenin, proteinase K, biotinylated rabbit anti-mouse IgG, hydrogen peroxidase and diaminobenzidine tetra hydrochloride (DAB) were obtained from Sigma Chemicals (St. Louis, MO). In situ apoptotic kit was purchased from Takara Inc. Ltd. (Shiga, Japan). The rabbit anti-mouse TGF-β1 and IL-1 antibody were purchased from Biolegend (San Diego, CA). All other chemicals and reagents used were of analytical grade and purchased in the purest form, available from local firms.
Biochemical assays
Blood glucose level, serum cholesterol, high-density lipoprotein (HDL) cholesterol, low-density lipoprotein (LDL) cholesterol, very low-density lipoprotein (VLDL) cholesterol, triglycerides, creatinine, urea and albumin were estimated by using commercially available biochemical estimation kits from Autospan (Gujarat, India).
Antioxidant enzyme activity and lipid peroxidation
The lipid peroxidation in the control and all treated groups of animals was measured by the quantification of thiobarbituric acid reactive substances (TBARS) determined by the method of Buege & Aust (Citation1984). The activity of superoxide dismutase (SOD) in the kidneys of control and treated rats was measured by the xanthine – the xanthine oxidase cytochrome C method (Reddi & Davalos 1997). The activities of reduced glutathione (GSH) and catalase were measured by the modified method of Pagila &Valentine (Citation1967) and Johansson &Hakan Borg (Citation1988).
Histological examination
Ten weeks after the experiment, animals from each group were randomly selected. A portion of the kidneys was excised from ether-anaesthetised rat fixed in 10% formalin and processed for histological studies. Tissues were dehydrated through 70, 90 and 100% alcohol and embedded in low melting point paraffin wax. Sections of 4 μm thickness were cut and placed serially on a glass slide. The sections were deparaffinised in xylene and rehydrated through 100, 90 and 70% alcohol. Three continuous sections were made from each kidney tissue and stained with haematoxylin and eosin for histological evaluation using light microscopy.
Immunohistochemical analysis
Immunostaining of TGF-β1 and IL-1: immunohistochemical detection of TGF-β1 and IL-1 protein in cold acetone-fixed, paraffin-embedded kidney section was performed by the avidin–biotin–peroxidase complex method (Jin et al. Citation2002). Briefly, 5 μm thin sections of lysine-coated slides were deparaffinised and rehydrated. For immunolabelling of TGF-β1 and IL-1 antigen, retrievals were facilitated by 50 μg of proteinase K on the section for 10 min. Endogenous peroxidase activity was blocked with 1% H2O2 in 0.1 M Tris NaCl, (pH 7.6) for 30 min. Then sections were incubated overnight at 4 °C with the primary antibody. Sections were then incubated with secondary antibody, goat anti-rabbit IgG, for 30 min at 37 °C with 1:100 dilution. This was followed by incubation with hydrogen peroxidase for 1 h. After that, 100–400 μL of DAB reagent was added to each section, as soon as sections turn brown, the slides were immersed in double-distilled water (ddH2O). Then slides were counter-stained with Harris haematoxylin for 2 min. The tissue sections washed in ddH2O for 5 min each. The sections are dehydrated and mounted with DPX and served as a positive control. The percentage of immunopositive cells was counted under a light microscope.
Apoptosis by TUNEL assay
Apoptotic cells in kidney tissue sections were determined by terminal deoxynucleotidyl transferase (TdT)-mediated dUTP nick end labelling (TUNEL) assay. The sections were digested with proteinase K (20 μg/mL) for 15 min at room temperature, and rinsed with double-distilled water. Slides were then quenched by 2% H2O2 for 5 min at room temperature, equilibrated with buffer and then incubated with TdT buffer (30 mM Trizma base, pH 7.2, 140 mM sodium cacodylate and 1 mM cobalt chloride), followed by TdT reaction solution containing TdT and dUTP for 90 min at 37 °C, then washed with 2% standard saline citrate to stop the reaction for 10 min at room temperature. The slides were then washed with PBS for 5 min each and incubated with hydrogen peroxidase for 30 min (1:100) at room temperature. Colour was developed using 0.05% 3,3′-dimethyl aminobenzene in 0.01% H2O2 diluted with Tris HCl (pH 7.5), then lightly counterstained with methyl green stain. Sections were then washed, dehydrated and mounted. Apoptotic cells were identified by a blue stain over the nuclei
Statistical analysis
Data are expressed in mean ± standard error of the mean (SEM) and are calculated from quantified data obtained from at least three replicative experimental conditions. Statistical analyses were performed using the one-way analysis of variance (ANOVA) followed by post Tukey’s multiple comparison test using graph pad prism (GraphPad Software, Inc., La Jolla, CA). The differences are statistically significant when p <0.01 and <0.05.
Results
Body weight change
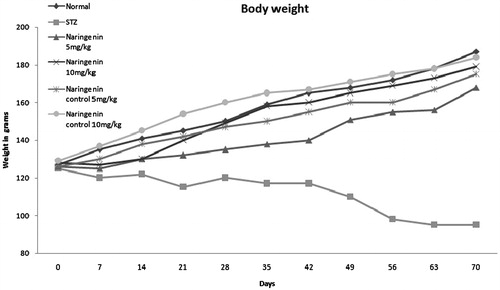
The changes in body weights of diabetic control and naringenin-treated groups during the experimental tenure are shown in . After 21 d of streptozotocin challenge, naringenin-treated groups (groups III and IV) increased their body weight as compared with diabetic control. The result also suggested that naringenin-treated group (group IV) shows better efficacy on maintaining body weights in comparison with group III. Furthermore, gradual increase in body weights of naringenin alone-treated groups (groups V and VI) was similar to normal control rats.
Figure 1. The body weight changes of different groups of rats during the experimental period are shown. The untreated diabetic rats lost weight compared with control groups. Administration of naringenin to diabetic (groups III and IV) rats resulted in an increase in body weight compared to diabetic rats (group II).
Serum blood glucose
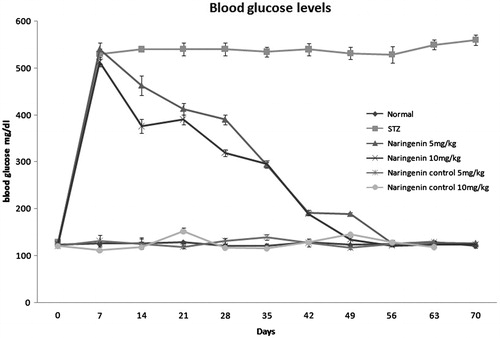
The blood glucose changes of all the groups during the course of the experiment are depicted in . After administration of STZ, a significant increase in blood glucose level was observed in all groups except normal (group I). During the course of treatment, blood glucose level decreased much rapidly in diabetic-treated group (groups III and IV) compared with the non-treated diabetic group (group II). Animals in the groups treated with naringenin alone (groups V and VI) showed the blood glucose level similar to normal.
Figure 2. The blood glucose levels of all the experiment groups during the 70 d study are shown. Administration of STZ to the groups except normal and naringenin control shows an increase in the blood glucose level but administration of naringenin high- and low-doses normalize the glucose levels.
Biochemical parameters
Serum total cholesterol, triglyceride, LDL, VLDL, creatinine, albumin and urea levels were significantly increased in diabetic rats compared with diabetic-treated rats and are represented in . Administration of 5 and 10 mg/kg of naringenin decreased the serum level towards normal (p <0.05) compared with diabetic control. Furthermore a statistical difference was also observed between naringenin 5 and 10 mg/kg treated groups (p <0.01). Streptozotocin administration resulted a reduction in HDL-cholesterol of diabetic rats compared with normal control (p <0.05). The level of HDL-cholesterol was increased in naringenin 5 mg/kg (43.60 ± 1.35) and 10 mg/kg (39.40 ± 1.29) treated groups compared with the STZ control group (13.90 ± 1.21).
Table 1. Serum biochemical parameters.
Antioxidant enzyme activity and lipid peroxidation
The activities of SOD, catalase, reduced glutathione and TBARS concentrations in the renal tissue are represented in . In the renal tissue of STZ-induced diabetic rats, SOD, catalase and glutathione were significantly decreased compared with the control rats, while naringenin-administered diabetic rats (5 and 10 mg/kg) appeared to increase the activities of SOD, catalase and glutathione significantly (p <0.05). A significant difference was observed in between groups III (5 mg/kg) and IV (10 mg/kg) rats (p <0.01).
Table 2. The effect of naringenin on TBARS, SOD, GSH and catalase levels in the rat renal tissue after STZ induced diabetes.
Lipid peroxidation (TBARS) in the diabetic rats was significantly elevated as compared with normal control rats. Administration of naringenin to groups III and IV rats for 10 weeks decreased the TBARS levels significantly (p <0.05). A significant difference in between groups III and IV (5 and 10 mg/kg) rats (p <0.01) was observed.
Histopathological changes
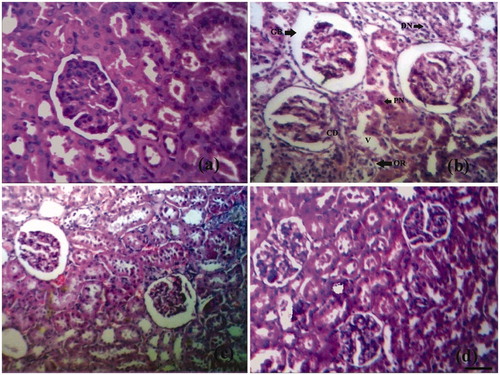
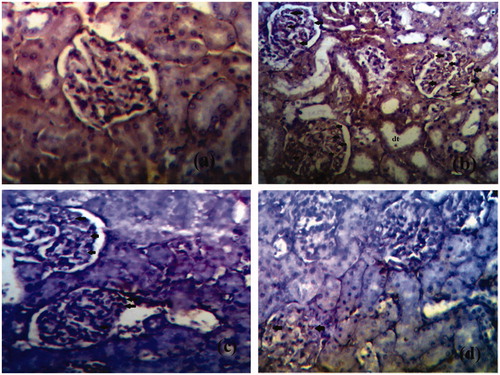
The photomicrographs of histopathological section of control, diabetic and treated rat’s kidney are depicted in . The section of renal tissue of control rats demonstrating the normal architecture with normal glomeruli and tubules is represented in . portrays STZ-induced diabetic kidney section with altered architecture. Distinctive changes were observed in diabetic rat kidneys like occasional ruptures and appearance of cytoplasmic debris and desquamated nuclei in the widened lumens of the tubules. In addition, vacuolisation, picnotic nuclei and oedema in the cells of tubules and hyalinisation of arterioles with thickened basement membranes of proximal and distal convoluted tubules were noted (). Treatment of diabetic rats with naringenin (5 and 10 mg/kg) somehow corrects the changes which were observed in diabetic rats such as occasional ruptures, picnotic nucleus, cytoplasmic debris, vacuolisation and thickened basement membranes (). demonstrates the renal tissues of the diabetic group of rats treated with naringenin presenting a normal glomerular, renal tubule and interstitial tissue appearance. Naringenin control rats (groups V and VI) showed no sign of architectural changes in kidney tissue sections (figure not shown).
Figure 3. Histological appearance of kidney tissue in different groups. (a) Normal histological appearance of kidney tissues of control rat. (b) Histological appearance of kidney tissues of a diabetic rat. The section shows thickening of glomerular basement membrane (GB), occasional ruptures (OR), cytoplasmic debris (CD), desquamated nuclei (DN), vacuolization (V), and picnotic nuclei (P). (c) Histological appearance of kidney tissues of naringenin (5 mg/kg) treated diabetic rat. (d) Histological appearance of kidney tissues of naringenin (10 mg/kg) treated diabetic rat (H&E × 100; scale bars = 50 μm).
Expression of TGF-β1
The expression of kidney tissues was examined immunohistochemically (). There was no expression of these cytokines in the normal rats (). Conversely, an escalated level of TGF-β1 was observed in the glomerulus and tubulointerstitium of kidneys of STZ-treated diabetic animals (25.8 ± 2.59) ( ). In contrast, naringenin 5 mg/kg treated kidney section (group III) significantly decreased the immunopositivity cells (18.9 ± 3.4) () as compared with STZ-treated animals (). A highly significant reduction of the immunopositivity of the cytokines expression in naringenin 10 mg/kg (group VI) kidney sections was observed (10.2 ± 2.1) () compared with diabetic control animals (). Therefore, it was observed that naringenin (10 mg/kg) showed extraordinary restoration of the renal tissue damage by inhibiting the expression of TGF-β1.
Figure 4. The expression of TGF-β1 in the glomeruli of kidney tiisue of different groups is represented. (a) Expression of TGF-β1 in glomeruli of control rat kidney. (b) Expression of TGF-β1 in diabetic rat kidney. (c) Expression of TGF-β1 in naringenin (5 mg/kg) treated diabetic rat kidney. (d) Expression of TGF-β1 in naringenin (10 mg/kg) treated diabetic rat kidney. Arrow represents the expression of TGF-β1 in glomeruli of kidney (H&E × 100; scale bars = 50 μm).
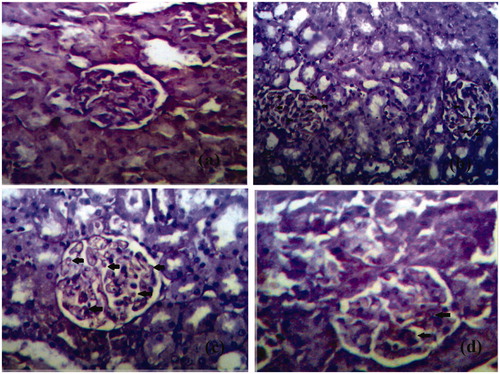
Table 3. TGF-β1 and IL-1 Immunopositive cells in kidney tissues.
Expression of IL-1
The representative photomicrographs of immunohistochemical staining of IL-1β in renal tissues are depicted in and the expression of IL-1β immunopositive cells of various groups of experimental rats is shown in . The renal tissue sections of normal control showed complete absence of immunostaining of IL-1β (). Positive staining of this pro-inflammatory cytokine was observed in the STZ-treated diabetic renal tissue (21.7 ± 1.9) ( ). In contrast, the decrement of IL-1β immunopositivity was observed (15.68 ± 4.3; p <0.05) upon naringenin (5 mg/kg) treatment compared with STZ control (). A more decrement of IL-1β immunopositivity was observed (9.85 ± 2.1; ; p <0.05) in naringenin (10 mg/kg) treated rats compared with STZ control (). A significant difference was observed between naringenin 5 mg/kg (group III) compared with naringenin 10 mg/kg (group IV; p <0.01).
Figure 5. The expression of IL-1 in the glomeruli of kidney tissues of different groups is represented. (a) Expression of IL-1 in glomeruli of control rat kidney. (b) Expression of IL-1 in diabetic rat kidney. (c) Expression of Il-1 in naringenin (5 mg/kg) treated diabetic rat kidney. (d) Expression of IL-1 in naringenin (10 mg/kg) treated diabetic rat kidney. Arrow represents the expression of IL-1 in glomeruli of kidney. Arrows indicate the immunopositive cells. dt, distal tubule (H&E × 100; scale bars = 50 μm).
Apoptosis by TUNEL assay
The chemopreventive action of naringenin on diabetic nephropathy was further analysed by examining its effect on apoptosis of diabetic and treated kidney sections (and ). Only a few TUNEL positive cells were observed within the glomeruli of non-diabetic rats (). In kidneys of diabetic rats, TUNEL staining revealed a significant degree of apoptosis in proximal tubules, distal tubules and interstitial cells (). Treatment with naringenin (5 mg/kg) reduced the number of TUNEL positive apoptotic cells () but naringenin (10 mg/kg) gave a better decline in the number of TUNEL positive apoptotic cells ().
Figure 6. Immunohistochemistry pictures of apoptotic cells in kidney tissue of different groups. Brown stained cells are undergoing apoptosis. Arrowheads represent the expression of TUNEL positive apoptotic cells. (a) Represents normal control. (b) Represents diabetic control. (c) Represents naringenin (5 mg/kg) treated rat. (d) Represents naringenin (10 mg/kg) treated rat. (H&E × 200; scale bars = 50 μm).
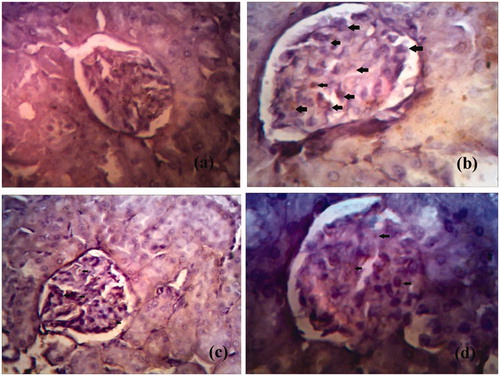
Table 4. Apoptotic value of kidney tissue sections.
Discussion
The present study demonstrated that diabetes caused renal dysfunction and naringenin administration improved these functional abnormalities by providing protection to the renal glomerulus in hyperglycaemic conditions. The pathophysiological alterations and deteriorated renal functions established by chronic hyperglycaemia-mediated oxidative stress in the experimental rats are closely similar to that of human diabetic nephropathy. Further, streptozotocin-induced experimental diabetes is exemplified by moderate and stable hyperglycaemia, glucose intolerance and significantly altered glucose-stimulated insulin secretion that contributes to a number of features comparable with human diabetes (Masiello et al. Citation1998).
The study revealed that the expression of TGF-β1 and IL-1 significantly increased along with an increment in the number of TUNEL apoptotic positive cells in the glomerulus of the diabetic rat kidney. Diabetic rat also showed a significant increase in lipid peroxidation and decrease in SOD, GSH and catalase antioxidant activity. All these changes were ameliorated by the administration of naringenin.
STZ-induced diabetes is characterised by severe loss in body weight, and this was also reflected in the present study. The decrease in body weight observed in uncontrolled diabetes might be the result of protein wasting due to unavailability of carbohydrate for utilisation as an energy source (Rauscher et al. Citation2001). Naringenin administered orally to diabetic rats showed a modest increase in the average body weights compared with the untreated diabetic rats. Diabetic rats exhibited increased blood glucose levels and administration of naringenin to diabetic rats reduced blood glucose levels to normal. These effects may be attributed to insulin-like actions of naringenin including stimulation of glucose uptake and regulation of metabolic processes such as glycolysis, gluconeogenesis and fatty acid synthesis. The mechanism by which naringenin is capable of insulin mimetic activity is not clear (Goldwasser et al. Citation2010). The severity of diabetes is directly proportional to hypercholesterolemia (Ravi et al. Citation2004). In the present study, we have observed higher levels of serum cholesterol levels in diabetic rats. Administration of naringenin to diabetic rats (groups III and IV) normalises cholesterol levels significantly.
Diabetic rats had marked elevated levels of triglycerides, but decreased levels of HDL cholesterol (Al-Shamaony et al. Citation1994). Administration of naringenin to the diabetic rats decreased the serum levels of triglycerides and increased the HDL cholesterol levels. The ability of naringenin, and its glucuronide metabolites, to reduce total plasma cholesterol levels has been demonstrated in vivo while its ability to reduce ApoB secretion has been demonstrated extensively in vitro (Shulman et al. Citation2011). The elevated creatinine, urea and albumin levels in the diabetic group of rats indicate the development of renal hypertrophy, glomerular injury and renal dysfunction (Palsamy & Subramanian Citation2011). Oral administration of naringenin to these groups normalised these altered levels into near normalcy, suggesting that naringenin effectively ameliorates diabetic renal injury in addition to attenuating oxidative stress as well as limiting the apoptotic events.
There is coercing evidence that the surplus level of superoxide generated by diabetic hyperglycaemia plays a vital role in diabetic kidney damage. The total amassing of superoxide anion is determined by a balance between superoxide anion production and antioxidant competence. Elevated glucose flux enhances the generation of superoxide anion by mitochondrial electron transport chain and the overproduced superoxide anion augments the major pathways such as protein kinase C, AGE products and hexosamine pathways (Evans et al. Citation2002). Thus free radicals are implicated in the cell destruction and progression of kidney tubular damage and the results of the present investigation speculate that these free radicals could be significant in the pathogenesis of renal tissue damage at the later stages of experimental diabetes mellitus. However, oral treatment of naringenin efficiently scavenges these free radicals, thereby protecting the kidney tissue from free radical-mediated damage.
Lipid peroxides, hydroperoxides and protein carbonyls are the secondary products of oxidative stress and are unleashed as a result of the toxic effect of reactive oxygen species produced during lipid peroxidation in diabetes. Lipid peroxidation may also play a crucial role in diabetic glomerulosclerosis. The initial hyperfiltering phase of diabetic kidney disease, heralded by the presence of microalbuminuria, is followed by gross proteinuria, progressive diminution in glomerular filtration rate and excessive amassing of extracellular matrix proteins in the glomerular capillaries and mesangium. The latter process leads the way to eventual glomerulosclerosis and renal failure (Salahudeen et al.). This normalisation may be accomplished by the antioxidant and free-radical quenching nature of naringenin, because naringenin is reported to protect the cells from peroxidative stress and lipid peroxidation as well as oxidised lipoprotein-mediated cell death (Allister et al. Citation2005a,Citationb).
Glucotoxicity possibly related to the vulnerability of renal tissues to oxidative stress, because both the functional activities and expression levels of antioxidant enzymes such as SOD, catalase, glutathione peroxidase (GPx) and GSH, are forced to overcome the susceptibility rates. SOD, a chief antioxidant enzyme for the removal of superoxide anion, dismutates superoxide into hydrogen peroxide and molecular oxygen. The hydrogen peroxide is further detoxified to water by catalase or GPx. In addition, GPx is involved in diminution of highly cytotoxic products such as lipid peroxides and other organic hydroperoxides. GSH is an essential substrate for the activity of GPx that oxidises the GSH into oxidised glutathione. However, oral treatment of naringenin significantly improved the activities of enzymatic antioxidants. In this context, various studies have reported the antioxidant activity of naringenin (Jung et al. Citation2003; Renugadevi & Prabu Citation2009).
The renal tissue defensive nature of naringenin in control and experimental groups of rats was ascertained by histological studies. The diabetogenic potential of streptozotocin is accountable for a progressive development of the renal tissue lesions (Obineche et al. Citation2001). The major morphological abnormalities observed in the diabetic kidney were tubular cell swelling, cellular vacuolisation, pyknotic nuclei, medullary congestion, severe lesions and necrosis in a large number of proximal tubular cells, hemorrhagic and hyaline cast deposits, apical blebbing, glomerulus hypertrophy, expanded and congested glomerular capillaries, lysis in tubular epithelial cells and irregular tubular lumens, with reference to control rats (Palsamy & Subramanian Citation2011).
However, administration of naringenin to diabetic rats ameliorated all those structural alterations in the kidney tissues confirming its protective nature during diabetes. There are no such studies available on the protective nature of naringenin on the kidney tissue during experimental diabetes. Hence, this investigation should be considered an innovative assessment of the renal tissue protective nature of naringenin in rats insulted by streptozotocin.
TGF-β1 induces oxidative stress in vitro in the kidney of both normal and diabetic rats and this oxidative stress is abrogated by the antibody to TGF-β1 (Parinandi et al. Citation1990). TGF-β1 has been shown to decrease catalase and glutathione peroxidase activities in pancreatic beta cells and vascular smooth muscle cells (Reddi & Bollineni 1990). Neutralising anti-TGF-β1 antibodies in vivo suppressed diabetes-related kidney growth (Nishio & Watanabe Citation1997). Expression of TGF-β1 gradually increases with the progression of diabetes. These findings are in agreement with a recent study which showed that positive staining for TGF-β1 mainly occurred within the glomeruli, especially the mesangial area, while being weak in the tubules. This increase in positive staining for TGF-β1 was observed in the diabetic rat kidneys. In contrast, naringenin treatment dramatically reduced the expression of TGF-β1 protein in the glomeruli compared with diabetic rats.
The expression of IL-1 increases in diabetic nephropathy which is related to subsequent expression of chemotactic factors and adhesion molecules (Sassy-Prigent et al. Citation2000). IL-1 increases vascular endothelial permeability and it has been involved in the proliferation of mesangial cells and matrix synthesis (Navarro et al. Citation2006). Our study revealed that administration of naringenin to diabetic rats corrects these abnormalities. Naringenin (10 mg/kg) showed a significant decrease in the expression of IL-1 in glomerulus renal tissue.
During diabetic milieu, supraphysiological glucose is involved in the formation of AGEs and the mitochondrial production of free radicals and consequently to cell death and renal dysfunction (Forbes et al. Citation2008). Apoptosis is an ongoing process in many experimental kidney diseases (Sharma et al. Citation1996; Schelling & Cleveland Citation1999). Increased levels of reactive oxygen species (ROS) by hyperglycaemia can induce apoptosis of renal cells and diabetic nephropathy. Insufficient cytoprotection and limited ROS scavenging molecules lead to considerable cellular damage and to a point of no return in apoptosis (Wagener et al. Citation2009). In rats with renal ischaemia/reperfusion injury, pre-treatment with the anti-apoptotic agent IGF-1 or ZVAD-fmk (a caspase inactivator) prevent the onset of tubular cell apoptosis and reduced reperfusion-induced inflammation, associated with improved renal function (Sugiyama et al. Citation1996). Our study revealed that STZ-induced diabetic rats showed an increase in the number of TUNEL positive cells than the normal. Administration of naringenin significantly decreased the number of TUNEL positive cells, indicating the protective effect of naringenin in renal tissue.
Thus, the present study divulges the renoprotective nature of naringenin in streptozotocin-induced diabetic rats and provides evidence that the protective effects are, possibly, due to the decline in oxidant, proinflammatory cytokine production and apoptotic events in the renal tissues. Moreover, naringenin treatment to streptozotocin-induced diabetic rats exhibited a significant ameliorative potential probably by attenuating the hyperglycaemia-mediated oxidative stress, thereby alleviating the structural alterations such as glomerulosclerosis, glomerular basement membrane thickening and changes in the proximal and convoluted tubules. Further detailed studies are in progress in our laboratory to explicate the precise mechanism by which naringenin reduces its renoprotective potentials.
Acknowledgements
The authors would like to thank Mr. Jayanta Bhowmick for his assistance in preparing and evaluating histopathological slides, highly acknowledge Mr. Subhash Kumar Manna for technical support and Mr. Lal Mohan Masanta for providing laboratory support.
Declaration of interest
The authors declare that there is no conflict of interest.
References
- Allister EM, Borradaile NM, Edwards JY, Huff MW et al. 2005a. Inhibition of microsomal triglyceride transfer protein expression and apolipoprotein B100 secretion by the citrus flavonoid naringenin and by insulin involves activation of the mitogen-activated protein kinase pathway in hepatocytes. Diabetes 54:1676–1683.
- Allister EM, Borradaile NM, Edwards JY, et al. 2005b. Inhibition of microsomal triglyceride transfer protein expression and apolipoprotein B100 secretion by the Citrus flavonoid naringenin and by insulin involves activation of the mitogen-activated protein kinase pathway in hepatocytes. J Lipid Res. 49:2218–2229.
- Al-Shamaony L, Al-Khazaraji SM, Twaiji IA. 1994. Hypoglycaemic effect of Artemisia herba alba. II. Effect of a valuable extract on some blood parameters in diabetic animals. J Ethnopharmacol. 43:167–171.
- Andrade L, Vieira JM, Safirstein R. 2000. How cells die counts. AM J Kidney Dis. 36:662–668.
- Ayodele OE, Alebiosu CO, Salako BL. 2004. Diabetic nephropathy – a review of the natural history, burden, risk factors and treatment. J Natl Med Assoc. 96:1445–1454.
- Baynes JW. 1991. Role of oxidative stress in development of complications in diabetes. Diabetes 40:405–412.
- Bonnefont D. 2002. Glucose and reactive oxygen species. Curr Opin Clin Nutr Metab Care 5:561–568.
- Buege JA, Aust SD. 1984. Microsomal lipid peroxidation. Meth Enzymol. 105:302–310.
- Cochrane SM, Robinson GB. 1995. In vitro glycation of glomerular basement membrane alters its permeability: a possible mechanism in diabetic complications. FEBS Lett. 375:41–44.
- Erin EM, Assini JM, Sutherland BG, et al. 2011. Naringenin decreases progression of atherosclerosis by improving dyslipidemia in high-fat-fed low-density lipoprotein receptor-null mice. Arterioscler Thromb Vasc Biol. 30:742–748.
- Evans JL, Goldfine ID, Maddux BA, et al. 2002. Oxidative stress and stress activated signaling pathways: a unifying hypothesis of type 2 diabetes. Endocr Rev. 23:599–622.
- Forbes JM, Coughlan MT, Cooper ME. 2008. Oxidative stress as a major culprit in kidney disease in diabetes. Diabetes 57:1446–1454.
- Goldfarb S, Ziyadeh FN. 2001. TGF-beta: a crucial component of the pathogenesis of diabetic nephropathy. Trans Am Clin Climatol Assoc. 112:27–33.
- Goldwasser J, Cohen PY, Lin W, Kitsberg D, et al. 2011. Naringenin inhibits the assembly and long-term production of infectious hepatitis C virus particles through a PPAR-mediated mechanism. J Hepatol. 55:963–971.
- Goldwasser J, Cohen PY, Yang E, et al. 2010. Transcriptional regulation of human and rat hepatic lipid metabolism by the grapefruit flavonoid naringenin: role of PPARalpha, PPARgamma and LXRalpha. PLoS One 5:e12399.
- Hertog MGL, Hollman PCH, Van De Putte B. 1993. Content of potentially anticarcinogenic flavonoids of tea infusions, wines and fruit juices. J Agric Food Chem. 41:1242–1246.
- Jin R, Chow VT, Tan PH, et al. 2002. Metallothionein 2A expression is associated with cell proliferation in breast cancer. Carcinogenesis 23:81–86.
- Johansson LH, Hakan Borg LA. 1988. A spectrophotometric method for determination of catalase activity in small tissue samples. Anal Biochem. 174:331–336.
- Jung DS, Lee SH, Kwak SH, et al. 2012. Apoptosis occurs differentially according to glomerular size in diabetic kidney disease. Nephrol Dial Transplant. 27:259–266.
- Jung UJ, Kim HJ, Lee JS, et al. 2003. Naringin supplementation lowers plasma lipids and enhances erythrocyte antioxidant enzyme activities in hypercholesterolemic subjects. Clin Nutr. 22:561–568.
- Kerr JF, Gobe GC, Winterford CM, et al. 1995. Anatomical methods in cell death. Methods Cell Biol. 46:1–27.
- Kim SY, Kim HJ, Lee MK, et al. 2006. Naringin time dependently lowers hepatic cholesterol biosynthesis and plasma cholesterol in rats fed high-fat and high-cholesterol diet. J Med Food. 9:582–586.
- Klein R. 1995. Hyperglycemia and microvascular and macrovascular disease in diabetes. Diabetes Care 18:258–268.
- Kurowska E, Borradaile N, Spence JD, et al. 2000. Hypocholesterolemic effects of dietary citrus juices in rabbits. Nutr Res. 20:121–129.
- Kurowska EM, Manthey JA, Casaschi A, et al. 2004. Modulation of HepG2 Cell net apolipoprotein B secretion by the Citrus polymethoxyflavone, tangeretin. Lipids 39:143–115.
- Masiello P, Broca C, Gross R, et al. 1998. Experimental NIDDM: development of a new model in adult rats administered streptozotocin and nicotinamide. Diabetes 47:224–229.
- Mclennan SV, Hefernan S, Wright L. 1991. Changes in hepatic glutathione metabolism in diabetes. Diabetes 40:344–348.
- Mullarkey CJ, Edelstein D, Brownlee L. 1990. Free radical generation by early glycation products: a mechanism for accelerated atherogenesis in diabetes. Biochem Biophys Res Commun. 173:932–939.
- Nagata S. 1997. Apoptosis by death factor. Cell 88:355–365.
- Navarro JF, Milena FJ, Mora C, et al. 2006. Renal pro-inflammatory cytokine gene expression in diabetic nephropathy: effect of angiotensin-converting enzyme inhibition and pentoxifylline administration. Am J Nephrol. 26:562–570.
- Nishio E, Watanabe Y. 1997. Transforming growth factor beta is a modulator of platelet-derived growth factor action in vascular smooth muscle cells: a possible role for catalase activity and glutathione peroxidase activity. Biochem Biophys Res Commun. 232:1–4.
- Obineche EN, Mensah-Brown E, Chandranath SI, et al. 2001. Morphological changes in the rat kidney following long-term diabetes. Arch Physiol Biochem. 109:241–245.
- Pagila DE, Valentine WN. 1967. Studies on the quantitative and qualitative characterization of erythrocyte glutathione peroxidase. J Lab Clin Med. 70:158–169.
- Palsamy P, Subramanian S. 2011. Resveratrol protects diabetic kidney by attenuating hyperglycemia-mediated oxidative stress and renal inflammatory cytokines via Nrf2-Keap1 signaling. Biochim Biophys Acta 1812:719–731.
- Parinandi NL, Thompson EW, Schmid HHO. 1990. Diabetic heart and kidney exhibit increased resistance to lipid peroxidation. Biochim Biophys Acta. 1047:63–69.
- Ramachandran A, Snehalata C. 2009. Current scenario of diabetes in India. J Diabetes 1:18–28.
- Rauscher FM, Ruth A, Watkins JB. 2001. Effects of isoeugenol on oxidative stress pathways in normal and streptozotocin induced diabetic rats. J Biochem Mol Toxicol. 15:159–164.
- Ravi K, Ramachandran B, Subramanian S. 2004. Protective effect of Eugenia jambolana seed kernel on tissue antioxidants in streptozotocin-induced diabetic rats. Biol Pharm Bull. 27:1212–1217.
- Reddi AS, Bollineni JS. 1997. Renal cortical expression of mRNAs for antioxidant enzymes in normal and diabetic rats. Biochem Biophys Res Commun. 235:598–601.
- Reddi AS, Davalos RA. 1990. Diabetic nephropathy. An update. Arch Intern Med. 150:31–43.
- Remuzzi G, Schieppati A, Ruggenenti P. 2002. Clinical practice. Nephropathy in patients with type 2 diabetes. N Engl J Med. 346:1145–1151.
- Renugadevi J, Prabu SM. 2009. Naringenin protects against cadmium-induced oxidative renal dysfunction in rats. Toxicology 256:128–134.
- Roy S, Rahaman N, Ahmed F, et al. 2013. Naringenin attenuates testicular damage, germ cell death and oxidative stress in streptozotocin induced diabetic rats. J Appl Biomed. 11:195–208.
- Salahudeen AK, Kanji V, Reckelhoff JF, Schimdt JM. 1997. Pathogenesis of diabetic nephropathy: a radical approach. Nephrol Dial Transplant 12:664–668.
- Sassy-Prigent C, Heudes D, Jouquey S, et al. 2000. Early glomerular macrophage recruitment in streptozotocin-induced diabetic rats. Diabetes 49:466–475.
- Schelling JR, Cleveland RP. 1999. Involvement of Fas-dependent apoptosis in renal tubular epithelial cell deletion in chronic renal failure. Kidney Int. 56:1313–1316.
- Sharma K, Jin Y, Guo J, et al. 1996. Neutralization of TGF beta by anti TGF beta antibody attenuates kidney hypertrophy and the enhanced extracellular matrix gene expression in STZ induced diabetic mice. Diabetes 45:522–530.
- Shulman M, Cohen M, Soto-Gutierrez A, et al. 2011. Enhancement of naringenin bioavailability by complexation with hydroxypropoyl-β-cyclodextrin. PLoS One 6:e18033.
- Strain JJ. 1991. Disturbances of micronutrient and antioxidant status in diabetes. Proc Nutr Soc. 50:591–604.
- Sugiyama H, Kashihara N, Makino H, et al. 1996. Apoptosis in glomerular sclerosis. Kidney Int. 49:103–111.
- Wagener D, Dekker JH, Berden A, et al. 2009. The role of reactive oxygen species in apoptosis of the diabetic kidney. Diab Apop 14:1451–1458.
- Wild S, Roglic G, Green A, et al. 2004. Global prevalence of diabetes: estimates for the year 2000 and projections for 2030. Diabetes Care 27:1047–1053.
- Yamagishi S, Imaizumi T. 2005. Diabetic vascular complications: pathophysiology, biochemical basis and potential therapeutic strategy. Curr Pharm Des. 11:2279–2299.
- Ziyadeh FN, Hoffman BB, Han DC, et al. 2000. Long-term prevention of renal insufficiency, excess matrix gene expression, and glomerular mesangial matrix expansion by treatment with monoclonal antitransforming growth factor-beta antibody in db/db diabetic mice. Proc Natl Acad Sci USA 97:8015–8020.