
Abstract
Context The β-carboline alkaloid harmane is widely distributed in common foods, beverages and hallucinogenic plants. Harmane exerts potential in therapies for Alzheimer’s and depression diseases. However, little information on its dynamic metabolic profiles and pharmacokinetics in vivo is currently available.
Objective This study investigates the dynamic metabolic profiles and pharmacokinetic properties of harmane and its metabolites in rats in vivo.
Materials and methods A highly selective, sensitive and rapid ultra-performance liquid chromatography combined with electrospray ionization tandem mass spectrometry (UPLC-ESI-MS/MS) method was developed and well-validated for simultaneous quantitative determination of harmane and its uncertain endogenous metabolite harmine, as well as for semiquantitative determination of 10 harmane metabolites in rats after intravenous injection and oral administration of harmane at 1.0 and 30.0 mg/kg, respectively.
Results The calibration curves of harmane and harmine showed excellent linearity within the concentration range of 1–2000 ng/mL with acceptable accuracy, precision, selectivity, recovery, matrix effect and stability. Ten metabolites, including harmane but not harmine, were detected and identified after intravenous and oral administration of harmane. The absolute bioavailability of harmane following an oral dose was 19.41 ± 3.97%. According to the AUC0–t values of all the metabolites, the metabolic levels of phase II metabolites were higher than those of phase I metabolites, and the sulphation pathways were the dominant metabolic routes for harmane in both routes of administration.
Discussion and conclusion The pharmacokinetic properties of harmane and its 10 metabolites in rats were determined. Sulphate conjugation was the predominant metabolic process of harmane in rats.
Introduction
Harmane (1-methyl-9H-pyrido-[3,4-b]-indole), a tremor-producing β-carboline alkaloid (Louis et al. Citation2007), is naturally present in hallucinogenic plants, such as Peganum harmala Linn (Zygophyllaceae), Banisteriopsis caapi (Spruce ex Grisb.) Morton (Malpighiaceae), and Tribulus terrestris Linn (Zygophyllaceae). Harmane and harmine also exist in various human diets and foodstuff in particularly high ng/g concentrations, such as in espresso coffee brews, alcoholic beverages and cigarette smoke (Anderson et al. Citation2006; Alves et al. Citation2007). Moreover, harmane and harmine endogenously occur in mammalian tissues and body fluids, including the central nervous system (CNS), heart, kidney, liver, brain, adrenal tissue, platelets, plasma and urine (Yu et al. Citation2003). Harmane is highly lipophilic and more easily distributed into brain tissues than peripheral tissues. The harmane concentration in the brain is 55 times higher than that in plasma (Spijkerman et al. Citation2002). Furthermore, high plasma levels of harmane are found in heavy smokers (Spijkerman et al. Citation2002), alcoholics (Rommelspacher et al. Citation1991), heroin addicts (Stohler et al. Citation1995) and patients with essential tremor (Louis et al. Citation2008) or Parkinson’s disease (Kuhn et al. Citation1995); thus, harmane is assumed to play a crucial role in the pathophysiology of various CNS disorders. Consequently, harmane provides particularly high interest in human epidemiological studies.
Harmane demonstrates a wide variety of potential pharmacological activities; hence, many related studies have focused on the pharmacological effects of harmane because of its structure (chemical structure is shown in ), which is elucidated by ultraviolet and infrared spectrophotometry. This alkaloid is also prepared by reacting tryptophan and acetaldehyde under oxidative conditions (Poindexter & Carpenter Citation1962). Structurally, the β-carboline alkaloid is a heterocyclic amine comprising a combination of five- and six-ringed carbon structures, containing an amine group. Harmane exhibits considerable structural similarity to 1-methyl-4-phenyl-1,2,3,6-tetrahydropyridine, which was used to produce one of the main toxin-induced animal models for Parkinson’s disease (Serra et al. Citation2008). Therefore, harmane has been implicated in a wide spectrum of pharmacological actions of human diseases, including depression and Alzheimer’s diseases, psychosis, tremor, addiction and cancer (Piletz et al. Citation2000; Pfau & Skog Citation2004). This alkaloid has also been shown to act on various receptor systems in the brain (Zetler et al. Citation1972), such as serotonin, opiate, dopamine, imidazoline and benzodiazepines (Squires et al. Citation2004; Nasehi et al. Citation2010). Harmane is a potent inhibitor of monoamine oxidase, particularly subtype A (Anderson et al. Citation2003; Arib et al. Citation2010). Furthermore, harmane exerts strong inhibition against acetylcholinesterase and butyrylcholinesterase (Zhao et al. Citation2013). Therefore, harmane displays a large development potential in the pathophysiology therapy of various CNS disorders, including Alzheimer’s and depression diseases (Ostergren et al. Citation2004; Louis et al. Citation2005).
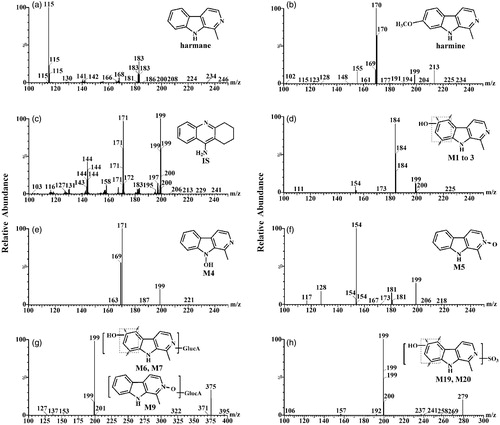
Figure 1. Chemical structures and product ion spectra of harmane (a); harmine (b); IS (c); M1–M3 (d); M4 (e); M5 (f); M6, M7 and M9 (g); M19 and M20 (h).
In previous studies on harmane metabolism in vitro and in vivo, 21 metabolites (M1–M21) were identified from rat liver microsomes and rat liver S9 (9), rat urine (11), feces (16), bile (16) and plasma (10) after a single oral administration of harmane by using Metabolynx™ and MassFragment™ software tools (Li et al. Citation2014). The metabolic transformation pathways of harmane include monohydroxylation, dihydroxylation, N-oxidation and O-glucuronide, O-sulphate and glutathione conjugations. Additionally, the major excretion routes for harmane and its metabolites are biliary and faecal clearance (Li et al. Citation2014). Another study reported the absolute oral bioavailability of harmane to be only 19.1% with a short half-life of 29.21 min (Guan et al. Citation2001). This result indicated that the metabolites might be related to the pharmacological activities of harmane. Furthermore, harmane can be metabolized to harmine () in rats after a single oral dose of 20 mg/kg (Guan et al. Citation2001). However, harmine and related metabolites were not found in the metabolic pathways of harmane in our previous report (Li et al. Citation2014). To elucidate the dynamic metabolic profiles of harmane in vivo, further research will be required on the pharmacokinetics of harmane and its main metabolites.
In the present study, a rapid, selective and sensitive UPLC-ESI-MS/MS analytical method was developed for quick and simultaneous quantitative and semiquantitative determinations of harmane and its 10 metabolites (M1–M7, M9, M19 and M20); the uniform names are the same as in the previous report (Li et al. Citation2014), and an uncertain endogenous metabolite harmine in rat plasma with tacrine was used as the internal standard (IS) for single run time of approximately 5.0 min (chemical structures are shown in ). The method was well-validated with multiple reaction monitoring (MRM) modes and applied to this in vivo pharmacokinetic study in rats after intravenous injection and oral administration of harmane at 1.0 and 30.0 mg/kg doses, respectively. Considering the not relatively available reference chemical standards for harmane metabolites, an alternative semiquantitative estimation approach was introduced to calculate the concentrations of 10 metabolites in the in vivo pharmacokinetic samples by using the calibration curve of harmane. The approach presented in this study provided an expedient measure for the bioanalytical need of fast semiquantitative estimation and pharmacokinetic research on harmane metabolites.
Materials and methods
Chemicals and materials
Harmane and harmine with purity of >98% were isolated by HPLC from seeds of P. harmala in our laboratory (Yang et al. Citation2015). Tacrine hydrochloride (IS) and heparin sodium were purchased from Sigma Aldrich Co. (St. Louis, MO). Acetonitrile, methanol and formic acid of HPLC grade were purchased from Fisher Scientific Co. (Santa Clara, CA). Deionized water (>18 mΩ) was purified using Milli-Q Academic System (Millipore Corp., Billerica, MA). All other reagents and solvents were of either analytical or HPLC grade.
Animals
Twenty-four pathogen-free Sprague–Dawley adult rats comprising 12 males and 12 females (weighing within the range of 200–250 g) were obtained from Drug Safety Evaluation and Research Center of Shanghai University of Traditional Chinese Medicine. Animals were raised under an environmentally controlled breeding room for 7 d before commencing the experiments. Animals were housed in a well-lighted air-conditioned room (25 ± 1 °C) under standard environmental conditions (12 h light–dark cycles) and given free access to rodent chow and tap water prior to the study. Rats were fasted for 12 h and provided free access to water prior to the experiments. All animal-use procedures were in accordance with the regulations for animal experimentation issued by the State Committee of Science and Technology of the People’s Republic of China on 14 November 1988 and approved by the Animal Ethics Committee of Shanghai University of Traditional Chinese Medicine (No. SUTCM-2011-1107; approval date: 10 November 2011).
UPLC-ESI-MS/MS system and experimental conditions
Chromatographic separation was performed on a Waters-ACQUITYTM UPLC system (Waters Corp., Milford, MA) by using an ACQUITY UPLC BEH C18 column (50 mm × 2.1 mm, 1.7 μm particle size). The gradient mobile phase consisted of an aqueous solution of 0.1% formic acid (solvent A) and acetonitrile (solvent B) at a flow rate of 0.3 mL/min. The gradient elution program was established as follows: 0–2.5 min, 9–13% B; 2.5–2.51 min, 13–14.5% B; 2.51–4.00 min, 14.5–15.5% B; 4.00–4.01 min, 15.5–90% B; 4.01–5.00 min, 90% B; and 5.01–6.00 min, 9% B for equilibration of the column. The injection volume was 5 μL with partial loop in needle overfill mode. The temperatures of the column and autosampler were maintained at 45 °C and 4 °C, respectively.
Mass spectrometric detection was performed using a triple quadrupole mass spectrometer (Waters Corp., Milford, MA) equipped with electrospray ionization in positive ionization mode. Tune parameters were optimized and established as follows: capillary voltage, 3 kV; extractor, 1 V; RF lens, 0.4 V; source temperature, 120 °C; desolvation temperature, 350 °C; desolvation gas flow, 550 L/h; and cone gas flow, 50 L/h. The detection conditions were as follows: span, 0.5 Da; inter-channel delay, 0.02 s; inter-scan delay, 0.2 s; dwell time, 0.05 s; start time, 0.2 min; and end time, 5.0 min. MRM was selected for the quantification of harmine, harmane and its 10 metabolites, and IS. The MS analytical parameters were also optimized (). All the data were acquired in centroid mode and processed using MassLynxTM 4.1 software with QuanLynxTM program (Waters Corp., Milford, MA).
Table 1. The optimized MS analytical parameters of harmane, its 10 metabolites, harmine and IS.
Stock solutions, calibration standards and quality control samples
The standard stock solutions of harmane and harmine with a concentration of 400 μg/mL were prepared by dissolving proper amount of each standard in 10 mL of methanol. An IS working solution (100 ng/mL) was also prepared by dissolving proper amount of tacrine in acetonitrile. The stock solutions of harmane and harmine were serially diluted with the initial mobile phase to obtain seven working solutions containing harmane and harmine with concentrations ranging within 1–2000 ng/mL and IS with a concentration of 50 ng/mL for the standard curves. Quality control (QC) samples were prepared independently in the same procedure at low (1 ng/mL), medium (125 ng/mL) and high levels (2000 ng/mL) for harmane and harmine by using different standard working solutions. Samples for standard curves and QC were prepared with the working solutions, following the single-step protein precipitation procedure before the processing of each analytical batch; these samples were processed together with the biological specimen. All the solutions were stored at 4 °C.
Sample preparation
A convenient and rapid precipitation method was used to prepare the plasma samples. A 100 μL aliquot of plasma sample was added with 50 μL of IS solution and 250 μL of acetonitrile in a 1.5 mL centrifuge tube and then vortex-mixed for 1.0 min; subsequently, the mixture was centrifuged at 15 000 × g for 15 min at 4 °C. Up to 360 μL of supernatant was transferred to another clean tube and evaporated to dry at 37 °C under a slight stream of nitrogen. The dried residue was reconstituted with 90 μL of 9% acetonitrile and vortexed for 1.0 min. After centrifugation at 15 000 × g for 15 min at 4 °C, a 5 μL aliquot of supernatant was injected into the UPLC-ESI-MS/MS system for analysis.
Method validation
Complete validation is significant when developing and implementing a bioanalytical method for the first time. The UPLC-ESI-MS/MS method was fully validated in accordance with the US Food and Drug Administration Bioanalytical Method Validation Guidance, European Medicines Agency Guideline on Bioanalytical Method Validation, and other related guidelines with respect to selectivity, linearity, precision and accuracy, recovery, matrix effect and stability (US Food and Drug Administration Citation2001; Guan et al. Citation2014).
Selectivity
The selectivity was assessed by comparing the MRM chromatograms of blank rat plasma, blank plasma spiked with harmane and harmine at low limit of quantification (LLOQ) and IS, and IS-spiked plasma sample after a single oral administration of harmane at a dose of 30.0 mg/kg.
Linearity, low limit of quantification and low limit of detection (LLOD)
Calibration standard curves were prepared within the range of 1–2000 ng/mL in five replicates on each validation run, and the calibration curves were plotted by the peak area ratio (analyte/IS, y) versus the analyte concentration (x). The LLOQ was defined as the lowest concentration on the calibration curves that produced a signal-to-noise (S/N) ratio of at least 10 with an acceptable accuracy and precision (relative standard deviation, RSD: below 20%). The LLOD was defined as the lowest concentration that produced a peak distinguished from the background noise (a minimum S/N ratio of 3:1) for the analytes.
Precision and accuracy
Precision and accuracy were evaluated by performing replicate analysis of QC samples (n = 5) at three levels. The procedure was repeated on three different days for plasma matrix to determine the interday precision values. The accuracy of the assay was expressed by QC sample recovery at three levels. Proper amounts of harmane and harmine were added into blank plasma and extracted with the single-step protein precipitation procedure. Apparent concentrations of harmane and harmine were calculated by calibration curves. The accuracy, intraday and interday precision should not exceed 15%, and the low QC samples should be within ± 20%.
Extraction recovery and matrix effect
The extraction recoveries of harmane and harmine were determined at three QC levels with five replicates by comparing the mean peak areas from blank plasma samples spiked before extraction with those from blank plasma samples spiked after extraction. The extraction recovery of the IS was determined using the same method. The matrix effect was investigated at three QC concentrations (n = 5) using the peak area ratios of the blank plasma samples spiked after extraction to those of pure standard solutions containing the analytes at the same concentrations.
Stability
The stability of harmane and harmine in rat plasma was assessed by analyzing replicates (n = 5), which were spiked with standards at low, medium and high QC samples during the sample storage and processing procedures. The stability validation of harmane and harmine was investigated under different conditions. Five aliquots of QC samples were stored at −80 °C for 15 d and at ambient temperature for 4 h. The freeze-thaw stability was determined after thawing at room temperature and freezing at −20 °C for three cycles on consecutive days. Postpreparation stability was estimated by analyzing QC samples within 24 h in the autosampler at 4 °C. The calibration curves of freshly prepared standards were used for all stability tests of QC samples. The acceptable precision and accuracy should be within ± 15%, and the low QC samples should not exceed 20%.
Application to pharmacokinetic study
The validated method was applied to the pharmacokinetic study of harmane and its 10 metabolites in rats after single intravenous and intragastric administration of harmane. Twenty-four rats with 12 males and 12 females were randomly divided into three groups of eight rats in each. Harmane was administered to eight rats by gavage at a dose of 30.0 mg/kg, and eight rats were administered via the caudal vein at a dose of 1.0 mg/kg, which was dissolved in physiological saline with germicidal treatment; the eight other rats without any treatment were considered the normal group. Approximately 0.25 mL of blood sample was collected from the angular vein of each conscious rat and transferred into heparinized tubes at 0 (predose), 0.03, 0.08, 0.25, 0.5, 0.75, 1.0, 1.5, 2.0, 4.0, 8.0, 12.0 and 24.0 h after oral administration; at 0 (predose), 0.03, 0.08, 0.17, 0.33, 0.5, 0.75, 1.0, 1.5, 2.0, 4.0, 8.0, 12.0 and 24.0 h after intravenous bolus injection of harmane; and at 0 (predose), 0.03, 0.08, 0.17, 0.25, 0.33, 0.5, 0.75, 1.0, 1.5, 2.0, 4.0, 8.0, 12.0 and 24.0 h for the normal group. Rats had free access to water after 4.0 h of blood sample collection. Serial blood samples were immediately centrifuged at 5000 × g for 15 min, and 100 μL of the supernatant plasma layer was transferred into another new 1.5 mL centrifuge tube and stored at −80 °C until analysis.
All experimental data and pharmacokinetic parameters were expressed as the mean ± SD. The plasma concentrations of harmane and harmine were directly calculated by their calibration curves accordingly. In addition, the plasma concentrations of metabolites were calculated by semiquantification using the calibration curve of harmane because of the unavailable reference substance of these metabolites. The plasma concentration versus time curves were plotted, and all the pharmacokinetic parameters of harmane and its 10 metabolites, such as absorption rate constant (Ka), distribution rate constant (Kd), elimination rate constant (Ke), absorption half-life (T1/2a), distribution half-life (T1/2d), elimination half-life (T1/2e), apparent volume of distribution (Vd), clearance rate (CL) and mean residence time (MRT), were processed using the non-compartmental pharmacokinetic data analysis software program of PK solution 2.0TM (Summit Research Services, Portland, OR). The maximum peak concentration (Cmax) and time of maximum plasma concentration (Tmax) were obtained directly from the observed concentration versus time data. The area-under-the-plasma concentration–time curve from zero to time t (AUC0–t) was obtained by the linear/logarithmic trapezoidal rule, and the area-under-the-plasma concentration–time curve from zero to infinity (AUC0−∞) was calculated by means of the trapezoidal rule with extrapolation to infinity, with a terminal elimination rate constant (Ke). The absolute bioavailability (F) of harmane was calculated by the ratios of dose-normalized AUC0–∞ after oral and intravenous dosing: F = (AUC0−∞,oral × Doseiv)/(AUC0−∞,iv × Doseoral) × 100%. In the present study, dose denotes the dose of administration. The pharmacokinetic parameters (Vd, CL and MRT) of metabolites M1–M7, M9, M19 and M20 were calculated by a method described previously (Wang et al. Citation2011). A statistical analysis was performed using analysis of variance with α = 0.05 as the minimal level of significance.
Results and discussion
Optimization of UPLC-ESI-MS/MS conditions
Mobile phase was optimized to achieve a satisfactory chromatographic behaviour, such as good peak symmetry, high detection sensitivity, short run time and appropriate ionization. Acetonitrile was used as the organic phase because it provided higher responses and lower background noise than methanol. The sensitivity and peak symmetry of harmane and its 10 metabolites, harmine and IS were remarkably improved by adding 0.1% formic acid to the mobile phase. A single chromatographic run can be completed within 6.0 min, which satisfied the requirement for high-throughput assay in bioanalysis.
For selectivity and specificity of the method, MRM was selected for the quantification of the investigated ion pairs (). MS parameters such as capillary, cone and collision voltage, source temperature, desolvation temperature, flow rate of desolvation gas and cone gas were further investigated to obtain the optimal results for quantification, and the other parameters were adopted for the recommended values of the instrument ().
Sample preparation
Sample preparation is an important step for an accurate and reliable UPLC-ESI-MS/MS assay. Single-step protein precipitation was used to prepare the biological samples because of its ability to improve the sensitivity and efficiency of the assays. Increased response, enhanced peak shapes and decreased matrix effects were observed after precipitation pretreatment with acetonitrile; 9% acetonitrile solution was selected as the solvent to reconstitute the residue after nitrogen blow. Overall, the method provided high-extraction recovery efficiency over 85% for harmane, harmine and IS.
Method validation
Selectivity
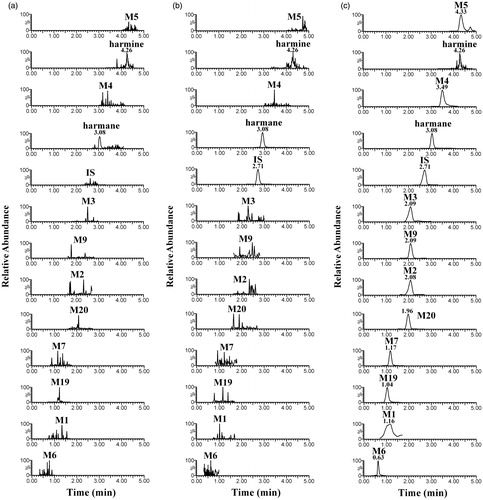
The metabolite detection for harmane and IS by MRM mode was highly selective and without interference from endogenous substances. However, harmane and harmine were naturally present in rat plasma. shows the representative of typical MRM chromatograms of blank plasma, blank plasma spiked with harmane and harmine at LLOQ and IS, and IS-spiked plasma sample collected at 30 min after a single intragastric administration of 30.0 mg/kg harmane. The retention times for harmane, its 10 metabolites (M1–M7, M9, M19 and M20), harmine and IS were 3.08, 1.16, 2.08, 2.09, 3.49, 4.33, 0.63, 1.17, 2.09, 1.04, 2.08, 4.26 and 2.71 min, respectively.
Figure 2. Representative MRM chromatograms of blank rat plasma sample (a); blank plasma spiked with harmane and harmine at LLOQ and IS (b); and plasma sample spiked with IS after oral administration of harmane at a dose of 30.0 mg/kg (c).
Linearity, LLOD and LLOQ
The seven-point calibration curves showed good linearity within the tested range of 1–2000 ng/mL for harmane and harmine in rat plasma. The typical equations of the calibration curves are y = 0.0417x−0.068 (r2 = 0.9984) (harmane) and y = 0.0112x−0.0013 (r2 = 0.9989) (harmine), where y is the peak area ratio of harmane or harmine to IS, and x is the harmane or harmine concentration. The approximate LLOD value of harmane and harmine was 0.20 ng/mL, and their LLOQ value was 1 ng/mL. The sensitivity values have been proven more satisfactory in the analysis of pharmacokinetic study of harmane in rats after intravenous and oral administration.
Precision and accuracy
summarizes the intraday and interday precision and accuracy values of the method at three concentration levels of QC samples (1, 125 and 2000 ng/mL). The precision of harmane and harmine (intraday and interday) at three QC levels was within 15% with accuracies within 100.58–112.37%, and the SD values were within ± 5.67%. The results demonstrated that the method is reliable and accurate, and the above data satisfied the acceptable criteria according to the guideline for bioanalytical methods.
Table 2. Accuracy, precision, extraction recovery, matrix effect, and stability of harmane, harmine and IS in rat plasma (n = 5).
Extraction recovery and matrix effect
also shows the extraction recovery and matrix effect of the analytes in rat plasma. The average extraction recoveries of harmane and harmine at three QC levels ranged within 92.65–118.36% (n = 5) with the SD below 7.53%; the extraction efficiency of IS (50 ng/mL) was 93.16 ± 1.41% (n = 5), which satisfied the requirements of analysis. The matrix effect values for harmane and harmine were also within acceptable limits, which ranged within 100.09–119.77% at three QC levels (n = 5), with the SD not exceeding 8.16%. Moreover, the average matrix effect value of the IS was 94.57 ± 2.15% (n = 5). No significant matrix effect was observed during the determination, which indicated that ion suppression or enhancement from rat plasma is negligible under the present conditions.
Stability
summarizes the results of the stability experiments under various conditions as mentioned above. Harmane and harmine in rat plasma were stable on storage at ambient temperature for 4 h, for 2 weeks under −80 °C, repeated three freeze-thaw cycles, and in processed samples in the autosampler at 4 °C for 24 h. The RSD values of the mean test responses were within 0.36–9.67% in the stability tests of QC samples, thereby demonstrating that these stabilities of plasma samples would satisfy the requirements of a routine pharmacokinetic study.
Pharmacokinetics of harmane and its metabolites after intravenous administration of harmane
The validated analytical method was successfully applied to the in vivo pharmacokinetic study in rats after intravenous injection of harmane at a dose of 1.0 mg/kg. The plasma concentrations of metabolites were also calculated by semiquantification using the calibration curve of harmane because no reference chemical standards were available. and show the mean plasma concentration versus time profiles of harmane and its 10 metabolites (M1–M7, M9, M19 and M20) after administration to rats. The corresponding pharmacokinetic parameters of harmane and its 10 metabolites following intravenous administration in rats, which were calculated using non-compartmental analysis, were presented as mean ± SD ().
Figure 3. Mean plasma concentration–time curves of harmane in rats after intravenous and oral administration at doses of 1.0 and 30.0 mg/kg, respectively.
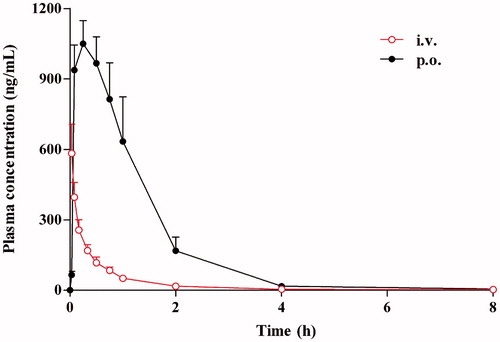
Figure 4. Mean plasma concentration–time curves of phase I metabolites after intravenous administration of harmane at a dose of 1.0 mg/kg (a); phase I metabolites after oral administration of harmane at a dose of 30.0 mg/kg (b); phase II metabolites after intravenous administration of harmane at a dose of 1.0 mg/kg (c); and phase II metabolites after oral administration of harmane at a dose of 30.0 mg/kg (d).
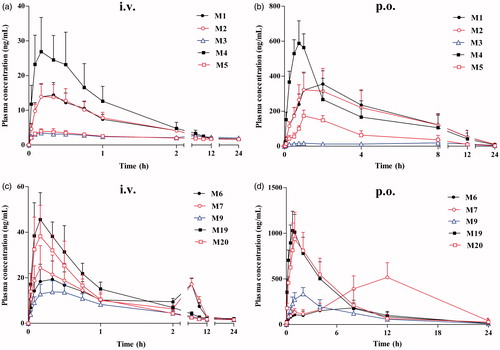
Table 3. Pharmacokinetic parameters of harmane and its 10 metabolites (M1–M7, M9, M19 and M20) in rats after intravenous administration of harmane at a dose of 1.0 mg/kg (mean ± SD, n = 8).
After intravenous bolus administration of harmane, the harmane plasma concentration versus time curve produced a sharp decline in the concentration, followed by a fast phase of decrease with T1/2e of 4.71 ± 1.46 h, until the levels fell below the detection limits; metabolization occurred to form various metabolites in rat plasma at various sampling points, including monohydroxylation (M1–M3), N-oxidation (M4 and M5), O-glucuronide conjugation (M6, M7 and M9), and O-sulphate conjugation (M19 and M20) products of harmane, within 8 h after intravenous administration ( and ). The concentrations for harmane and its 10 metabolites at different sampling time points were upon the detection limits, thus the plasma concentration versus time curves and the pharmacokinetic parameters of harmane and its 10 metabolites were all obtained in vivo ( and ). Following the sharp decline in harmane concentration, most of harmane was transformed to its 10 metabolites, namely M1–M7, M9, M19 and M20, specifically with a very high speed for M19 and M20 formation.
Compared with intact harmane, the Tmax, T1/2e, MRT and Vd values of metabolites were substantially higher than those of harmane, and the Cmax, Ke and AUC0–t values were significantly lower than that of the intact drug (); these results indicated that harmane with a short Tmax and high Cmax can be rapidly metabolized into various metabolites and cleared more quickly from blood. Generally, the intact drug would be excreted easily because of the increasing polarity of metabolites by metabolism in vivo. However, an inconsistent result was acquired in the current study. T1/2e and MRT values of metabolites were much longer than those of harmane, hence suggesting that the metabolites were eliminated slower. Furthermore, the Vd value of harmane was relatively high, probably because of the following reasons: harmane was rapidly metabolised to form metabolites and led to a low initial harmane concentration, and these metabolites can distribute to and accumulate in tissues. Considerable differences in most pharmacokinetic parameters were observed between phase I metabolites (M1–M5) and phase II metabolites (M6, M7, M9, M19 and M20) after dosing. AUC0–t values of phase II metabolites were much higher than those of phase I metabolites, and the T1/2e and MRT values were lower than those of phase I metabolites according to the results shown in . Therefore, the phase II metabolites were the major metabolites with higher polarity and can be excreted more easily. For the phase II metabolites (glucuronidation metabolites: M6, M7 and M9; sulphation metabolites: M19 and M20), the Cmax, T1/2e and MRT values of sulphation metabolites were much higher than those of glucuronidation metabolites, and the Tmax and CL values were lower than those of glucuronidation metabolites (). These results suggested that sulphate-conjugated metabolites with higher Cmax and shorter Tmax in rat plasma were probably associated with the high expression, affinity and activity of the sulphotransferases in vivo in rat, and there was reasonable in accordance with the lower affinity of glucuronsyltransferases (Zeng et al. Citation2008). Additionally, the result indicated that the Tmax values of glucuronide-conjugated metabolites were much longer than those of other metabolites because most proteins of glucuronsyltransferases were present in the lumen of endoplasmic reticulum; consequently, the endoplasmic reticulum became the diffusion barrier for the entrance of substrate and cofactor and excretion of metabolites, thus resulting in a lag phenomenon of drug metabolism (Zeng et al. Citation2008).
The metabolic transformation pathways of harmane include monohydroxylation (M1–M3), dihydroxylation (M10–M18), N-oxidation (M4 and M5), O-glucuronide conjugation (M6–M9), O-sulphate conjugation (M19 and M20) and glutathione conjugation (M21). A total of 21 metabolites (M1–M21) involved in both phase I and II metabolism processes were identified, with 10 coming from the plasma, including M1–M7, M9, M19 and M20 (Li et al. Citation2014). For the metabolic profiles of harmane in rat plasma, four metabolic pathways (monohydroxylation, N-oxidation, O-glucuronide conjugation and O-sulphate conjugation) were found, which can be divided into six routes: (1) harmane was transformed to M1 through monohydroxylation, followed by sulphation to form M19; (2) harmane was transformed to M2 with monohydroxylation as the first step, followed by a sulphation reaction to form M20; (3) harmane was transformed to M5 by N-oxidation and subsequently formed M9 through glucuronide conjugation; (4) harmane was transformed to M1, followed by glucuronide conjugation to form M6; (5) harmane was transformed to M3 and further glucuronidation to form M7; and (6) harmane was transformed to M4 by N-oxidation (). According to the AUC0–t values of all metabolites, route one and two were dominant in harmane metabolism, following a single oral and intravenous administration. These results indicated that sulphation pathways were the predominant metabolic routes for harmane for both methods of administration.
Pharmacokinetics of harmane and its metabolites after oral administration of harmane
The pharmacokinetic parameters of harmane and its 10 metabolites in vivo were all obtained after oral administration at the dose of 30.0 mg/kg. and present the mean plasma concentration–time curves of harmane and its 10 metabolites (M1–M7, M9, M19 and M20) after oral administration in rats. gives the corresponding pharmacokinetic parameters of harmane and its 10 metabolites following oral administration in rats.
Table 4. Pharmacokinetic parameters of harmane and its 10 metabolites (M1–M7, M9, M19 and M20) in rats after oral administration of harmane at a dose of 30.0 mg/kg (mean ± SD, n = 8).
Following oral administration, harmane can be immediately absorbed into the blood circulation with the high Cmax of 1059.56 ± 91.06 ng/mL and short Tmax of 0.23 ± 0.06 h after a single oral dose of 30.0 mg/kg body weight in rats ( and ). The plasma concentration versus time curve of harmane produced a rapid phase of decrease with T1/2e of 2.26 ± 0.53 h until the levels fell below the detection limits within 8 h after administration. After dosing, most of harmane was transformed to its metabolites, namely M1–M7, M9, M19 and M20 (), with a relatively high speed and amount for the formation of M19 and M20, which presented the same trend with intravenous dosage.
Combining the previous study with the current experiment, the metabolic profiles of harmane in rat plasma can also be divided into six routes (). According to the AUC0–t values of all metabolites, route one and two were dominant in harmane metabolism. These results indicated that the sulphation pathways were also the major metabolic routes for harmane after administration by gastric gavage.
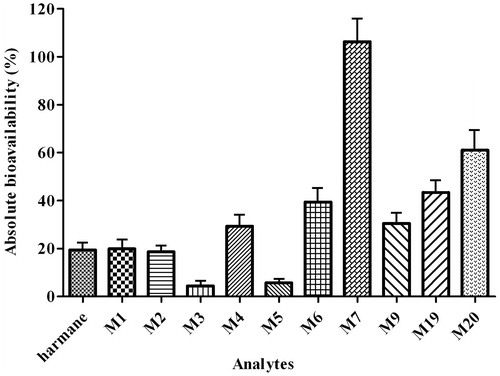
For a drug administrated by oral route, oral bioavailability is one of the most important pharmacokinetic parameters because it is a good indicator of the ability of drug to deliver to systemic circulation. Oral bioavailability is a complicated parameter that involves a number of chemical and physical processes. Low bioavailability of a drug may result from several different reasons, such as significant hepatic first pass effect, insufficient hydrophilicity and lipophilicity. In the present study, considering the different administration routes of harmane, the F of harmane was 19.41 ± 3.97% after controlled harmane administration at a dose of 30.0 mg/kg compared with the AUC0–∞ of intact harmane after intravenous injection at a dose of 1.0 mg/kg in rats. The low bioavailability of harmane was consistent with the prediction that harmane might possess little intestinal absorption. However, the F of harmane, calculated by phase II metabolites (M6, M7, M9, M19 and M20), was increased to 39.38 ± 8.72, 106.34 ± 14.88, 30.54 ± 7.91, 43.41 ± 8.06 and 61.09 ± 12.64% after oral administration of harmane at a dose of 30.0 mg/kg, accordingly (). The metabolic extent of harmane transformed to phase II metabolites after an oral dose was more than that after an intravenous dose. Therefore, in addition to metabolism in liver, the gastrointestinal flora and microsomes can play vital roles in the metabolic pathways of harmane transforming to phase II metabolites, or the inhibition to P-gp and induction to CYP450 enzymes; thereby, the absorption or acceleration of the metabolism of intact drug in the present experiment can be enhanced. However, this presumption needs further verification. Nevertheless, the F of harmane calculated from the metabolites of phase I (M3 and M5) was reduced to 4.38 ± 1.73 and 5.74 ± 1.14% after oral administration, respectively (). Moreover, the F of harmane calculated from phase I metabolites, namely M1, M2 and M4, were similar with that from the intact drug. These results also indicated that the metabolic levels of phase II metabolites were higher than those of phase I metabolite in rats in vivo after oral administration of harmane.
Figure 5. Comparison of the absolute bioavailability of harmane and its 10 metabolites (M1–M7, M9, M19 and M20) in rats after oral administration of harmane at a dose of 30.0 mg/kg.
In the present study, a semiquantitative estimation approach was introduced to calculate the plasma concentrations of 10 metabolites. This approach was mainly used to calculate the plasma concentrations of 10 metabolites based on the calibration curve of harmane because of the unavailable reference chemical standards. Although this approach presents some limitations related to the difference on the ionization rates of harmane and its 10 metabolites, the approach is an alternative strategy for interpreting the pharmacokinetic data of the metabolites. This approach was also successfully applied to characterize the pharmacokinetics of the main metabolites of senecionine and adonifoline in rats (Wang et al. Citation2011) and estimate the carboxylesterase metabolites of dabigatran etexilate in the investigation of metabolism for dabigatran etexilate in vitro (Hu et al. Citation2013). Given the advantage of this semiquantitative estimation approach, the pharmacokinetic characteristics of the 10 metabolites were determined, which was helpful to clarify the pharmacokinetic properties of harmane in vivo. Furthermore, the approach presented in the present study provided a solution to the bioanalytical need for quick semiquantitative estimation of harmane metabolites in the preclinical pharmacokinetic study.
To calculate the pharmacokinetic parameters (Vd, CL and MRT) of metabolites M1–M7, M9, M19 and M20, the non-compartmental model should be given an initial dose to calculate the parameters. However, for these metabolites, the initial dose was not actually known (the initial dose should be zero). When intact harmane was intravenously or orally administrated to rats, the following can be presumed: (1) all intact harmane was metabolized to the metabolite M1 (other metabolites existed), and (2) a time lag existed in the blood between the exposure time for intact drug and the time for its metabolites (Wang et al. Citation2011). Hence, the plasma concentration of M1 increased with time from zero to a peak level. Therefore, for metabolite M1, the physiological disposition can result from oral administration. The metabolism of harmane to M1 can be treated as M1 absorption. Therefore, when the parameters of those metabolites were calculated, the oral model can be used to calculate the pharmacokinetic parameters. The dose of intact drug given would be approximately treated as the initial oral dose of M1 or other metabolites. Some speculative pharmacokinetic profiles and parameters were obtained for metabolites of harmane detected in rats using approximate treatment.
Levels of harmane and its uncertain endogenous metabolite harmine in the plasma of normal rats
Harmane and harmine are both endogenously present in organisms and certain plants, and the preliminary experimental results are consistent with that they are naturally occurring in rat plasma. To clarify the dynamic changes of harmane and harmine in normal rats, the blood samples of normal rats were collected from the angular vein with different time points in a period of 24 h.
Harmane and harmine were naturally presented in rat plasma and fluctuated within certain concentration ranging within 1.74–1.89 ng/mL and 3.25–3.88 ng/mL, respectively (). After harmane administration in both intravenous and oral routes, no further harmine was generated. The harmine concentrations had not changed significantly (from 2.10 to 6.72 ng/mL and 3.25 to 3.88 ng/mL in the presence and absence of harmane). These results further confirmed that harmane cannot be metabolized to harmine in rat in vivo. Furthermore, the naturally present harmane and harmine are probably related to the physiological functions in vivo in rats, which need further study.
Figure 6. Mean plasma concentration–time curves of harmane (a) and harmine (b) in normal and test rats after intravenous and oral administration of harmane.
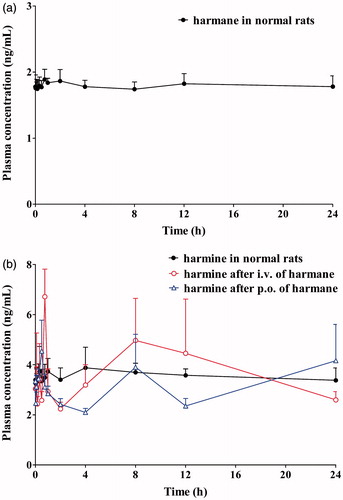
Figure 7. Proposed metabolic pathways of harmane: the present proposed metabolic pathways of harmane in rats after intravenous and oral administration of harmane at doses of 1.0 and 30.0 mg/kg, respectively (a); the published proposed metabolic pathways for harmane and harmine (b) (Guan et al. Citation2001).
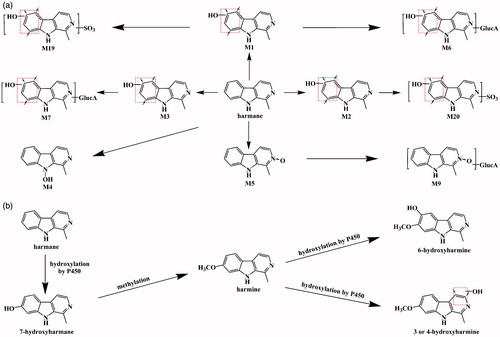
According to the study by Guan et al. (Citation2001), harmine is harmane metabolite in rats after a single oral dose of 20 mg/kg. A proposed metabolic pathway for harmane has been suspected that harmane can be metabolized by CYP450 to produce harmol, which was further methylated to form harmine (). In the present study, no further harmine can be found at different sampling time points in rat plasma in vivo (), which was consistent with our previous studies (Li et al. Citation2014). From the results of this paper, harmine is not a harmane metabolite.
Conclusions
A rapid, accurate and sensitive UPLC-ESI-MS/MS method was established and validated for the simultaneous quantitative determination of harmane and its uncertain endogenous metabolite harmine, as well as for the semiquantitative determination of 10 metabolites of harmane in a small volume of rat plasma for the first time. The method has been successfully applied to a preclinical pharmacokinetic study of harmane after intravenous and intragastric administration of harmane. The pharmacokinetic profiles of harmane and its 10 metabolites were observed, and the sulphation pathways were the major metabolic routes for harmane administration in rats. Harmane showed a low bioavailability in rats after its intragastric administration within the tested dosage. Moreover, harmine was not a detectable harmane metabolite in rats in vivo. Overall, the present study is most helpful for interpreting the mechanisms of metabolic bioactivation and detoxication of harmane and will provide valuable information for future drug developments.
Declaration of interest
The authors report that they have no conflict of interest. The authors gratefully acknowledge the grants from the Key Program of Joint Funds of the National Natural Science Foundation of China and Xinjiang Uygur Autonomous Region of China (No. U1130303), the National Nature Science Foundation of China (No. 81173119), the Key Project of Ministry of Science and Technology of China (2012ZX09103201-051) and the Program of Shanghai Subject Chief Scientist (13XD1403500), which have been awarded to Professor Chang-hong Wang to finance this study.
References
- Alves RC, Casal S, Oliveira BPP. 2007. Factors influencing the norharman and harman contents in espresso coffee. J Agric Food Chem. 55:1832–1838.
- Anderson NJ, Robinson ESJ, Husbands SM, Delagrange P, Nutt DJ, Hudson AL. 2003. Characterization of [3H]harmane binding to rat whole brain membranes. Ann N Y Acad Sci. 1009:175–179.
- Anderson NJ, Tyacke RJ, Husbands SM, Nutt DJ, Hudson AL, Robinson ESJ. 2006. In vitro and ex vivo distribution of [3H]harmane, an endogenousbeta-carboline, in rat brain. Neuropharmacology 50:269–76.
- Arib O, Rat P, Molimard R, Chait A, Faure P, Beaurepaire R. 2010. Electrophysiological characterization of harmane-induced activation of mesolimbic dopamine neurons. Eur J Pharmacol. 629:47–52.
- Guan J, Zhao Y, Zhu HY, An ZZ, Yu YM, Li RJ, Yu ZG. 2014. A rapid and sensitive UHPLC-MS/MS method for quantification of 2-(2-hydroxypropanamido) benzoic acid in rat plasma: application to a pharmacokinetic study. J Pharm Biomed Anal. 95:20–25.
- Guan YB, Louis ED, Zheng W. 2001. Toxicokinetics of tremorogenic natural products, harmane and harmine, in male Sprague–Dawley rats. J Toxicol Environ Health Part A 64:645–660.
- Hu ZY, Parker RB, Herring VL, Casey Laizure S. 2013. Conventional liquid chromatography/triple quadrupole mass spectrometry based metabolite identification and semi-quantitative estimation approach in the investigation of in vitro dabigatran etexilate metabolism. Anal Bioanal Chem. 405:1695–1704.
- Kuhn W, Müller T, Grosse H, Rommelspacher H. 1995. Plasma harman and norharman in Parkinson's disease. J Neural Transm. 46:291–295.
- Li SP, Liu W, Teng L, Cheng XM, Wang ZT, Wang CH. 2014. Metabolites identification of harmane in vitro/in vivo in rats by ultra-performance liquid chromatography combined with electrospray ionization quadrupole time-of-flight tandem mass spectrometry. J Pharm Biomed. 92:53–62.
- Louis ED, Jiang W, Pellegrino KM, Rios E, Factor-Litvak P, Henchcliffe C, Zheng W. 2008. Elevated blood harmane (1-methyl-9H-pyrido-[3,4-b]-indole) concentrations in essential tremor. Neurotoxicology 29:294–300.
- Louis ED, Zheng W, Mao XL, Shungu DC. 2007. Blood harmane is correlated with cerebellar metabolism in essential tremor: a pilot study. Neurology 69:515–520.
- Louis ED, Zheng W, Applegate L, Shi L, Factor-Litvak P. 2005. Blood harmane concentrations and dietary protein consumption in essential tremor. Neurology 65:391–396.
- Nasehi M, Piri M, Nouri M, Farzin D, Nayer-Nouri T, Zarrindast MR. 2010. Involvement of dopamine D1/D2 receptors on harmane-induced amnesia in the step-down passive avoidance test. Eur J Pharmacol. 634:77–83.
- Ostergren A, Annas A, Skog K. 2004. Long-term retention of neurotoxic beta-carbolines in brain neuromelanin. J Neural Transm (Vienna). 111:141–157.
- Pfau W, Skog K. 2004. Exposure to beta-carbolines norharman and harman. J Chromatogr B Analyt Technol Biomed Life Sci. 802:115–126.
- Piletz JE, Zhu H, Ordway G, Stockmeiera C, Dillyd G, Reise D, Halaris A. 2000. Imidazoline receptor proteins are decreased in the hippocampus of individuals with major depression. Biol Psychiatry 48:910–919.
- Poindexter EH Jr, Carpenter RD. 1962. The isolation of harmane and norharmane from tobacco and cigarette smoke. Phytochemistry 1:215–221.
- Rommelspacher H, Schmidt LG, May T. 1991. Plasma norharman (beta-carboline) levels are elevated in chronic alcoholics. Alcohol Clin Exp Res. 15:553–559.
- Serra PA, Pluchino S, Marchetti B, Desole MS, Miele E. 2008. The MPTP mouse model: cues on DA release and neural stem cell restorative role. Parkinsonism Relat D 14:189–193.
- Spijkerman R, Vanden Eijnden R, Vanden Mheen D, Bongers I, Fekkes D. 2002. The impact of smoking and drinking on plasma levels of norharman. Eur Neuropsychopharmacol. 12:61–71.
- Squires PE, Hills CE, Rogers GJ, Garland P, Farley SR, Morgan NG. 2004. The putative imidazoline receptor agonist, harmane, promotes intracellular calcium mobilisation in pancreaticbeta-cells. Eur J Pharmacol. 501:31–39.
- Stohler R, Rommelspacher H, Ladewig D. 1995. The role of beta-carbolines (harman/norharman) in heroin addicts. Eur Psychiatry 10:56–58.
- US Food and Drug Administration. 2001. Guidance for industry: bioanalytical method validation. USA: Centre for Drug Evaluation and Research.
- Wang CH, Li Y, Gao JG, He YQ, Xiong AZ, Yang L, Cheng XM, Ma YM, Wang ZT. 2011. The comparative pharmacokinetics of two pyrrolizidine alkaloids, senecionine and adonifoline, and their main metabolites in rats after intravenous and oral administration by UPLC/ESIMS. Anal Bioanal Chem. 401:275–287.
- Yang YD, Cheng XM, Liu W, Chou GX, Wang ZT, Wang CH. 2015. Potent AChE and BChE inhibitors isolated from seeds of Peganum harmala Linn by a bioassay-guided fractionation. J Ethnopharmacol. 168:279–286.
- Yu AM, Idle JR, Kausz KW, Kupfer A, Gonzalez FJ. 2003. Contribution of individual cytochrome P450 isozymes to the O-demethylation of the psychotropic beta-carboline alkaloids harmaline and harmine. J Pharmacol Exp Ther. 305:315–322.
- Zeng S, Zhou Q, Yu LS, Chen SQ. 2008. Drug metabolism. China: Zhejiang University Publisher.
- Zetler G, Singbartl G, Schlosser L. 1972. Cerebral pharmacokinetics of tremor-producing harmala and iboga alkaloids. Pharmacology 7:237–248.
- Zhao T, Ding KM, Zhang L, Cheng XM, Wang CH, Wang ZT. 2013. Acetylcholinesterase and butyrylcholinesterase inhibitory activities of β-carboline and quinoline alkaloids derivatives from the plants of genus Peganum. J Chem. 2013:1–6.