
Abstract
Context It has been found that hydroxysafflor-yellow A (HSYA) inhibits angiogenesis and the proliferation of abnormal human umbilical vein endothelial cells (HUVECs) in our previous study; however, the mechanism is still unclear.
Objective This study investigates the mechanisms of HSYA inhibiting abnormal proliferation of HUVECs through detecting the expression of vascular endothelial growth factor (VEGF) and its receptor (KDR), and the protein expression in the Ras-Raf-MEK-ERK-signalling pathway.
Materials and methods HepG2 cell cultural supernatant was used to culture HUVECs to make promote abnormal proliferation, and HSYA was added into the medium. The expression of VEGF, KDR, c-myc, N-ras and NF-κB1 in abnormal HUVEC was detected by RT-qPCR and ELISA at the mRNA and protein levels. Protein expression of ERK signal pathway was measured by Western blot.
Results Compared with the abnormal proliferation of HUVECs without any treatment, HSYA inhibited the expression of VEGF and KDR in vitro. Similarly, the protein expression of Ras, p-raf, p-ERK and p-p38MARK in the abnormal HUVECs was reduced when they were treated by HSYA, especially in p-ERK, yet the total raf, ERK, p38MAPK and Akt were not changed whether HSYA existed or not. HSYA could also inhibit the expression of c-myc, N-ras, and NF-κB1.
Conclusion When the abnormal HUVECs were treated with HSYA, the low expression of VEGF and KDR reduced the expression of oncogene and transcription factor through the Ras-Raf-MEK-ERK1/2 pathway of the MAPK family. This resulted in inhibiting the abnormal proliferation of HUVECs and angiogenesis.
Keywords:
Introduction
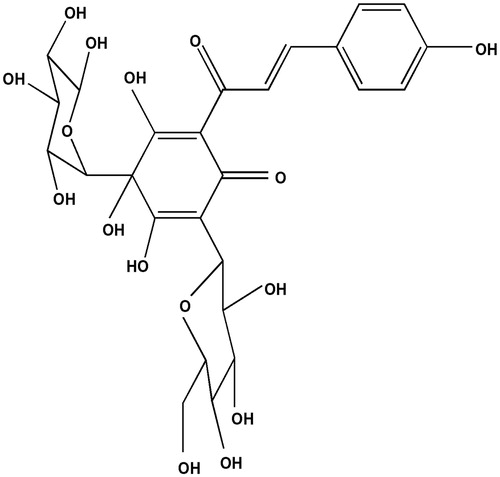
Hydroxysafflor-yellow A (HSYA) () is a water-soluble compound with a chalcone glycoside structure, and is one of the main active ingredients of the traditional Chinese medicine safflower [Carthamus tinctorius L. (Asteraceae)]. We investigated the inhibitory effects of HSYA on newly formed blood vessels in a chick chorioallantoic membrane (CAM) study, and found that HSYA significantly decreased the number of CAM blood vessels and provoked thinning of vessel walls.
Figure 1. Molecular structure of hydroxysafflor-yellow A.
This was the first report in the literature showing that HSYA inhibits angiogenesis in CAM (Zhang et al. Citation2004). We also established an in vitro co-culture method of a HepG2 human tumour cell-line and HUVEC, and explored time-dependent effects of HSYA on inhibiting abnormal proliferation of endothelial cells induced by tumour cell culture supernatant, as determined by a methyl thiazolyl tetrazolium (MTT) assay.
We showed that HSYA, within a certain concentration, can significantly inhibit abnormal proliferation of tumour cell culture supernatant-induced (TCCS) endothelial cells without affecting normal endothelial cell growth (Wang et al. Citation2009). In addition, flow cytometry revealed that HSYA decreased the proportion of abnormally proliferated human umbilical vein endothelial cells (HUVEC) entering the S phase of the cell cycle following treatment by the tumour culture supernatant. This analysis also revealed that the frequency of apoptotic cells decreased, and that the gene and protein expression of the apoptosis-related cytokine TNF-α was enhanced, suggesting that HSYA promotes the selective apoptosis of tumour culture supernatant-induced HUVEC (Wang et al. Citation2008).
However, the specific mechanisms remain unclear. In this study, we explored the effects of HSYA on the expression of angiogenesis-related factors in the abnormally proliferated HUVEC, detected changes in the expression of key signal transduction molecules in the extracellular signal-regulated kinase (ERK) pathway and explored the molecular mechanisms by which HSYA suppresses the abnormal proliferation of HUVEC.
Materials and methods
Cell lines
HUVEC were collected from umbilical cords of healthy newborns that were delivered by caesarean section in the Department of Obstetrics, Sino-Japanese Friendship Hospital, Beijing, China. The human hepatoma cell-line HepG2 was donated by the Chinese Internal Medicine Laboratory, Dongzhimen Hospital Affiliated to Beijing University of Chinese Medicine, Beijing, China.
The following materials, reagents, consumables and devices were used in the study: HSYA (HSYA) standards (China Pharmaceutical and Biological Products, Beijing, China), collagenase (Gibco, Grand Island, NY) newborn calf serum (Hyclone Company, Logan, UT), cell growth factor (Roche Life Sciences, Inc., Basel, Switzerland), trypsin, glutamine, dimethyl sulphoxide (Sigma, St. Louis, MO), CO2 incubator (Heraeus, Hanau, Germany), low-temperature centrifuge (Sigma, St. Louis, MO), a full wavelength PCR instrument (MJ Research Inc., Waltham, MA, Programable Thermal Controller PTC-100), fluorescence quantitative PCR instrument (Roche LightCycler 2.0, Basel, Switzerland), horizontal electrophoresis apparatus (BIO PARK, Toronto, Canada), vertical electrophoresis apparatus (BIO RAD, Hercules, CA), protein electroporation apparatus (BIO RAD, Hercules, CA) and gel imager (Alpha Innotech Flurochem, Hercules, CA).
HUVEC culture, identification and grouping
HUVEC were isolated by conventional methods, and used for primary culture. Cell passages were performed when the cells reached 80% confluence. Cell morphology was confirmed by inverted microscopic examination (Nikon Eclipse, Nikon Corp., Tokyo, Japan), and factor VIII-related antigen assay was used to identify the cells. Cells at passages 3–6 were selected for use in the experiments, digested, centrifuged and prepared in M199 medium (Gibco, Grand Island, NY) containing 20% foetal bovine serum (Hyclone, Logan, UT) as a single cell suspension. The cell densities were adjusted to 1 × 10⁸ L − 1. Then, the cell suspension was incubated at 37 °C and 5% CO2 for 12 h. After the supernatant was discarded, the cell suspension was incubated with 50% HepG2 tumour culture supernatant (in M199 culture medium), with or without HSYA. In the control, the same volume of M199 medium was added to the cell suspension. After cell culture for 24 h, cells were subject analyzed as described below.
Real-time polymerase chain reaction (RT-PCR) detection of mRNA expression of VEGF, KDR, bFGF, c-myc, N-ras and NF-κB1
After the supernatant in the cell culture flask was discarded, the cells were washed twice with sterile D-Hanks solution, and extracted for total RNA with Trizol reagent following the instructions of the manufacturer (Invitrogen, Waltham, MA). The levels and the purity of the isolated RNA were detected by UV spectrophotometry. The integrity of total RNA was evaluated based on the results of 0.9% agarose gel electrophoresis.
Total RNA (3 μg) was extracted from the cells, and reacted with molecular biology grade water, the primer (Oligo dT), 5× reverse transcriptase buffer, dNTPs, RNA inhibitors and AMV reverse transcriptase (Promega Corporation, Madison, WI) for the reverse transcription reaction. The reaction was carried out using the SYBR Green I dye technology according to the instructions for the fluorescence quantitative PCR kit (Roche Life Sciences, Inc., Basel, Switzerland). The reaction system (20 μL) consisted of cDNA (2 μl), ddH2O (13 μl), SYBR Green fluorescence quan-titative PCR Mix (4 μl) and primers (1 μl) (). Reduced glyceraldehyde–phosphate dehydrogenase (GAPDH) gene was used as an internal control. The reaction was performed at 94 °C for 10 min, 94 °C for 10 s, 60 °C for 10 s, 72 °C for 10 s and with a total of 45 cycles. Melting curves were plotted to determine whether a single peak was obtained. After the reaction, agarose gel electrophoresis was used to evaluate if the amplification product had the desired length (Roche Life Sciences, Inc., Basel, Switzerland). PCR reactions and data collection were performed using the LightCycler 2.0 system (Roche Life Sciences, Inc., Basel, Switzerland). The cycle threshold (CT) was recorded. GAPDH was used as an internal reference control. Relative mRNA expression of the target gene was calculated using the 2−ΔΔCT method, where ΔCt value = target gene Ct value − GAPDH Ct value.
Table 1. Primer sequences for real-time quantitative PCR.
Enzyme-linked immunosorbent assay (ELISA) detecting VEGF and bFGF content in cell culture supernatant and KDR, c-myc and N-ras content in cell lysates
The ELISA was performed according to the instructions of the human VEGF ELISA kit (Wuhan Boster Biological Engineering Co., Ltd., Wuhan, China), human KDR ELISA kit (Sunbio Biomedical Technology Co., Ltd., Shanghai, China), human bFGF ELISA kit (Becton, Dickinson and Company, Franklin Lakes, NJ), human c-myc ELISA kit and human ras ELISA kit (Sunbio Biomedical Technology Co Ltd., Shanghai, China). Two replicates were performed for each sample. Standards at various concentrations and samples were added to the each well (100 μL per well), mixed gently, and incubated at 37 °C for 60 min. The liquid in the plate was removed by shaking. Then, biotinylated antibody (100 μL per well) was added to each well, incubated at 37 °C for 90 min, washed and then incubated with horseradish peroxidase-labelled avidin (100 μL per well). After incubating at 37 °C for 30 min, plates were washed, and incubated with a colour development reagent (50 μL per well), and then incubated at 37 °C in the dark for 15 min. The colorimetric reaction was terminated with stop reagent (100 μL per well), mixed and the absorbance values detected at a wavelength of 450 nm (A450) and at 492 nm (A492) by a microplate reader (Tecan, Chapel Hill, NC). The standard curve was plotted with A450 as the y-axis and standard concentration as the x-axis, from which the protein content in each sample was determined.
Western blot assay in the detection of signal transduction-related molecules
The cells were digested in 0.25% trypsin (Sigma, St. Louis, MO) and 0.22% EDTA, centrifuged and cultured with RIPA lysis buffer to extract total protein in the cells. Then, the proteins were quantified by the BCA method. The proteins were added to the wells of a plate (80 μg total protein per well), subjected to 10% SDS-PAGE and transferred to a PVDF membrane. The membrane was blocked by adding 5% skim milk proteins, incubated at 4 °C overnight, and primary antibodies (1:1000) directed against c-Raf antibody, ras antibody, phospho-ERK1/2 (Thr202/Tyr204) antibody, ERK antibody, phospho-p38 MAPK (Thr180/Tyr182) (28B10) mouse mAb, p38 MAP kinase antibody, Akt (5G3) mouse mAb and phospho-Akt (Ser473) antibody (Cell Signaling Technology Inc., Danvers, MA). After incubating at 4 °C overnight, the protein was washed and incubated with the secondary antibodies (1:5000) (Puli Lai Gene Technology Co., Ltd., Beijing, China), at room temperature for 1 h, washed and then reacted with Super ECL Plus chemiluminescent substrate (Puli Lai Gene Technology Co., Ltd., Beijing, China) to visualize the protein bands. After X-ray exposure, light densities of the target film were analyzed using an image processing system.
Statistical analysis
All data are expressed as mean ± standard deviation (SD). Data analysis was performed using the SPSS v.13.0 software program (SPSS Inc., Chicago, IL). One-way analysis of variance (ANOVA) and least significant difference (LSD) tests were used for all intergroup comparisons. For all analyses, an alpha value of less than 0.05 (p < 0.05) was considered to be statistically significant.
Results
HUVEC identification
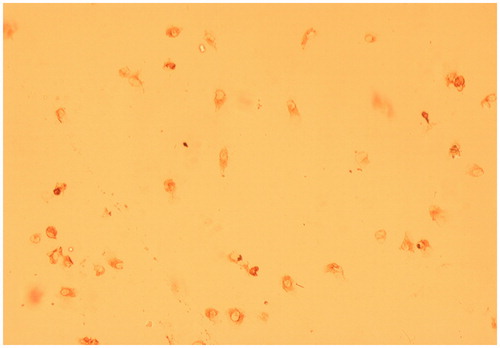
By fluorescent microscopy, the cultured cells that were incubated with factor VIII-related antigen antibody had red-brown precipitate residues in the cytoplasm, which confirmed that the cultured cells were HUVEC ().
Figure 2. The figure of HUVEC cells. HUVEC were stimulated with factor VIII, and the related antigen-antibody complexes had red-brown precipitate in the cytoplasm (× 40 magnification).
Effects of HSYA on the level of VEGF and KDR in the tumour cell culture supernatant -induced HUVEC
After agarose gel electrophoresis, total cellular RNA was observed under ultraviolet light and two clear bands (18 and 28 s) were found, showing that the sample remained intact without being degraded. UV spectrophotometric inspection showed that the ratio of the absorbance values at 260 and 280 nm in all the samples was in the range of 1.8–2.0, suggesting that the purity of all the samples met the requirements.
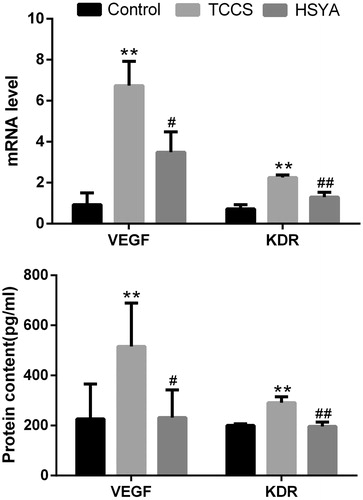
By real-time PCR, the melting curve of each product revealed a single peak, and the amplification products were of lengths in line with the original design. Compared with the control group, mRNA expression and protein content of VEGF in HUVECs were significantly increased (p = 0.0001 and 0.0006, respectively) in the TCCS group. KDR were significantly increased too (p = 0.0009 and 6.2565E − 05, respectively) (). Compared with the TCCS group, VEGF mRNA expression and protein content of HUVECs were significantly reduced in the HSYA group (p = 0.027 and 0.014, respectively). Meanwhile, KDR mRNA expression and protein content in the cell lysates were significantly lower in the HSYA group (p = 0.0076 and 0.0081, respectively) as compared with the TCCS group.
Figure 3. mRNA and protein expression of HUVEC VEGF and KDR in each group. Note: compared with the control group, **p <0.01; compared with the TCCS group, #p <0.05, ##p <0.01.
Basic fibroblast growth factor (bFGF) concentration and intracellular bFGF mRNA expression in HUVEC cell culture supernatant treated with HSYA
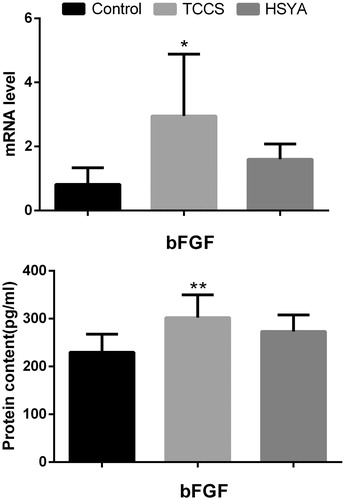
Compared with the control group, bFGF in the TCCS group was significantly increased (p = 0.0096), and intracellular bFGF mRNA expression in the TCCS group was significantly upregulated (p = 0.025) (). The bFGF content and the cellular bFGF mRNA expression in the HSYA group were not significantly different from that seen in the TCCS group.
Figure 4. Expression level of bFGF in HUVEC cell culture supernatant treated with HSYA. Note: compared with the control group, *p < 0.05, **p < 0.01.
Expression of signal transduction-related molecules in the ERK pathway of HUVEC detected by western blot assay
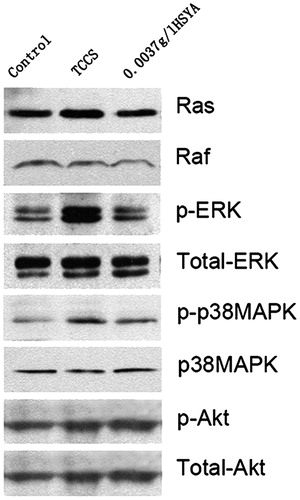
Western blot assay showed that when compared with the tumour cell culture supernatant-induced group, the expression of Ras, raf, p-ERK and p-p38MAPK in the HSYA group was decreased (). Total expression of raf, ERK, p38MAPK and Akt expression was not significantly different among the three groups.
Figure 5. Expression level of related molecules in the ERK pathway of HUVECs. Of the three protein band patterns on each gel, the control group (left), tumour cell culture supernatant-induced group (middle) and the HSYA-treated group (right) are shown.
Effects of HSYA on the mRNA level of c-myc, N-ras and NF-κB1 in HUVEC induced by supernatant of tumour cell culture
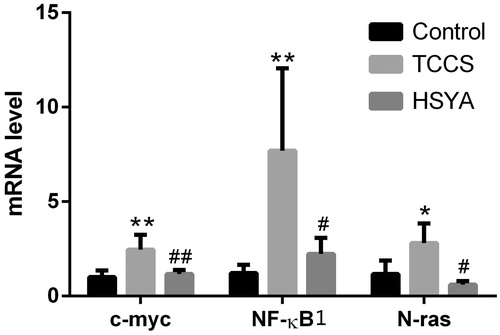
Compared with the control group, mRNA level of c-myc, N-ras and NF-κB1 in HUVEC was significantly increased (p = 0.003, 0.034 and 0.006, respectively) in the TCCS group. After treatment with HSYA, mRNA level of c-myc, N-ras, NF-κB1 in HUVEC was significantly reduced (p = 0.006, 0.010 and 0.013, respectively) ().
Figure 6. The mRNA expression of c-myc, N-ras and NF-κB1 in the tumour cell culture supernatant-induced HUVEC. Note: compared with the control group, *p < 0.05, **p < 0.01; compared with the TCCS group, #p < 0.05, ##p < 0.01.
Effects of HSYA on the protein content of c-myc and N-ras in HUVEC induced by supernatant of tumour cell culture
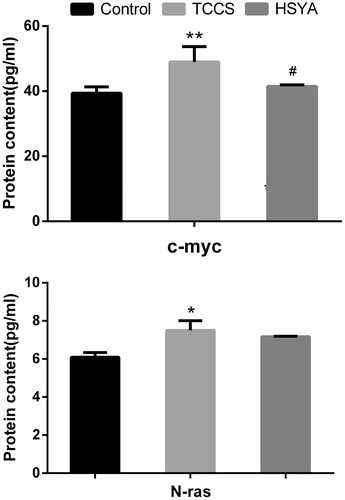
Compared with the control group, the protein content of c-myc and N-ras in HUVEC cell lysates was significantly increased (p = 0.007 and p = 0.015) in the TCCS group. After treatment with HSYA, the protein content of c-myc in HUVEC cell lysates was significantly reduced (p = 0.021), while the protein content of N-ras in HUVEC cell lysates was not significantly different ().
Figure 7. Content in cell lysates of c-myc and N-ras in the tumour cell culture supernatant-induced HUVEC. Note: compared with the control group, *p < 0.05; compared with the TCCS group, #p < 0.05.
Discussion
Tumour growth needs blood vessels for nutrition and removal of metabolites. Without new vessels, the tumour can remain very small in size (only 1–2 mm) for a long time. Once the new capillaries grow in the tumour tissue, the tumour can grow rapidly and its ability to invade and metastasize can greatly increase (Rivera & Bergers Citation2015). It was reported that at least 30 kinds of growth factors are associated with tumour angiogenesis, and the most direct angiogenic factors are VEGF and bFGF. In addition, VEGF and bFGF receptors in tumour vascular endothelial cells are also highly expressed (Relf et al. Citation1997). Moreover, angiogenesis is induced by VEGF and bFGF receptors on the surface of vascular endothelial cells (Relf et al. Citation1997).
Thus far, VEGF is the most efficient factor for promoting vascular endothelial cell growth (Clauss Citation2000; Yamaguchi et al. Citation2000) and displays a variety of biological activities, including playing a key role in tumour angiogenesis (Clauss Citation2000; Yamaguchi et al. Citation2000), and its expression in tumour tissue is significantly higher than normal control group (Su et al. Citation2009). VEGF increases vascular permeability, which is mediated by its receptor KDR. VEGF can stimulate endothelial cells to secrete bFGF, and bFGF can enhance its angiogenic activity via both autocrine and paracrine pathways. bFGF can promote cell division, endothelial cell migration and formation of tubular structures. It is also involved in the induction and differentiation of endothelial cells during angiogenesis, and is closely related with tumour invasion and metastasis (Zhao et al. Citation2015). bFGF is also associated with the progression and prognosis of cancer. Clinical studies have shown that FGF expression in tumour tissues such as bladder cancer, prostate cancer, endometrial cancer and paediatric solid tumours, is significantly high, and associated with poor prognosis (Li et al. Citation2015; Yan & Huang Citation2015).
Both VEGF and bFGF play important roles in tumour angiogenesis, and are targets for combined anti-tumour and angiogenic therapy. Antibodies targeted against VEGF and its receptor can block VEGF-mediated angiogenesis, inhibit tumour growth and reduce tumour volume. Tyrosine kinase activity can selectively inhibit the VEGF receptor and tumour growth (Reuter et al. Citation2007).
This study demonstrated that VEGF mRNA and protein expression in the TCCS group were significantly higher than those in the control group, and KDR mRNA and protein expression in the lysate were also significantly higher in the TCCS group than those in the control group. After treatment with HSYA, mRNA and protein expression of both VEGF and KDR in vascular endothelial cells were significantly decreased. We also checked the expression of both bFGF and its receptor, and found that after treatment with HSYA, their expression was not significantly different from those before HSYA treatment. This suggested that HSYA suppressed abnormal proliferation of vascular endothelial cells primarily by inhibiting the expression of VEGF and its receptors.
There are many studies on the biological function and intracellular signal transduction mechanism of VEGF and its receptors in tumour angiogenesis (Rivera & Bergers Citation2015), and the possibility of promoting some tumour metastasis (Yang et al. Citation2015; Zarkada et al. Citation2015). The biological activity of VEGF is mainly regulated by two tyrosine kinase receptors of VEGFR-1 (Flt-1) and VEGFR-2 (KDR/Flk-1). VEGFR-2 is the main functional receptor, and is located on the surface of endothelial cells, and can mediate cell survival, proliferation and differentiation. After associating with VEGF, VEGFR-2 is dimerized and its intracellular tyrosine residues are phosphorylated. Subsequently many signal transduction molecules are activated or modified such as Ras GAP, Raf-1, MEK, ERK, p38MAPK, PI3K, Akt/PKB, PLC-γ and PKC.
Three VEGF signal transduction pathways have been identified: (1) the Ras activated MAPKKK → MAPKK → MAPK pathway, (2) the PI3K → Akt/PKB pathway and (3) the PLC-γ → PKC pathway. These three pathways can be cross activated (Shibuya & Claesson-Welsh Citation2006). Once Ras protein is activated, signal transduction may be transduced through the MAPK pathway. In addition, PI3K is activated and the signal transduction can occur through the PI3K→ Akt/PKB pathway. Subsequently, PI3K activation activates PKC, which is followed by the activation of MAPKKK and MAPK pathway-signalling molecules (Rask-Madsen & King Citation2008). Most researchers believed that VEGF induces phosphorylation of Ras-GTP in endothelial cells, and that activated Ras activates Raf-MEK- ERK, which is a signalling pathway required by in vitro cultured HUVEC during the migration, proliferation and formation of new blood vessels (the Ras → Raf → MEK → ERK-activated MAPK pathway) (Xu et al. Citation2008). Other investigators believe that after binding VEGF and VEGFR-2, MAPK signal transduction is activated through the PLC-γ → PKC pathway (Grothey & Ellis Citation2008). In recent years, reports on anti-cancer therapy that target VEGF and its intracellular signal transduction molecules are increasing (Huang et al. Citation2013).
Our results showed that Ras, p-raf, p-ERK and p-p38MAPK expression were higher in the TCCS group than in the control group. After treatment with HSYA, their expression decreased, especially in the context of phosphorylated ERK. The total expression of raf, ERK, p38MAPK and Akt was not significantly different among the three groups. This observation indicated that HSYA might suppress abnormal proliferation of endothelial cells through the Ras → Raf → MEK → ERK1/2 pathway, and dephosphorylation of the corresponding kinase molecules. ERK1/2 might be the optimal suppression locus. Another subfamily of the MAPK pathway, p38MAPK, might also be involved in signal transduction. The intracellular signal transduction system can affect the expression of transcription factors and oncogenes, and ultimately affect cell proliferation and differentiation.
Ras oncogene proteins are plasma membrane-associated signal transducers that are found in all eukaryotes. Ras oncogene proteins include N-ras, H-ras and K-ras. Studies have shown that the activation of Ras can enhance the expression of vascular endothelial growth factor, suggesting that Ras plays a role in angiogenesis. Inhibiting the activity of Ras can inhibit Ras-dependent tumour cell proliferation and angiogenesis (Lau & Leung Citation2011). C-myc, a proto-oncogene, is believed to be one of the candidate oncogenes, the abnormal expression of c-myc caused oncogene activation, promoting tumour development. Studies have shown that the activity of Ras extends the half-life of myc by the accumulation of stable myc protein and activation of Ras → Raf → MAPK pathway (Szewezyk et al. Citation2002). NF-κB1, as a transcription factor protein, may participate in the regulation of apoptosis. Once the Ras → Raf→ MAPK pathway is activated, which will lead NF-κB translocating from the cytoplasm into the nucleus, and thus mediate the transcription of anti-apoptosis genes (Caraglia et al. Citation2006).
Our results suggested that mRNA and protein expression of c-myc, N-ras in the TCCS group were significantly higher than in the control group. NF-κB1 mRNA expression was also significantly higher in the TCCS group than in the control group. After treatment with HSYA, mRNA and protein expression of c-myc were significantly decreased. The mRNA level of N-ras and NF-κB1 was also significantly decreased. While the protein content of N-ras in HUVEC cell lysates was not significantly different. Indicating that HSYA could inhibit the abnormal-induced proliferation of the HUVEC through the inhibition of VEGF and its receptor KDR, and through the Ras→ Raf → MEK → ERK1/2 pathway, HSYA dephosphorylate the corresponding kinase molecules. The intracellular signal transduction system can further affect the expression of pathway downstream genes of NF-κB1 and c-myc, and HSYA ultimately suppress abnormal proliferation of vascular endothelial cells.
Declaration of interest
The study was supported by Natural Science Foundation of China (No. 30572436). The funding from the Science and Technology of Xiaoshan District (No. 2012121) and Zhejiang Natural Science Foundation Grant (LR12C05001). The authors report they have no conflicts of interests. The authors alone are responsible for the content and writing of this paper.
References
- Caraglia M, Tassone P, Marra M, Budillon A, Venuta S, Tagliaferri P. 2006. Targeting Raf-kinase: molecular rationales and translational issues. Ann Oncol. 17(Suppl 7):vii124–vii127.
- Clauss M. 2000. Molecular biology of the VEGF and the VEGF receptor family. Semin Thromb Hemost. 26:561–569.
- Huang F, Cao J, Liu Q, Zou Y, Li H, Yin T. 2013. MAPK/ERK signal pathway involved expression of COX-2 and VEGF byIL-1β induced in human endometriosis stromal cells in vitro. Int J Clin Exp Pathol. 6:2129–2136.
- Grothey A, Ellis LM. 2008. Targeting angiogenesis driven by vascular endothelial growth factors using antibody-based therapies. Cancer J. 14:170–177.
- Lau ST, Leung PS. 2011. Role of the RAS in pancreatic cancer. Curr Cancer Drug Targets. 11:412–420.
- Li X, Gu F, Niu C, Wang Y, Liu Z, Li N, Pan B, He D, Kong J, Zhang S, et al. 2015. VEGF111b, a C-terminal splice variant of VEGF-A and induced by mitomycin C, inhibits ovarian cancer growth. J Transl Med. 13:164.
- Rask-Madsen C, King GL. 2008. Differential regulation of VEGF signaling by PKC-alpha and PKC-epsilon in endothelial cells. Arterioscler Thromb Vasc Biol. 28:919–924.
- Relf M, LeJeune S, Scott PA, Fox S, Smith K, Leek R, Moghaddam A, Whitehouse R, Bicknell R, Harris AL. 1997. Expression of the angiogenic factors vascular endothelial cell growth factor, acidic and basic fibroblast growth factor, tumor growth factor beta-1, platelet-derived endothelial cell growth factor, placenta growth factor, and pleiotrophin in human primary breast cancer and its relation to angiogenesis. Cancer Res. 57:963–969.
- Reuter CW, Morgan MA, Grunwald V, Herrmann TR, Burchardt M, Ganser A. 2007. Targeting vascular endothelial growth factor (VEGF)-receptor-signaling in renal cell carcinoma. World J Urol. 25:59–72.
- Rivera LB, Bergers G. 2015. CANCER. Tumor angiogenesis, from foe to friend. Science. 349:694–695.
- Shibuya M, Claesson-Welsh L. 2006. Signal transduction by VEGF receptors in regulation of angiogenesis and lymphangiogenesis. Exp Cell Res. 312:549–560.
- Su CH, He YL, Chen ZG, Lei YY, Zou JY, Zhong FT, Luo HH. 2009. Notch1 expression in esophageal squamous carcinoma and its relationship with the capillaries. J Southern Med Univ. 29:2255–2258.
- Szewezyk NJ, Peterson BK, Jaeobson LA. 2002. Activation of Ras and the mitogen-activated protein kinase pathway promotes protein degradation in muscle cells of Caenorhabditis elegans. Mol Cell Biol. 22:4181–4188.
- Wang J, Zhang Q, Gu LG, Cui W, Xie H, Niu XY. 2008. Effect of hydroxy safflor yellow A on the cell cycle and apoptosis of human umbilical vein endothelial cells with the stimulus of tumor cell conditioned medium. J Beijing Univ Trad Chinese Med. 31:741–744.
- Wang J, Zhang Q, Xie H, Gu LG, Niu XY, Liu LT. 2009. Effect of hydroxy safflor Yellow A on the proliferation of human umbilical vein endothelial cells with the stimulus of tumor cell conditioned medium. CJTCMP. 24:572–575.
- Zarkada G, Heinolainen K, Makinen T, Kubota Y, Alitalo K. 2015. VEGFR3 does not sustain retinal angiogenesis without VEGFR2. Proc Natl Acad Sci USA. 112:761–766.
- Xu J, Liu X, Jiang Y, Chu L, Hao H, Liua Z, Verfaillie C, Zweier J, Gupta K, Liu Z. 2008. MAPK/ERK signalling mediates VEGF-induced bone marrow stem cell differentiation into endothelial cell. J Cell Mol Med. 12:2395–2406.
- Yamaguchi R, Yano H, Nakashima Y, Ogasawara S, Higaki K, Akiba J, Hicklin DJ, Kojiro M. 2000. Expression and localization of vascular endothelial growth factor receptors in human hepatocellular carcinoma and non-HCC tissues. Oncol Rep. 7:725–729.
- Yan B, Huang H. 2015. Perioperative serum and urine of bladder cancer patients HA, bFGF and VEGF change research. China's Clin Res. 3:348–350.
- Yang X, Zhang Y, Hosaka K, Andersson P, Wang J, Tholander F, Cao Z, Morikawa H, Tegnér J, Yang Y. 2015. VEGF-B promotes cancer metastasis through a VEGF-A-independent mechanism and serves as a marker of poor prognosis for cancer patients. Proc Natl Acad Sci USA. 112:2900–2909.
- Zhang Q, Niu X, Yan Y, Jin M, Yang XZ, Li JR. 2004. Research on the mechanism of hydroxysafflor Yellow A in inhibiting angiogenesis. J Beijing Univ Trad Chinese Med. 27:25–29.
- Zhao JF, Xu M, Zhao FZ, Hu PH, Quan Q, Xiang JJ, Wang H. 2015. BFGF expression in malignant tumor and its clinical pathological significance. Chinese J Pathophysiol. 4:590–596.