
Abstract
Context Walnut leaves are highly appreciated for their pharmacological effects and therapeutic properties which are mainly attributed to their high content of phenolic compounds.
Objective This study optimizes ultrasound assisted hydroalcoholic extraction (UAE) of phenolic compounds from dried walnut leaves by the maximization of total phenolics content (TPC) and total flavanoids content (TFC) of the extracts.
Materials and methods Optimal conditions with regard to ethanol concentration (X1: 12.17–95.83% v/v), extraction time (X2: 8.17–91.83 min) and liquid-to-solid ratio (X3: 4.96–25.04 v/w) were identified using central composite design combined with response surface methodology. A high-performance liquid chromatography method with diode-array detection was used to quantify phenolic acids (gallic, vanillic, chlorogenic, caffeic, syringic, p-coumaric, ferulic, sinapic, salicylic, ellagic and trans-cinnamic), flavonoids (catechin, epicatechin, rutin, myricetin and quercetin) and juglone in the extracts.
Results Liquid-to-solid ratio and ethanol concentration proved to be the primary factors affecting the extraction efficiency. The maximum predicted TPC, under the optimized conditions (61% ethanol concentration, 51.28 min extraction time and 4.96 v/w liquid-to-solid ratio) was 10125.4 mg gallic acid equivalents per liter while maximum TFC (2925 mg quercetin equivalents per liter) occurred at 67.83% ethanol concentration, 4.96 v/w liquid-to-solid ratio and 49.37 min extraction time. High significant correlations were found between antioxidant activity and both TPC (R2 = 0.81) and TFC (R2 = 0.78).
Discussion and conclusion Extracts very rich in polyphenols could be obtained from walnut leaves by using UAE, aimed at preparing dietary supplements, nutraceuticals or functional food ingredients.
Introduction
The walnut tree [Juglans regia L. (Juglandaceae)] constitutes a species with great socio-economic importance, found primarily in temperate areas of the world and cultivated in southern Europe, northern Africa, eastern Asia, United States and western South America (Amaral et al. Citation2008). The interest in walnut greatly increased due to the fact that the consumption of their edible seeds has recently been related to health benefits mainly due to their content in unsaturated fatty acids, phytosterols and tocopherols (Banel & Hu Citation2009; Carvalho et al. Citation2010). Furthermore, its non-edible parts such as leaves, green husks, shells, tree bark and wood find applications in cosmetics, pharmaceutical industry, dyes and furniture (Amaral et al. Citation2008).
Walnut leaves have been widely used in folk medicine for the treatment of skin inflammations, venous insufficiency, haemorrhoidal symptomatology, hyperhidrosis and ulcers and for its antidiarrheic, antihelmintic, antiseptic, depurative and astringent properties (Almeida et al. Citation2008; Eidi et al. Citation2013).
Based on these traditional uses and from the wide availability of walnut leaves in abundant amounts, numerous studies have been conducted in recent years related to the content of the leaves in bioactive compounds, their antioxidant and antiseptic properties, in order to justify, at least partially, their therapeutic uses (Pereira et al. Citation2007; Almeida et al. Citation2008; Amaral et al. Citation2008; Carvalho et al. Citation2010; Cosmulescu et al. Citation2014).
Phenolic compounds appear to be responsible for some of the therapeutic properties of walnut leaves due to the pharmacological effects ascribed to them, including antiallergic, antiinflammatory, antiviral, antiproliferative and anticarcinogenic activities (Yao et al. Citation2004). Hydroalcoholic extracts of Juglans regia leaves were shown to be very effective against pro-oxidant species, the scavenging effects being attributed to the phenolic compounds (Almeida et al. Citation2008). In addition to antioxidant activity, several studies demonstrated the antimicrobial activity of walnut products and of their extracts (Pereira et al. Citation2007; Sharma et al. Citation2009). Despite the interesting properties of walnut leaves and of their extracts, the optimal conditions for the extraction of polyphenols are not well investigated.
In addition to classical extraction methods such as heating, boiling or refluxing, in recent years various novel extraction techniques have been developed for the extraction of bioactive compounds from plant materials, including ultrasound-assisted extraction, supercritical fluid extraction, microwave-assisted extraction and accelerated solvent extraction (Wang & Weller Citation2006; Huang et al. Citation2009; Hossain et al. Citation2012). Among these, ultrasound-assisted extraction (UAE) offers a series of advantages such as improved efficiency, reduced extraction time and temperature, low solvent consumption, high reproducibility, simplified manipulation and lower energy input (Tabaraki & Nateghi Citation2011). Moreover, the lack of any chemical involvement in UAE prevents the chemical degradation of target compounds (Zhang et al. Citation2011).
Many reports have been published on the application of ultrasounds for the extraction of secondary metabolites from plants (Huang et al. Citation2009; Zhang et al. Citation2011; Tabaraki & Nateghi Citation2011; Sahin & Samli Citation2013) but there are no reports on UAE of total phenolics and flavonoids from walnut leaves.
Many factors have been determined to influence the extraction efficacy, such as the extraction methods, the solvent type, the solvent concentration, the temperature and the extraction time. Although in previous studies methanol and acetone revealed to be more efficient in extracting phenolic constituents from plant materials (Tabart et al. Citation2007; Tabaraki & Nateghi Citation2011), the increased human use of these compounds makes mandatory the extractions based on non-toxic solvents. In the present study, water/ethanol mixtures were preferred as solvents because they give higher yields of phenolics than the corresponding single-compound solvent systems (Yilmaz & Toledo Citation2006). By varying the water/ethanol ratio, the solvent polarity and, consequently, the solubility of different phenolic compounds can be modified (d'Alessandro et al. Citation2012).
In the present study, the hydroalcoholic ultrasound-assisted extraction of total phenolic compounds and flavonoids from walnut leaves was investigated and the operational parameters such as ethanol concentration, liquid-to-solid ratio and extraction time were optimized using central composite rotatable design combined with response surface methodology (RSM). The antioxidant activity of the extracts was also evaluated by the 1,1-diphenyl-2-picryl-hydrazyl (DPPH) method. The investigation was undertaken with the aim to better exploit this valuable resource.
Materials and methods
Plant tissue
Some previous studies have found that the total phenolic content of the walnut leaves presented seasonal fluctuation and concluded that they should preferentially be collected in July, when the phenolics content is higher (Cosmulescu & Trandafir Citation2011; Jalili & Sadeghzade Citation2012; Cosmulescu et al. Citation2014). Fresh walnut leaves were picked randomly in mid-July from different parts of three walnut trees grown in the experimental field of Banu Maracine Didactical Station of University of Craiova, located in the region of Oltenia, Romania (44°20′ N, 23°49′ E). After collection, the leaves were immediately transferred to the laboratory, removed from the stems, air-dried and stored at ambient temperature in the dark. Before extraction processes, they were ground into powder and sieved using a 1.5 mm nylon sieve.
Reagents and standards
Folin–Ciocalteu reagent (2 N), 6-hydroxy-2,5,7,8-tetramethylchroman-2-carboxylic acid (Trolox), ethanol (>99.5% purity), HPLC grade acetonitrile, acetic acid and methanol were purchased from Merck (Darmstadt, Germany). Gallic acid (99% purity), anhydrous sodium carbonate (99% purity), aluminium nitrate, potassium acetate, quercetin and 2,2-diphenyl-1-picrylhydrazyl (DPPH, 90% purity) were from Sigma-Aldrich (Darmstadt, Germany). Standards of phenolic acids (gallic, vanillic, chlorogenic, caffeic, syringic, p-coumaric, ferulic, sinapic, salicylic, ellagic and trans-cinnamic), flavonoids (catechin, epicatechin, rutin, myricetin and quercetin) and juglone were purchased also from Sigma-Aldrich (Darmstadt, Germany). The water used in experiments was treated in a SG-Water purification system (Merck KGaA, Darmstadt, Germany).
Ultrasound-assisted extraction
The extractions were carried out in a Bandelin Sonorex Digital 10P ultrasound bath (Bandelin Electronic GmbH, Berlin, Germany) operating at 35 kHz with providing power of 480 W.
The walnut leaves dried powder was accurately weighed according to the liquid-to-solid ratio, and put into a glass jar, immersed in 50 mL of hydroalcoholic solution with the appropriate ethanol concentration and sonicated for the predeterminated extraction time (). The temperature was controlled and maintained at 25 °C by periodical replacing water in the bath with cold one. The extracts were filtered through 0.45 μm membrane under vacuum, and afterward, they were put in a screw-capped dark glass container and stored at 4 °C until they were analyzed. Each experiment was conducted three times.
Total phenolics content
The total phenolics content of the extracts was determined according to the Folin–Ciocalteau method by following the procedure of Singleton and Rossi (Citation1965) with some modifications (Cosmulescu & Trandafir Citation2012). Gallic acid was used as the reference standard, and the results were expressed as mg gallic acid equivalent (GAE)/L of extract.
The filtered extracts were diluted with ultrapure water (1:50) at ambient temperature and 1 mL of each diluted extract was shaken for 1 min with 5 mL of Folin–Ciocalteu reagent (diluted 1:10 with ultrapure water). After 2 min, 4 mL of sodium carbonate aqueous solution 7.5% were added and the mixture was shaken again for 0.5 min. The same procedure was applied to the standard solutions of gallic acid. After incubation for 2 h at ambient temperature (approx. 25 °C), the absorbance at 765 nm of each mixture was measured against a methanol blank using an Evolution 600 UV/VIS spectrophotometer (Thermo Scientific, Waltham, MA). Samples were assayed in triplicate and the results were given as mean value ± SD.
Total flavonoids content
The determination of flavonoids was done using the aluminium nitrate colorimetric method described by Mohammadzadeh et al. (Citation2007). Briefly, 0.5 mL of extract was diluted with methanol (1:10) and mixed in a test tube with 0.1 mL of 10% aluminium nitrate, 0.1 mL of 1 M aqueous potassium acetate and 4.3 mL methanol. After keeping it for 40 min at room temperature, the corresponding reagent solutions mixture was used as the blank reference to determine the absorbance of the reaction mixture at 415 nm. Quercetin was used for preparing the standard curve (0–100 mg/L). Samples were assayed in triplicate and the results were expressed as milligrams of quercetin equivalents per litre (mg QE/L).
Antioxidant activity
The free radical scavenging ability of the extracts against DPPH free radical was evaluated spectrophotometrically as described by Cosmulescu and Trandafir (Citation2012). Briefly, 0.5 mL of extract was diluted in methanol (1:10) and each methanol extract (50 μL) was mixed with 3 mL of a 0.004% (v/v) DPPH methanolic solution. After 30 min of reaction at ambient temperature in the dark, the absorbance was measured at 517 nm using Evolution 600 UV/VIS spectrophotometer (Thermo Scientific, Waltham, MA). A blank control of methanol/water mixture was run in each assay. The ability to scavenge the DPPH radical was calculated by using the following formula:
where Absblank is the absorbance of the blank (DPPH solution without sample) and Abssample is the absorbance of the test sample.
The DPPH scavenging activity was subsequently calculated with respect to the 6-hydroxy-2,5,7,8-tetramethylchroman-2-carboxylic acid (Trolox), which was used as a standard reference. The radical was freshly prepared and protected from the light. Samples were prepared in triplicate and the results were expressed in mmol Trolox/L of extract.
Determination of seventeen phenolic compounds in walnut leaves extracts
Phenolics were determined in the extracts made in 79% ethanol at 9.0 v/w liquid-to-solid ratio and sonicated during 25 min. HPLC analyses were performed on a Finningan Surveyor Plus HPLC system (Thermo Electron Corporation, San Jose, CA) according to the method developed by Nour et al. (Citation2013b). Separation was achieved by a reversed-phase Hypersil Gold C18 column (5 μm particle size, 250 × 4.6 mm) provided by Thermo Electron Corporation (San Jose, CA). The mobile phase consisted of 1% aqueous acetic acid solution (A) and methanol (B). Samples were eluted with the following gradient: 90% A from 0 to 27 min, from 90 to 60% A in 28 min, 60% A for 5 min, from 60 to 56% A in 2 min, 56% A for 8 min, from 56 to 90% A in 1 min and 4 min 90% A to re-establish the initial conditions, before the injection of another sample. All gradients were linear. The flow rate was 1 mL/min and the injection volume was 5 μL. Column temperature was maintained at 20 °C. Chromatograms were acquired at three different wavelengths (254, 278 and 300 nm) according to absorption maxima of analyzed compounds. Each compound was identified by its retention time and by spiking with standards under the same conditions. The identities of constituents were also confirmed with a photodiode array (PDA) detector by comparison with ultraviolet (UV) spectra of standards in the wavelength range of 220–450 nm. Each compound was quantified according to the peak area measurements, which were reported in calibration curves of the corresponding standards.
The HPLC method was validated in terms of linearity, limits of detection (LODs), limits of quantification (LOQs), accuracy (recovery) and precision. A series of five mixed standard solutions (S1–S5) including all the 17 analytes with different concentrations were prepared for linearity. Each standard solution was injected in triplicate into the HPLC system and the calibration curves were established by plotting peak areas against the corresponding concentrations for each standard compound. The correlation coefficients were used as the measure of linearity. The LODs and LOQs were calculated based on signal-to-noise ratio method.
The contents of investigated phenolic compounds in the extracts were expressed in mg/L as mean values ± standard deviation.
Experimental design and statistical analysis
The response surface methodology (RSM) was performed using Statgraphics Centurion XVI software (StatPoint Technologies, Warrenton, VA). A 23 full-factorial central composite design was used to fit a second-order polynomial model between the response functions and the process variables, as well as to determine the conditions that optimized the extraction process.
The three independent variables studied which influence the response or dependent variable Y were the ethanol concentration (X1), the extraction time (X2) and the liquid-to-solid ratio (X3). The independent variables were coded according to the following equation:
(1)
where x is the coded value, Xi is the corresponding actual value, X0 is the actual value in the centre of the domain, and ΔX is the increment of Xi corresponding to a variation of 1 unit of x. The coded and actual levels of the independent variables used in our experiment are given in .
Table 1. Independent variables and their coded and actual values used in the central composite rotatable design.
Table 2. Response values (mean ± SD, n = 3) of total phenolics content, total flavonoids content and antioxidant activity for given levels of variables (ethanol concentration, extraction time and liquid-to-solid ratio) in RSM.
Total phenolics content, total flavonoids content and antioxidant activity were chosen as the dependent variables.
The general form of the quadratic polynomial model regression equation employed in this study is presented in the following equation:
(2)
where β0 is the model constant coefficient, βi the linear coefficients, βii are the quadratic coefficients and βij the interaction coefficients of variables i and j.
The adequacy of the model was determined by evaluating the p value for the lack-of-fit test, the coefficient of determination (R2) and the Fisher test value (F-value) obtained from the analysis of variance (ANOVA) that was generated by the software. The statistical significance of the model and model parameters were determined at 95% confidence level.
Three-dimensional response surface plots were generated by keeping one response variable at its optimal level and plotting that against two factors (independent variables). A confirmatory test of optimized operational parameters for ultrasonic-assisted extraction of phenolics from dried walnut leaves was carried out.
Pearson’s correlations were performed to assess the relationships between TPC, TFC and antioxidant activity using Statgraphics Centurion XVI software (StatPoint Technologies, Inc., Warrenton, VA).
Results and discussion
In the present study, the UAE was employed for phenolics-enriched extracts from walnut leaves. Ethanol concentration, liquid-to-solid ratio and extraction time were the operational parameters optimized in the experiment using a 23 full factorial central composite rotatable design combined with response surface methodology. The experimental data of TPC, TFC and antioxidant activity obtained from 17-run-experiment are shown in . The regression coefficients of the predicted quadratic models to the responses and the analysis of variance for these models are given in .
Table 3. Regression coefficients and analysis of variance (ANOVA) of the predicted quadratic model to the responses total phenolics content, total flavonoids content and antioxidant activity.
Total phenolics content
The ANOVA for the quadratic model, based on TPC, revealed that the model was significant, with a p value of the lack-of-fit test of 0.2808 (). The R2 value for the model was 95.84%, which indicated that the model could be used to predict the responses.
According to this model, linear terms of liquid-to-solid ratio and extraction time and quadratic terms of ethanol concentration, liquid-to-solid ratio and extraction time were significant. In contrast, the interaction between operational parameters and the linear term of ethanol concentration were not significant. Of all factors, liquid-to-solid ratio showed the highest effect. The coefficients for ethanol concentration and extraction time were positive whereas those of their quadratic terms were negative. As expected, the liquid-to-solid ratio coefficient was negative, suggesting that the extraction yield of total phenolics is higher at low liquid-to-solid ratio.
The TPC of the extracts made from walnut leaves varied between 2070.98 and 10 408.45 mg GAE/L. The optimal UAE conditions were obtained from response surface analysis as follows: ethanol concentration 61%, extraction time 51.28 min and liquid-to-solid ratio 4.96 v/w. Under these conditions, the experimental TPC (10 518.3 mg/L) was close to the predicted value (10 125.4 mg GAE/L) calculated from the polynomial response surface model equation. Therefore, the model was successful to predict the extraction efficiency of phenolics from walnut leaves by UAE.
In addition, when one factor was kept constant as the optimal value calculated from above central composite rotatable design experiment, the effects of the other two factors on the extraction of phenolics were shown by the contour optimizer plots. The effects of the ethanol concentration (X1) and extraction time (X2) on TPC of the extracts (Y) were reflected in . When X1 was kept constant, e.g., at 61%, with the increase of X2, Y increased gradually, reached the highest value, and then decreased. And when X2 was kept constant, e.g., at 51.28 min, with the increase of X1, Y was gradually mounted up, achieved the highest value, and then decreased gradually.
Figure 1. Response surface plots of total phenolics content (mg GAE/L) at optimum ethanol concentration (% v/v) (a), extraction time (min) (b) and liquid-to-solid ratio (v/w) (c).
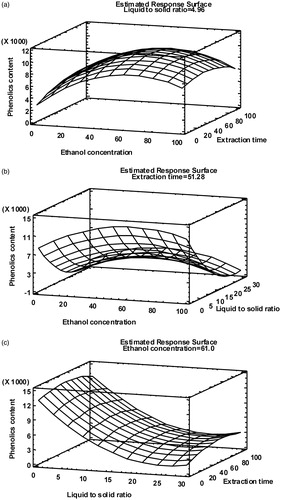
The relationship between Y and the liquid-to-solid ratio (X2) as well as the ethanol concentration (X1) is illustrated in . The contour plot indicated that Y increased correspondingly with the increase of X1, reached the highest level at about 61%, and then decreased after the peak.
The effects of the liquid-to-solid ratio (X2) and extraction time (X3) on the TPC (Y) of the extracts at 61% ethanol concentration are presented in . It can be seen that when the liquid-to-solid ratio was kept constant, with increase of extraction time (from 8.17 to 91.84 min), phenolic content (Y) increased gradually until equilibrium is established in and out of plant cells and then slightly decreased. When X3 was kept constant, with increase of X2, Y decreased gradually. However, the contour gradient in X3 coordinate direction was less than that in X2 coordinate direction, namely X3 was not as significant as X2 in response for Y, as already illustrated by the Pareto chart.
Although the optimum extraction time was established at 51.28 min, the whole experiment showed that the extraction efficiency was quite high after the first 10 min of sonication (at 54% ethanol and 15 v/w liquid-to-solid ratio, more than 80% phenolics were extracted during first 10 min) indicating that a short time is needed for ultrasonic cell walls disruption releasing phenols from the cell constituents of dried walnut leaves.
Maximum phenolic contents of the extracts were obtained at 61% ethanol concentration. This is in accordance with previous results reported for the hydroalcoholic extraction of several classes of polyphenols from various plant tissues, such as anthocyanins from blackcurrants (Nour et al. Citation2013a), or phenolics from olive leaves (Japón-Luján et al. Citation2006; Mylonaki et al. Citation2008), dried sage (Salvia officinalis) (Durling et al. Citation2007), mulberry leaves (Katsube et al. Citation2006) and rice bran (Tabaraki & Nateghi Citation2011).
Total flavonoids content
The ANOVA for TFC determination gave a coefficient of determination (R2) of 93.17%, which indicated a close agreement between experimental and predictive values. In addition, statistical analysis gave high significant level, attesting the goodness of fit of the model in case of flavonoids extraction. The results suggest that the model could work well for the prediction of flavonoids-enriched extract from walnut leaves by ultrasonic-assisted method.
The statistical analysis also showed that both the linear and the quadratic terms of the ethanol concentration and liquid-to-solid ratio for flavonoids-enriched extracts are significant (p < 0.05). The Pareto chart showed that the liquid-to-solid ratio had the most important influence on TFC followed by the ethanol concentration. The coefficients for ethanol concentration and extraction time were positive, indicating that increasing the ethanol level and the extraction time favoured the recovery of TFC. As expected, the coefficient for the liquid-to-solid ratio was negative. These trends were recorded in three-dimensional response surface curves, using the polynomial equations when the third parameter was kept constant at the optimum value ().
Figure 2. Response surface plots of total flavonoids content (mg QE/L) at optimum ethanol concentration (% v/v) (a), extraction time (min) (b) and liquid-to-solid ratio (v/w) (c).
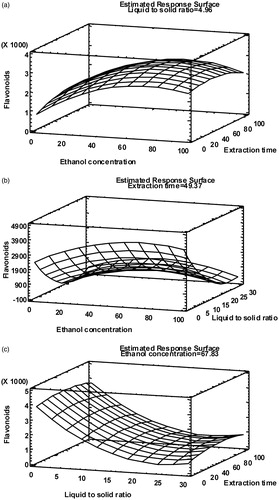
The RSM optimization demonstrated that the optimum treatment conditions for maximizing the TFC values were 67.83% ethanol concentration, 4.96 w/v liquid-to-solid ratio and 49.37 min extraction time. The maximum theoretical flavonoids content was calculated to be 2925 mg QE/L of extract. Yang and Zhang (Citation2008) found 70% aqueous ethanol as optimum for the UAE of rutin and quercetin from [Euonymus alatus (Thunb.) Sieb. (Celastraceae)], while Pan et al. (Citation2012) found 72% ethanol as optimum for the UAE of flavonoids from hawthorn seed.
The plot shown in illustrates the combined effect of the ethanol concentration and the extraction time on TFC. It is obvious that increasing the percentage of ethanol to 60–70% produced an increase in TFC of the extracts, whereas a further increase determined a slow decrease of flavonoids extraction. Regarding the effect of the extraction time, it is apparent that a maximum flavonoids concentration is reached after around 50 min followed by a very slight decrease, probably caused by the decomposition of flavonoids with prolonging the extraction time. A similar decrease of the ultrasonic-extracted flavonoids in hydroalcoholic solvent from Folium eucommiae after extraction time more than 70 min was found by Huang et al. (Citation2009).
Antioxidant activity
DPPH was used to measure the antioxidant activity of phenolic extracts from walnut leaves using Trolox as an antioxidant standard. Although the coefficient of determination (R2= 81.36%) indicated a satisfactory agreement between the observed and predicted responses, the lack-of fit was significant (p < 0.05), which indicated that the model was not adequate to predict the responses within the range of variables studied.
The antioxidant activity presented high significant correlations (p < 0.05) with both TPC (R2 = 0.81) and TFC (R2 = 0.78) of the walnut leaves extracts calculated for all experiments. These results indicated that only about 80% of the radical scavenging activity could be attributed to the phenolic compounds or flavonoids, signifying that other potent antioxidants are also present in the walnut leaves extracts.
Optimization of extraction for all responses
In order to achieve maximum for all responses simultaneously, multiple response optimization was applied and the overall desirability was calculated. Based on this function, the optimal settings of the factors for the hydroalcoholic extraction of walnut leaves were determined: ethanol concentration 62.82%, extraction time 48.75 min and liquid-to-solid ratio 4.96 v/w. At the indicated settings of factors, it is estimated that TPC will be 10 118.7 mg GAE/L, TFC 2916.11 mg QE/L and antioxidant activity 45.88 mmol Trolox/L. This solution was found with an overall desirability of 0.847 (a desirability value of 1 indicates ideal case).
Determination of 17 phenolic compounds in walnut leaves extracts
The regression equation and linearity range for each compound, together with LOD and LOQ values, are shown in . Good response linearity was obtained for all compounds (R2 ≥ 0.9987) in the ranges of standard concentrations analyzed by using the wavelengths of maximum absorption.
Table 4. Parameters of calibration curves, LODs and LOQs for HPLC method validation and content of phenolic compounds in walnut leaves extracts (79% ethanol concentration, 9.0 v/w liquid to solid ratio, 25 min extraction time).
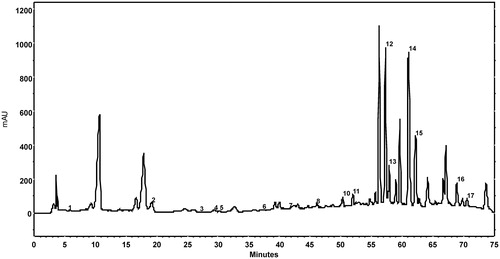
presents a chromatogram of walnut leaf extract made in 79% ethanol, at 9.0 liquid to solid ratio, after 25 min of UAE. The content of individual phenolic compounds of the extract was expressed in mg/100 g DW (dry weight) of walnut leaves as mean value ± standard deviation ().
Figure 3. Chromatogram at λ = 278 nm of an walnut leaves extract (79% ethanol concentration, 9.0 v/w liquid to solid ratio, 25 min extraction time) using 1% aqueous acetic acid solution in mobile phase A, methanol in mobile phase B, and the following gradient: 0–27 min 90% A, 27–55 min 90–60% A, 55–60 min 60% A, 60–62 min 60–56% A, 62–70 min 56% A, 70–71 min 56–90% A and 71–75 min 90% A. Peaks: 1, gallic acid; 2, catechin hydrate; 3, vanillic acid; 4, chlorogenic acid; 5, caffeic acid; 6, syringic acid; 7, epicatechin; 8, p-coumaric acid; 9, ferulic acid; 10, sinapic acid; 11, salicylic acid; 12, rutin; 13, ellagic acid; 14, myricetin; 15, juglone; 16, trans-cinnamic acid; 17, quercetin.
As previously reported by Nour et al. (2013b), ellagic acid was the most abundant phenolic acid in walnut leaves (272.29 mg/100 g DW), while vanillic acid was found in the lowest content (1.69 mg/100 g DW). High contents of ellagic acid were found also in other walnut products. Stampar et al. (Citation2006) reported an ellagic acid content of 98.3 mg/100 g DW in walnut husk while Colaric et al. (Citation2005) found 128.98 mg/100 g DW ellagic acid in walnut pellicle. Some studies suggested that walnut extracts have a high anti-atherogenic potential and a remarkable osteoblastic activity, an effect mediated, at least in part, by its major component ellagic acid. Such findings implicate the beneficial effect of a walnut-enriched diet on cardioprotection and bone loss (Papoutsi et al. Citation2008; Larrosa et al. Citation2010).
The content of chologenic (14.52 mg/100 g DW), ferulic (12.38 mg/100 g) and gallic (2.26 mg/100 g DW) acids found in our study were in agreement with the results of Chrzanowski et al. (Citation2011) who reported 15.3 mg/100 g DW, 29.25 mg/100 g DW and 1.27 mg/100 g DW, respectively, in walnut leaves collected in July. Regarding trans-cinnamic acid, this study found an average content of 23.52 mg/100 g DW, while Chrzanowski et al. (Citation2011) found 8.75 mg/100 g DW in walnut leaves collected in July.
In common walnut (Juglans regia), naphthoquinones and flavonoids are considered as the major phenolic compounds. Among naphthoquinones, juglone (5-hydroxyl-1,4-naphthoquinone) is reported to occur in walnut leaves, husks, annual shoots, roots and wood, being involved into the walnut pathogenic defence mechanism (Aithal et al. Citation2009). Juglone has been gaining importance because of its various pharmacological activities. Increasingly more studies revealed that juglone exerts cytotoxic and genotoxic effects against tumour cells and investigated for its possible application as anticancer agent (Aithal et al. Citation2009).
In fresh walnut leaves, Thakur and Cahalan (Citation2011) found juglone content within the range of 13.1–1556.0 mg/100 g DW on the basis of 1121 trees leaf samples, with an overall mean of 357 mg/100 g DW. Our result (545.61 mg/100 g DW) was comparable with those reported by Gîrzu et al. (Citation1998) who found up to 500 mg/100 g DW juglone in fresh walnut leaves.
Flavonoids have long been recognized to possess anti-inflammatory, antioxidant, antiallergic, hepatoprotective, antithrombotic, antiviral and anticarcinogenic activities (Middleton et al. Citation2000). From the group of flavonoids, myricetin was found in the highest amount (636.64 mg/100 g DW), followed by rutin (291.03 mg/100 g DW) and catechin hydrate (137.06 mg/100 g DW). Myricetin is an important dietary flavonoid, with a potent antioxidant and free-radical scavenging activity. Several studies have demonstrated that myricetin exhibits beneficial effects on bone health (Hsu et al. Citation2007), on renal functions (Ozcan et al. Citation2012) or in the chemoprevention of skin cancer (Kang et al. Citation2011). Extremely high contents of myricetin were found also in walnuts (456.5 mg/100 g FW) by Lugasi et al. (Citation2003).
Rutin has been reported to be a potent scavenger of hydroxyl and superoxide radicals, to have anti-inflammatory and vasoactive properties and to prevent gastric mucosal ulceration in a number of animal models (La Casa et al. Citation2000) while catechin hydrate has been shown to be a strong antioxidant and to exhibit cytostatic properties in many tumour models (Alshatwi Citation2010).
The high content of phenolic acids, flavonoids and juglone could explain, at least in part, the various uses of walnut leaves in traditional medicine and their multiple biochemical and pharmacological actions. Extracts obtained from walnut leaves by using UAE represent a potential source of natural polyphenols and antioxidant compounds and possess significant potential for applications in foods, nutraceuticals, cosmetics and pharmaceuticals.
Conclusions
The ultrasound-assisted hydroalcoholic extraction conditions of total phenolics and total flavonoids from dried walnut leaves were optimized using central composite design combined with response surface methodology. Extracts very rich in antioxidant polyphenols were obtained from walnut leaves by using ultrasound-assisted extraction. They could substitute the synthetic antioxidants and used directly in food and cosmetic industry or additionally purified for pharmaceutical uses.
The obtained models showed that liquid-to-solid ratio and ethanol concentration are the primary factors influencing the performance of extraction assisted by ultrasounds. In the investigated range (8.17–91.83 min), extraction time was less significant in this regard.
Based on multiple response optimization, the optimal settings of the factors for the hydroalcoholic extraction of walnut leaves were 62.82% ethanol concentration, 4.96 v/w liquid-to-solid ratio and 48.75 min extraction.
There was a good correlation between the concentrations of polyphenols in the extracts and the corresponding antioxidant activities. The results of the present study indicated that walnut leaves represent an easily accessible source rich in polyphenols, while ultrasound-assisted extraction has a great potential of industrial development as an efficient and environment-friendly process for the extraction of antioxidant compounds from plant resources.
Disclosure statement
The authors report no conflicts of interest. The authors alone are responsible for the content and writing of this article.
References
- Aithal BK, Kumar MR, Rao BN, Udupa N, Rao BS. 2009. Juglone, a naphthoquinone from walnut, exerts cytotoxic and genotoxic effects against cultured melanoma tumor cells. Cell Biol Int. 33:1039–1049.
- d’Alessandro LG, Karim Kriaa K, Nikov I, Dimitrov K. 2012. Ultrasound assisted extraction of polyphenols from black chokeberry. Sep Purif Technol. 93:42–47.
- Almeida IF, Fernandes E, Lima JLFC, Costa PC, Bahia MF. 2008. Walnut (Juglans regia) leaf extracts are strong scavengers of pro-oxidant reactive species. Food Chem. 106:1014–1020.
- Alshatwi AA. 2010. Catechin hydrate suppresses MCF-7 proliferation through TP53/Caspase-mediated apoptosis. J Exp Clin Cancer Res. 29:167.
- Amaral JS, Valentão P, Andrade PB, Martins RC, Seabra RM. 2008. Do cultivar, geographical location and crop season influence phenolic profile of walnut leaves? Molecules. 13:1321–1332.
- Banel DK, Hu FB. 2009. Effects of walnut consumption on blood lipids and other cardiovascular risk factors: a meta-analysis and systematic review. Am J Clin Nutr. 90:56–63.
- Carvalho M, Ferreira PJ, Mendes VS, Silva R, Pereira JA, Jerónimo C, Silva BM. 2010. Human cancer cell antiproliferative and antioxidant activities of Juglans regia L. Food Chem Toxicol. 48:441–447.
- Chrzanowski G, Leszczynski B, Czerniewicz P, Sytykiewicz H, Matok H, Krzyzanowski R. 2011. Phenolic acids of walnut (Juglans regia L.). Herba Pol. 57:22–29.
- Colaric M, Veberic R, Solar A, Hudina M, Stampar F. 2005. Phenolic acids, syringaldehyde, and juglone in fruits of different cultivars of Juglans regia L. J Agric Food Chem. 53:6390–6396.
- Cosmulescu S, Trandafir I. 2011. Seasonal variation of total phenols in leaves of walnut (Juglans regia L.). J Med Plants Res. 5:4938–4942.
- Cosmulescu S, Trandafir I. 2012. Anti-oxidant activities and total phenolics contents of leaf extracts from 14 cultivars of walnut (Juglans regia L.). J Hortic Sci Biotech. 87:504–508.
- Cosmulescu S, Trandafir I, Nour V. 2014. Seasonal variation of the main individual phenolics and juglone in walnut (Juglans regia) leaves. Pharm Biol. 52:575–580.
- Durling NE, Catchpole OJ, Grey JB, Webby RF, Mitchell KA, Yeap Foo L, Perry NB. 2007. Extraction of phenolics and essential oil from dried sage (Salvia officinalis) using ethanol-water mixtures. Food Chem. 101:1417–1424.
- Eidi A, Moghadam JZ, Mortazavi P, Rezazadeh S, Olamafar S. 2013. Hepatoprotective effects of Juglans regia extract against CCl4-induced oxidative damage in rats. Pharm Biol. 51:558–565.
- Gîrzu M, Fraisse D, Carnat AP, Carnat A, Lamaison J-L. 1998. High performance liquid chromatographic method for the determination of juglone in fresh walnut leaves. J Chromatogr A. 805:315–318.
- Hossain MB, Brunton NP, Patras A, Tiwari B, O'Donnell CP, Martin-Diana AB, Barry-Ryan C. 2012. Optimization of ultrasound assisted extraction of antioxidant compounds from marjoram (Origanum majorana L.) using response surface methodology. Ultrason Sonochem. 19:582–590.
- Hsu YL, Chang JK, Tsai CH, Chang Chien TT, Kuo P-L. 2007. Myricetin induces human osteoblast differentiation through bone morphogenetic protein-2/p38 mitogenactivated protein kinase pathway. Biochem Pharmacol. 73:504–514.
- Huang W, Xue A, Niu H, Jia Z, Wang J. 2009. Optimised ultrasonic-assisted extraction of flavonoids from Folium eucommiae and evaluation of antioxidant activity in multi-test systems in vitro. Food Chem. 114:1147–1154.
- Jalili A, Sadeghzade A. 2012. Comparative phenolic profile of Persian walnut (Juglans regia L.) leaves cultivars grown in Iran. Afr J Biochem Res. 6:33–38.
- Japón-Luján R, Luque-Rodriguez JM, Luquede Castro MD. 2006. Dynamic ultrasound-assisted extraction of oleuropein and related biophenols from olive leaves. J Chromatogr A. 1108:76–82.
- Kang NJ, Jung SK, Lee KW, Lee HJ. 2011. Myricetin is a potent chemopreventive phytochemical in skin carcinogenesis. Ann N Y Acad Sci. 1229:124–132.
- Katsube T, Imawaka N, Kawano Y, Yamazaki Y, Shiwaku K, Yamane Y. 2006. Antioxidant flavonol glycosides in mulberry (Morus alba L.) leaves isolated based on LDL antioxidant activity. Food Chem. 97:25–31.
- La Casa C, Villegas I, Alarcón-de-la-Lastra C, Motilva V, Martín Calero MJ. 2000. Evidence for protective and antioxidant properties of rutin, a natural flavone, against ethanol induced gastric lesions. J Ethnopharmacol. 71:45–53.
- Larrosa M, García-Conesa MT, Espín JC, Tomás-Barberán FA. 2010. Ellagitannins, ellagic acid and vascular health. Mol Aspects Med. 31:513–539.
- Lugasi A, Hóvári J, Sági KV, Bíró L. 2003. The role of antioxidant phytonutrients in the prevention of diseases. Acta Biol Szeg. 47:119–125.
- Middleton E, Kandaswami C, Theoharides TC. 2000. The effects of plant flavonoids on mammalian cells: implications for inflammation, heart disease, and cancer. Pharmacol Rev. 52:673–751.
- Mohammadzadeh S, Sharriatpanahi M, Hamedi M, Amanzadeh Y. 2007. Antioxidant power of Iranian propolis extract. Food Chem. 103:729–733.
- Mylonaki S, Kiassos E, Makris DP, Kefalas P. 2008. Optimisation of the extraction of olive (Olea europaea) leaf phenolics using water/ethanol-based solvent systems and response surface methodology. Anal Bioanal Chem. 392:977–985.
- Nour V, Stampar F, Veberic R, Jakopic J. 2013a. Anthocyanins profile, total phenolics and antioxidant activity of black currant ethanolic extracts as influenced by genotype and ethanol concentration. Food Chem. 141:961–966.
- Nour V, Trandafir I, Cosmulescu S. 2013b. HPLC determination of phenolic acids, flavonoids and juglone in walnut leaves. J Chromatogr Sci. 51:883–890.
- Ozcan F, Ozmen A, Akkaya B, Aliciguzel Y, Aslan M. 2012. Beneficial effect of myricetin on renal functions in streptozotocin-induced diabetes. Clin Exp Med. 12:265–272.
- Pan G, Yu G, Zhu C, Qiao J. 2012. Optimization of ultrasound-assisted extraction (UAE) of flavonoids compounds (FC) from hawthorn seed (HS). Ultrason Sonochem. 19:486–490.
- Papoutsi Z, Kassi E, Chinou I, Halabalaki M, Skaltsounis LA, Moutsatsou P. 2008. Walnut extract (Juglans regia L.) and its component ellagic acid exhibit anti-inflammatory activity in human aorta endothelial cells and osteoblastic activity in the cell line KS483. Br J Nutr J. 99:715–722.
- Pereira JA, Oliveira I, Sousa A, Valentão P, Andrade PB, Ferreira IC, Ferreres F, Bento A, Seabra R, Estevinho L. 2007. Walnut (Juglans regia L.) leaves: phenolic compounds, antibacterial activity and antioxidant potential of different cultivars. Food Chem Toxicol. 45:2287–2295.
- Sahin S, Samli R. 2013. Optimization of olive leaf extract obtained by ultrasound-assisted extraction with response surface methodology. Ultrason Sonochem. 20:595–602.
- Sharma N, Ghosh P, Sharma UK, Sood S, Sinha AK, Gulati A. 2009. Microwave-assisted efficient extraction and stability of juglone in different solvents from Juglans regia: quantification of six phenolic constituents by validated RP-HPLC and evaluation of antimicrobial activity. Anal Lett. 42:2592–2609.
- Singleton VL, Rossi JA. 1965. Colorimetry of total phenolics with phosphomolybdic-phosphotungstic acid reagent. Am J Enol Viticult. 16:144–158.
- Stampar F, Solar A, Hudina M, Veberic R, Colaric M. 2006. Traditional walnut liqueur – cocktail of phenolics. Food Chem. 95:627–631.
- Tabaraki R, Nateghi A. 2011. Optimization of ultrasonic-assisted extraction of natural antioxidants from rice bran using response surface methodology. Ultrason Sonochem. 18:1279–1286.
- Tabart J, Kevers C, Sipel A, Pincemail J, Defraigne J-O, Dommes J. 2007. Optimisation of extraction of phenolics and antioxidants from black currant leaves and buds and of stability during storage. Food Chem. 105:1268–1275.
- Thakur A, Cahalan C. 2011. Geographical variation of Juglans regia L. in juglone content: rapid analysis using micro plate reader. Curr Sci India. 100:1483–1485.
- Wang L, Weller CL. 2006. Recent advances in extraction of nutraceuticals from plants. Trends Food Sci Technol. 17:300–312.
- Yang Y, Zhang F. 2008. Ultrasound-assisted extraction of rutin and quercetin from Euonymus alatus (Thunb.) Sieb. Ultrason Sonochem. 15:308–313.
- Yao LH, Jiang YM, Shi J, Tomás-Barberán FA, Datta N, Singanusong R, Chen SS. 2004. Flavonoids in food and their health benefits. Plant Foods Hum Nutr. 59:113–122.
- Yilmaz Y, Toledo RT. 2006. Oxygen radical absorbance capacities of grape/wine industry byproducts and effect of solvent type on extraction of grape seed polyphenols. J Food Compos Anal. 19:41–44.
- Zhang G, He L, Hu M. 2011. Optimized ultrasonic-assisted extraction of flavonoids from Prunella vulgaris L. and evaluation of antioxidant activities in vitro. Innov Food Sci Emerg. 12:18–25.