
Abstract
Context Linalool (LL) is associated with numerous pharmacological activities. However, its poor solubility usually results in poor bioavailability, and further limited its applications.
Objective To reduce volatilization and improve bioavailability of LL, linalool-loaded nanostructured lipid carriers (LL-NLCs) were prepared.
Materials and methods LL-NLCs were prepared using high-pressure homogenization method and optimized via response surface methodology-central composite design, followed by characterization, including particle size (PS), zeta potential (ZP), transmission electron microscope (TEM), X-ray diffraction (XRD), differential scanning calorimetry (DSC) and in vitro release study. Rats were administered 300 mg × kg − 1 LL with each preparation (LL-NLCs or LL) via oral gavage.
Results LL-NLCs had a PS of 52.72 nm with polydispersity index of 0.172, and ZP of –16.0 mV. The encapsulation efficiency and drug loading gave 79.563 and 7.555%, respectively. The cumulative release of LL from free LL reached 51.414% at 180 min, while LL from LL-NLCs was 15.564%. All the pharmacokinetics parameters of LL-NLCs were better than those of LL, including Cmax (from 1915.45 to 2182.45 ng × mL − 1), AUC0–t (from 76003.40 to 298948.46 ng × min × mL − 1) and relative bioavailability (393.34%). The t1/2, MRT and tmax of LL-NLCs (110.50, 146.66 and 60 min) were also longer than that of LL (44.72, 45.66 and 40 min).
Discussion and conclusion LL-NLCs were for the first time prepared and its oral administration in rats thoroughly investigated. LL-NLCs exhibited sustained release effect and increased absorption of LL. Therefore, these findings might provide a potential possibility for clinical application of LL.
Introduction
Linalool (LL, 3,7-dimethyl-1,6-octadien-3-ol, ) is a naturally occurring terpene alcohol found in spices of plants (such as anise, pepper and fennel) with several commercial applications, mainly in daily chemicals and fragrance flavour, cosmetics and medical industries (Backtorp et al. Citation2006; Scheman et al. Citation2014; Mitropoulou et al. Citation2015). LL is associated with numerous pharmacological activities, such as antitumor (Gu et al. Citation2010; Miyashita & Sadzuka Citation2013), antidepression (Coelho et al. Citation2013; Guzman-Gutierrez et al. Citation2015), antiinflammatory (Li et al. Citation2015; Miraghazadeh et al. Citation2015), analgesia (Peana et al. Citation2003; Batista et al. Citation2008, Citation2010) and antimicrobial action (Jedlickova et al. Citation1992; Park et al. Citation2012). However, as a classic essential oil, poor water solubility of LL, which usually results in poor oral bioavailability could be one of the main factors limiting its wide applications. Simultaneously, the volatility of LL is so high that it is very difficult to prepare a suitable LL formulation and even not to mention the challenges associated with the in vivo studies. These lapses could account for the few reported scientific data on LL in vivo studies. Therefore, it is necessary to explore the formulation and pharmacokinetics of LL, both at in vitro and in vivo levels.
Figure 1. Chemical Structure of linalool.
Recently, nanoparticles as an effective drug delivery system have become known to more researchers due to their competitive advantage of solving problems relating to the solubility and bioavailability of some drug candidates (Ding et al. Citation2015; Hashem et al. Citation2015; Mancarella et al. Citation2015; Ye et al. Citation2015). The nanoparticle is a dispersion system with particle size (PS) ranging from 10 to 1000 nm, usually from 20 to 200 nm (Horn & Rieger Citation2001). This particulate system possesses some targeting effect, particularly in the liver (Bakalova et al. Citation2015; Jyothi et al. Citation2015; Wang et al. Citation2015). Solid lipid nanoparticles (SLN), the first generation lipid nanoparticles, consisted of oleic phase (solid lipid), aqueous phase and surfactants. SLN reveals the combined advantages of conventional drug delivery systems (liposomes and sustained release preparations), such as high targeting effect, low potential toxicity and the general requirements of drugs (Ranpise et al. Citation2014). The SLN cannot only control the release of drugs and their targeting properties (Dharmala et al. Citation2008; Guo et al. Citation2011), but also decrease the potential toxicity of drugs or carrier systems (Yang et al. Citation1999; Xue et al. Citation2012). Notwithstanding these clear benefits, the SLN could also be plague with lower drug loading, less stability and burst effect (Ranpise et al. Citation2014).
Nanostructured lipid carriers (NLCs) are prepared using oleic phase (solid and liquid lipids), aqueous phase and surfactants. As second generation lipid nanoparticles, NLCs present a great gain as compared to the SLN. Thus, apart from the controlled release and targeting effect, NLCs can still encapsulate both hydrophilic and hydrophobic drug with high loading capacity and stability, as well as improved bioavailability (Gu et al. Citation2011; Puglia et al. Citation2011; Sharma et al. Citation2011; Liu et al. Citation2013; Ranpise et al. Citation2014).
There are different ways of preparing NLCs, such as microemulsion (Pradhan et al. Citation2015), melt emulsification (Liu et al. Citation2013), solvent evaporation (Ranpise et al. Citation2014) and ultrasonic dispersion method (Lin et al. Citation2014). However, most of these methods lack the capacity for industrial production, and also sometimes linked to the problem of solvent residue. Employing high-pressure homogenization is an effective means of homogenizing various samples with several benefits like smaller nanoparticle size and narrow PS distribution, absence of organic solvent pollution and easy application of the method (Shi et al. Citation2013; Vitorino et al. Citation2014). Consequently, this method could be appropriate for large scale industrial production (Muller et al. Citation2011). The purpose of this study was therefore to prepare and characterize the linalool-loaded NLCs (LL-NLCs). Then in vitro release profile and in vivo pharmacokinetics were also investigated to support the use of this novel nanoparticle for future clinical applications.
Materials and methods
Chemicals and reagents
LL (98%) was purchased from J&K Scientific Ltd. (Beijing, China). Decanoyl/octanoyl-glycerides (MCT) was purchased from Shanghai Youchuang Industrial (Shanghai, China). Glycerin monostearate (GMS), span 80 and Tween 80 were purchased from Sinopharm Chemical Reagent Co., Ltd (Shanghai, China). Methanol (HPLC grade) was purchased from Jiangsu Hanbon Sci. & Tech. Co., Ltd (Jiangsu, China). Acetonitrile (HPLC grade) was purchased from Honeywell Burdick & Jackson (Muskegon, MI). All other chemicals and solvents were of analytical grade and were used as provided. Deionized water was used throughout the study, and it was produced by a Millipore water purification system (Millipore Corporation, Bedford, MA).
Experimental animals
Healthy male Sprague-Dawley rats (weight 300 ± 20 g) were obtained from Laboratory Animal Center of Jiangsu University (Jiangsu, China). The rats were fed with standard food pellets and maintained under standard laboratory conditions with a dark/light cycle of 12 h. All rats were fasted overnight before the experiments, but allowed access to water ad libitum. The use and care protocols of rats were reviewed and approved by the Ethic Committee of Jiangsu University.
Preparation of linalool-loaded nanostructured lipid carriers (LL-NLCs)
LL-NLCs were prepared by hot high-pressure homogenization (HPH) technology. In this method, GMS was used as solid lipid and MCT as liquid lipid. Span 80, GMS and MCT were uniformly melted in water bath at 78 °C, followed by the addition of LL (lipid: LL = 5.5:1). These four materials were thoroughly mixed together to form oleic phase. The aqueous phase, Tween 80 solution, was also prepared at the same temperature. Then the aqueous phase was gently poured into the organic phase at 78 °C with continuous stirring. After that the resulting pre-emulsion was homogenized using a homogenizer system (APV-2000, APV, Germany) with conditions of 1200 bar and cycle numbers of seven. The formulated LL-NLCs were solidified with ice-bath as soon as possible, to ensure that the PS was kept small and stable.
Determination of encapsulation efficiency, drug loading, particle size and zeta potential
Encapsulation efficiency and drug loading
The encapsulation efficiency (EE) and drug loading (DL) of the LL-NLCs formulation was calculated indirectly by determining the total and free drug in the dispersion medium using ultrafiltration method. Briefly, 100 μL LL-NLCs was diluted in 10 mL methanol, and the solution centrifuged at 10,000 rpm for 10 min. Then the supernatant was injected into HPLC system to determine the concentration of total drug. Next, 2 mL LL-NLCs was centrifuged at 4500 rpm for 30 min using centrifugal filter device (Amicon Ultra-15 10K; Millipore Corporation, Darmstadt, Germany), and 100 μL of the filtrate diluted in 10 mL methanol, with further HPLC analysis. The HPLC apparatus included a pump (LC-20AT; Shimadzu), an UV detector (SPD-20A; Shimadzu) and a Symmetric C18 column (5 μm, 4.6 × 150 mm) at a detection wavelength of 210 nm at 50 °C, and the injection volume was 20 μL. The mobile phase consisted of acetonitrile-water (47:53) at a flow rate of 1.0 mL × min − 1. The EE and DL were calculated according to the following equations:
(1)
(2)
where WT, WF and WO were the weight of total drug, free drug and other materials (lipids and surfactants) in LL-NLCs.
Particle size and zeta potential
In this study, the PS was evaluated by mean diameter, using an apparatus (Nano ZS90 Zetasizer, Malvern Instruments Ltd; Worcestershire, UK), as well as the determination of polydispersity index (PDI) and zeta potential (ZP) of LL-NLCs. Before the measurements of PS and PDI, all samples were appropriately diluted with water. The ZPs of the samples were directly measured without dilution.
Experimental design
Usually, the desired results could be obtained with fewer experiments using response surface methodology than the orthogonal design (Bas & Boyaci Citation2007). Therefore, the formulation was optimized via response surface methodology-central composite design (RSM-CCD) using a statistical software (Design-Expert, Version 8.0.6, Stat-Ease, Inc., Minneapolis, MN). In this study, four parameters each of five levels led to 30 experimental treatments (). The independent factors were the percent of GMS (X1, 1–5.5%, w/w), MCT (X2, 1–5.5%, w/w), span 80 (X3, 1–4%, w/w) and Tween 80 (X4, 1–4%, w/w) in the formulation, respectively. Because the PS was the most important and influential factor of the NLCs formulation, the responses were evaluated using PS (Y, nm). The centre points (X1 = 4%, X2 = 4%, X3 = 3% and X4 = 3%) were repeated six times and the experimental orders were randomized to minimize the influence of unexpected variability from irrelevant factors in the actual operations.
Table 1. Central composite design (CCD) matrix of four independent variables and the experimental results.
Characterization of LL-NLCs
Particle size and zeta potential
The optimized formulation of LL-NLCs was analysed using the Nano ZS90 Zetasizer to provide the following data: PS, PDI and ZP.
Transmission electron microscope (TEM)
The morphology of LL-NLCs was examined using a transmission scanning microscope (TEM; JEM-2100 (HR), Jeol, Tokyo, Japan). The samples were appropriately diluted with water, followed by putting it on a film-coated copper grid. Then the films were stained with 1% phosphotungstic acid and allowed to dry before observation.
X-ray diffraction (XRD)
Prior to scanning, the LL-NLCs dispersion was lyophilized using a freeze dryer (FreeZone 6 plus, Bulk Tray Dryer; Labconco Corporation, Missouri, USA). XRD analysis of the samples (GMS) and LL-NLCs freeze-dried powder were performed using the X-ray diffractometer (D8 ADVANCE, Bruker Corporation, Germany), which employed a Cu-Kα radiation as X-ray source. Briefly, the samples were scanned from 5° to 60° at a scanning rate of 2° × min − 1, and the XRD curves recorded.
Differential scanning calorimetry (DSC)
The LL-NLCs dispersion was lyophilized using the freeze dryer, followed by the DSC analysis. Solid lipid (GMS) and LL-NLCs power were analysed using DSC (STA 449 C, Netzsch, Germany). Samples were kept in standard aluminium pans and sealed. The DSC curves were determined using a heating rate of 5 °C × min − 1 at a temperature range of 20–270 °C in a nitrogen environment. An empty, sealed pan was used as a reference.
In vitro release study
The in vitro release studies were performed using dialysis bag technique in deionized water (pH 6.5). Before the experiment, the cellulose dialysis bags (Mw = 3.5 kDa, Beijing Genia Biotechnology Co., Ltd, China) were activated and soaked in release media overnight. The LL-NLCs dispersion (1 mL) was put in the dialysis bag and tied at both ends. It was then immersed in a breaker (containing 150 mL of release medium) and shaken using a thermostatically controlled shaker at 100 strokes × min − 1, which was maintained at 37 °C for 3 h. The same content of LL was also added directly to another dialysis bag, with 1 mL deionized water as control. Then the dialysis bags were treated under the same conditions as stated above. Samples, 1 mL each from the release medium, were withdrawn at predetermined time points (5, 10, 15, 20, 30, 40, 50, 60, 120 and 180 min) and replenished with equal volume of fresh medium (deionized water). The LL concentrations in the samples were analysed using HPLC.
Stability test of LL-NLCs
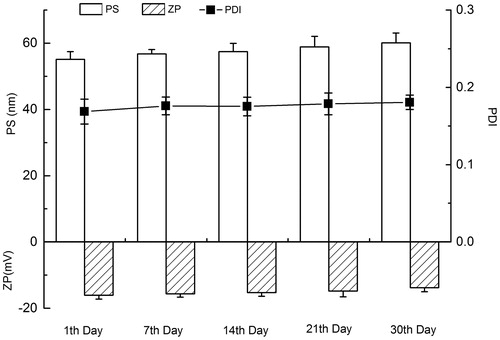
The stability of LL-NLCs was tested at room temperature (25 °C) for 1 month. PS, PDI and ZP were evaluated as the indexes for the stability test. All the indexes were determinate on the 1st, the 7th, the 14th, 21th and the 30th day after the preparation of LL-NLCs. The appearance of LL-NLCs was also observed during the storage period.
In vivo pharmacokinetic study
Intragastric administration
Male Sprague-Dawley rats (weight 300 ± 20 g) were randomly divided into two groups each of six animals. The preparations included LL-NLCs dispersion and LL-suspension. The LL-NLCs dispersion was prepared as described in Section of Preparation of linalool-loaded nanostructured lipid carriers (LL-NLCs), whereas the LL-suspension was prepared by dispersing LL in 0.5% (w/v) sodium carboxymethyl cellulose (CMC-Na) solution. The rats were administered 300 mg × kg − 1 LL with each preparation via oral gavage. After oral administration, the blood samples (0.6 mL) were collected at the desired times (5, 10, 15, 20, 30, 40, 50, 60, 120, 180, 240, 300, 360 and 480 min) into heparinized centrifuge tubes and immediately centrifuged at 12000 rpm for 10 min. Plasma was kept at –20 °C until further analysis.
Treatment of plasma sample
An aliquot of plasma (200 μL) was mixed with 20 μL nifedipine (5 μg × mL − 1; internal standard, IS) and 400 μL of acetonitrile by vortexing for 3 min. Following centrifugation at 13,000 rpm for 15 min, 20 μL of the supernatant was injected into the HPLC system for analysis.
HPLC system analysis
The HPLC apparatus included a pump (LC-10ADVP; Shimadzu), an UV detector (SPD-20A; Shimadzu) and a Symmetric C18 column (5 μm, 4.6 × 150 mm) at a detection wavelength of 210 nm at 30 °C, and the injection volume was 20 μL. The mobile phase consisted of acetonitrile-water (47:53) at a flow rate of 1.0 mL × min − 1.
Data analysis
Pharmacokinetic parameters for LL in rats were calculated by using BAPP 2.3 pharmacokinetic software package (supplied by the Center of Drug Metabolism and Pharmacokinetics, China Pharmaceutical University).
Results
Model fitting and optimization
The central composite design (CCD) matrix of the four independent variables reflected the effects of GMS (X1), MCT (X2), span 80 (X3) and Tween 80 (X4) contents (%, w/w) on the PS (Y, nm) of LL-NLCs (). The PS ranged from 52.97 to 135.6 nm with the best results emerging from the formulation consisting of 2.5% GMS, 5.5% MCT, 2.0% span 80 and 4.0% Tween 80. The RSM fitting model was used to determine the empirical relationship be Tween the PS of LL-NLCs and the four independent factors, as well as the second order polynomial as given below:
(3)
where X1, X2, X3 and X4 represent contents (%, w/w) of GMS, MCT, span 80 and Tween 80, respectively.
The p values are indicators of the significance of the coefficients (Pourfarzad et al. Citation2014), hence the smaller the p value, the greater the significance of the associated indices. As shown in , 95% confidence level was selected, which means that if the p value was lower than 5%, then the associated factors had significant effect on the PS (Y). It is therefore obvious that the factors with significant effect on PS were the linear terms (X1-GMS, X3-span 80 and X4-Tween 80), followed by the interactive terms (X1X3 and X1X4) and the squared terms (X42), which were also significant (p < 0.0001 or 0.05), . However, the other terms (X2-MCT, X1X2, X2X3, X2X4, X3X4, X12, X22, and X32) were not significant.
Table 2. ANOVA of the response surface model with 95% confidence level.
Consequently, a simplified regression equation model was obtained after eliminating all the non-significant terms:
(4)
where X1, X3 and X4 represent contents (%, w/w) of GMS, span 80 and Tween 80, respectively.
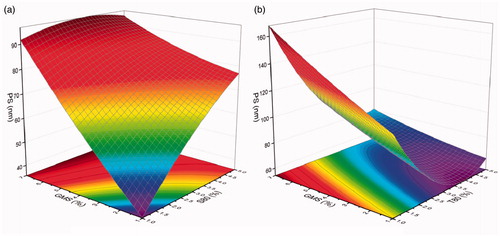
In investigating the interactive effects of the different factors on PS, three-dimensional (3D) response surface plots were employed to visually describe the changes in response value by plotting the response on the Z-axis as against two independent variables, while the other factors were set as centre point values (). It was obvious that the PS increased with increasing content of GMS (1.0–7.0%) in both . Similarly, the PS also increased with increasing content of span 80 (1.0–5.0%) when the content of GMS was less than 5.5%, while the PS was initially increased and then decreased with increasing span 80 when the GMS was more than 5.5%, . The highest PS was found around the point of 3.5% span 80 and 7.0% GMS. Regarding the interactive effect of GMS and Tween 80 [], it could be clearly seen that irrespective of the content of GMS in the formulation, the changes in PS witnessed the same trend. Thus, there was an initial decrease and subsequent increase with increasing content of Tween 80 (1.0–5.0%). The smallest PS was found around the point of 4.0% Tween 80 and 1.0% GMS.
Figure 2. Three-dimensional (3D) response surfaces of two interaction effects on particle size (PS).
Characterization of LL-NL
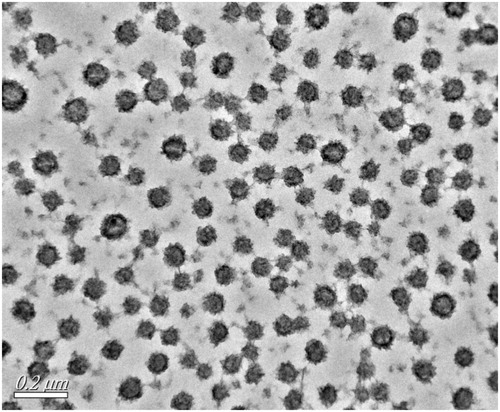
The PS of the prepared optimized LL-NLCs formulation gave 52.72 nm with PDI of 0.172 (), and the ZP of LL-NLCs was –16.0 mV (). The transmission electron microscope (TEM) imaging of LL-NLCs revealed spherical shape with uniform PS distribution. There were also no obvious particle aggregations in the TEM imaging ().
Figure 3. Particle size distribution of LL-NLCs.
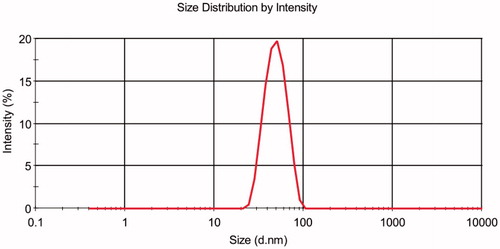
Figure 4. Zeta potential distribution of LL-NLCs.
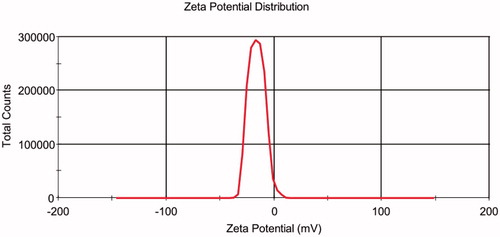
Figure 5. Transmission electron microscope (TEM) image of LL-NLCs.
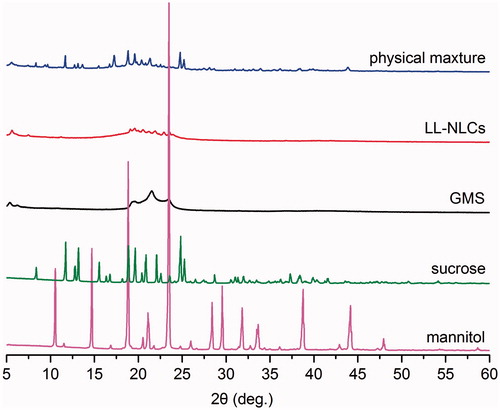
In addition to the PS, ZP and morphology, crystallography and calorimetry are also important to the characterization of LL-NLCs. Therefore, the X-ray diffraction (XRD) and differential scanning calorimetry (DSC) were carried out in this study. The XRD data on the five different samples (mannitol, sucrose, glycerin monostearate (GMS), LL-NLCs and mixture of LL-NLCs/20% mannitol/20% sucrose) were analysed (). There were several diffraction peaks associated with the diffraction pattern of mannitol and sucrose. Some of these peaks of the two samples even appeared at the same degree. Regarding GMS, its diffraction peaks were mainly found around the 2θ values of 5.5°, 19.5°, 22.0° and 23.0°. However, the four characteristic diffraction peaks of GMS disappeared in the diffraction pattern of LL-NLCs and the physical mixture of LL-NLCs/20% mannitol/20% sucrose. The observation was highly evident in LL-NLCs, which resulted in amorphous forms instead of the usual diffraction peaks. This indicated that GMS was in an irregular order as compared to the crystalline structure in LL-NLCs. The pattern of LL-NLCs/20% mannitol/20% sucrose showed only superposed diffraction peaks of cryoprotectants (mannitol and sucrose) with low intensity on the foundation of amorphous forms from LL-NLCs.
Figure 6. X-ray diffraction (XRD) images of mannitol, sucrose, glycerin monostearate (GMS), LL-NLCs and physical mixture of LL-NLCs/20% mannitol/20% sucrose.
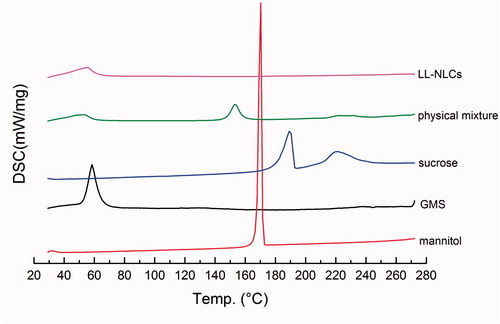
The changes in morphology can be detected using calorimetry via DSC monitoring (Liu et al. Citation2012). Based on the DSC-thermogram analysis (), it can be seen that the mannitol had an endothermic peak with high intensity around 166 °C, exactly as the same melting point of mannitol. Similar trend was witnessed in GMS (60 °C) and sucrose (186 °C). Another endothermic peak (appearing around 220 °C) with a wide width in relation to the sucrose DSC-thermogram may be due to the caramelization. But the characteristic endothermic peak of GMS disappeared in the DSC-thermogram of LL-NLCs. There were also peaks in the cryoprotectants (mannitol and sucrose) with lower intensity in the thermogram of the physical mixture of LL-NLCs/20% mannitol/20% sucrose.
Figure 7. Differential scanning calorimetry (DSC) thermograms of mannitol, sucrose, GMS, LL-NLCs and physical mixture of LL-NLCs/20% mannitol/20% sucrose.
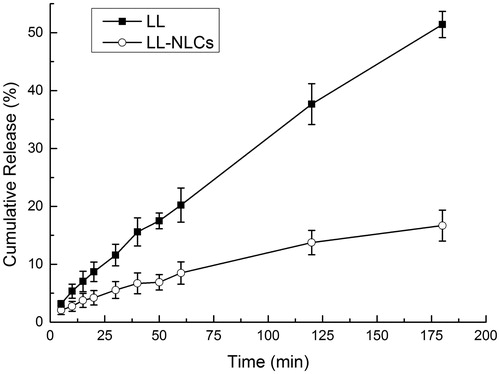
The cumulative release of LL from free drug was higher than that of LL-NLCs over the entire period, . As can be seen, when the cumulative release of LL from free LL reached 51.414% at 180 min, the release rate of LL from LL-NLCs was only 15.564% at the same time. It can also be seen that there was nearly no phenomenon of burst release during the release process of LL-NLCs.
Figure 8. Dissolution curves of LL from free LL and LL-NLCs.
After storage at room temperature (25 °C) for a month, LL-NLCs showed no obvious change in the appearance and phase separation as compared with day one. However, the evaluated indexes [PS, polydispersity index (PDI) and ZP] of LL-NLCs in the stability test changed with time (), and the maximum percentage increase in PS and PDI, or decrease in ZP, was lower than 13.94%. The mean PS of LL-NLCs was also increased over the 30 d (p < 0.05), but the size was still maintained within the initial range of 50–65 nm. The PDI of LL-NLCs exhibited the same changing trend as in the particle size, with an increase from 0.168 to 0.190 (p < 0.05) during the storage period. There was also a slight decrease in the absolute value of ZP (negative) within the range of 12.60–17.25.
Figure 9. Time-dependent changes of LL-NLCs in the stability test (25 °C).
In vivo pharmacokinetics study
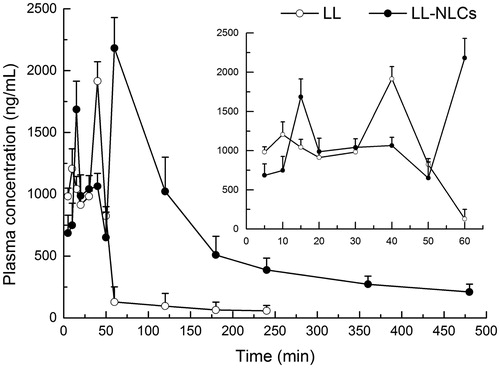
The drug concentration in plasma could be detected at 480 min after the oral administration of LL-NLCs, but the concentration of LL from LL-suspension could not be detected after 240 min (). These results implied that the NLCs had sustained release properties. The partially enlarged graph of presented the changes in drug concentration of plasma in the first 60 min. It is clear that there were two drug concentration peaks in the LL-suspension profile. The first peak was minor and it appeared around 10 min, with the second major peak occurring at approximately 40 min, and subsequently the drug concentration in the plasma decreasing rapidly. Conversely, three peaks were observed in the profile of LL-NLCs. The first one appeared around 15 min and it was higher than that of LL-suspension, which might be the sustained release peak appeared in LL-suspension at 10 min. The middle one appeared around 40 min and it was lower than the peak of LL-suspension, which occurred at the same time. The reason could be due to the fact that the unencapsulated drug was absorbed and distributed in the plasma in the same way as free LL. The last major peak (greater than LL-suspension) appeared around 60 min, which indicated that the encapsulated drug was released in vivo and distributed in the plasma.
Figure 10. Drug concentration-time curve in plasma of LL after intragastric administration (n = 6).
Relative bioavailability (Fr) is the most important parameter to evaluate the efficacy of a preparation (Zhang et al. Citation2015). Therefore, the relative bioavailability was calculated in this study using the equation below:
(5)
Where T means tested preparation (LL-suspension), and R means reference preparation (LL-NLCs).
The t1/2, MRT and tmax of LL-NLCs (110.50 min, 146.66 min and 60 min) were longer than that of LL-suspension (44.72 min, 45.66 min and 40 min), . The Cmax of LL-NLCs (2182.45 ng × mL − 1) was also higher than that of free drug (1915.45 ng × mL − 1). The AUC0–t of LL-NLCs and free LL were 298948.46 ng × min × mL − 1 and 76003.40 ng × min × mL − 1, respectively. Therefore, the relative bioavailability of LL-NLCs was 393.34% as compared with the free LL.
Table 3. Pharmacokinetic parameters of LL after intragastric administration in rats (mean, n = 6).
Discussion
The fitting model had p value < 0.0001 and a correlation coefficient (R2) of 0.976, which supported its very high precision and applicability (). The high R2 value also implies that the model could explain 97.6% of the variation in the PS of LL-NLCs, while the low value of coefficient of variation (CV = 2.16%,<10%) indicated a high degree of reliability of experimental values (Firatligil-Durmus & Evranuz Citation2010; Guo et al. Citation2012). The non-significant lack of fit further confirmed this assertion (Abdollahi et al. Citation2012). These results also revealed that the model could appropriately describe the response values, and more importantly predict the optimized formulation.
In the regression equation, the positive coefficients of GMS and span 80 indicated that their increasing trend could increase the PS of the formulation; however, the negative coefficients of Tween 80 could bring about reduction in the particle the size (Pornaroonthama et al. Citation2015). As shown in Equationequation (4)(4) , the absolute coefficients of the linear terms (X1, X3 and X4) were much greater than that of the others (X1X3, X1X4 and X42). Therefore, the effects of independent variables on the PS were higher than the interactive factors.
These findings in supported the earlier assertion that solid lipid content in the formulation possesses positive influence on the nanoparticles size, and also indicated that there could be a perfect match ratio among GMS, span 80 and Tween 80 in producing a stable formulation and a smaller particle size.
Finally, the optimized data as generated by the software gave 2.5% GMS, 2.5% MCT, 2.0% span 80 and 4.0% Tween 80, with a predicted PS of 50.599 nm. After the optimization, the LL-NLCs were prepared and the EE (79.563%) and DL (7.555%) determined. The characterized values were higher than those previously reported on essential oil-loaded nanoparticles (Bilia et al. Citation2014; Piryaei et al. Citation2015).
The results of particle size, PDI and TEM imaging of LL-NLCs demonstrated the narrow size distribution or homogeneous PS of LL-NLCs. ZP usually has direct relationship with the storage stability of solid nanoparticles (Rahaiee et al. Citation2015). It is therefore necessary to measure the ZP of LL-NLCs, which in this study showed the presence of negative charges on the surface of the nanoparticles. In addition, the bias isTween the predicted result (50.599 nm) of the model and the actual observed PS was also 4.02% (<5.00%). The data clearly indicated that the employed model for the optimization was appropriate, and the optimized LL-NLCs formulation was also good and acceptable.
The entire findings of XRD () indicated that the perfect crystal structure of GMS was changed by NLCs preparation. The different crystallinity of GMS and LL-NLCs supported the fact that a new less-ordered phase was formed in NLCs formulation. Thus, the LL-NLCs were successfully prepared in this study.
Additionally, the results of DSC () indicated that the GMS molecules could exist as a modified structure instead of the normal crystallization morphology in LL-NLCs (Lin et al. Citation2014). Again, these findings further confirmed the data obtained from XRD, which supported the successful preparation of LL-NLCs.
In this study, the dissolution curves were only observed in the release of LL from free drug and LL-NLCs within 180 min instead of the expected longer time witnessed in the preliminary studies. In the pre-experimental studies, the release time was prolonged to 24 h (the time points were 5, 10, 15, 20, 30, 40, 50, 60, 120, 180, 240, 360, 480, 600, 720 and 1440 min), however, the results in this study were not very encouraging. The main reason could be due to the physiochemical properties of LL, particularly the volatility. Thus, the cumulative release of LL from free drug was increase at different rates before 180 min. But, there was an unexpected decrease in release rate after 240 min, which indicated that the cumulative release at this time point was lower than the previous one (180 min). Though there were further cumulative release increased beyond 360 min, the reliability and credibility of release curve was very low. Therefore, the end point was set at 180 min. The results of in vitro release study also supported the fact that NLCs could serve as a sustained release carrier for drugs.
The stability test demonstrated that LL-NLCs could be stored for at least 30 d with acceptable physical stability under room temperature as reported in other related studies (Zhu et al. Citation2014, Citation2015; Yang et al. Citation2015). The stability of LL-NLCs might be explained by the small particle size, which can decrease the gravity force greatly (Tavacoli et al. Citation2012). The Brownian diffusion might also contribute to the stability because it can prevent sedimentation and creaming of particles.
The purpose of this study was to prepare a NLCs formulation for an improved bioavailability of LL. Therefore, the verification study of in vivo pharmacokinetics was necessary. The t1/2, MRT, and tmax of LL-NLCs were longer than that of free LL, which certified the fact again that LL-NLCs indeed possesses sustained release effect in vivo. All the results of in vivo pharmacokinetic study () demonstrated that LL-NLCs significantly improved the absorption and bioavailability of LL. Furthermore, the LL-NLCs were prepared using HPH method, which was appropriate for large scale industrial production. The most significant advantage of this method was the products possess controllable quality, no matter for shape or PS distribution. In addition, NLCs could be produced with easy operation and without organic solvent pollution.
Conclusion
This study for the first time developed LL-NLCs using HPH technology, which can produce nanoparticles with controllable quality. The LL-NLCs were spherical in shape without aggregations, as well as the presence of narrow PS distribution. Both in vitro and in vivo results indicated that LL-NLCs possessed sustained release effect. Pharmacokinetic parameters of LL-NLCs exhibited higher bioavailability than free drug. These findings could therefore provide significant information on the possible clinical use of LL.
Funding statement
This work was supported by the National Natural Science Foundation of China (30973677), National “Twelfth Five-Year” Plan for Science & Technology Support (2012BAD36B01), China Postdoctoral Science Foundation (2014M551523), the Doctoral Fund of Ministry of Education of China (20113227110012), Scientific Research Foundation of Jiangsu University (14JDG165).
Acknowledgements
The authors thank the Jiangsu University Ethics Committee for the kind guidance in the animal experiments.
Disclosure statement
The authors report no declarations of interest.
References
- Abdollahi Y, Zakaria A, Abdullah AH, Fard Masoumi HR, Jahangirian H, Shameli K, Rezayi M, Banerjee S, Abdollahi T. 2012. Semi-empirical study of ortho-cresol photo degradation in manganese-doped zinc oxide nanoparticles suspensions. Chem Cent J. 6:88.
- Backtorp C, Wass JRTJ, Panas I, Skold M, Borje A, Nyman G. 2006. Theoretical investigation of linalool oxidation. J Phys Chem A. 110:12204–12212.
- Bakalova R, Lazarova D, Nikolova B, Atanasova S, Zlateva G, Zhelev Z, Aoki I. 2015. Delivery of size-controlled long-circulating polymersomes in solid tumours, visualized by quantum dots and optical imaging in vivo. Biotechnol Biotechnol Equip. 29:175–180.
- Bas D, Boyaci IH. 2007. Modeling and optimization I: usability of response surface methodology. J Food Eng. 78:836–845.
- Batista PA, Werner MF, Oliveira EC, Burgos L, Pereira P, Brum LF, Santos AR. 2008. Evidence for the involvement of ionotropic glutamatergic receptors on the antinociceptive effect of (-)-linalool in mice. Neurosci Lett. 440:299–303.
- Batista PA, Werner MF, Oliveira EC, Burgos L, Pereira P, Brum LF, Story GM, Santos AR. 2010. The antinociceptive effect of (-)-linalool in models of chronic inflammatory and neuropathic hypersensitivity in mice. J Pain. 11:1222–1229.
- Bilia AR, Guccione C, Isacchi B, Righeschi C, Firenzuoli F, Bergonzi MC. 2014. Essential oils loaded in nanosystems: a developing strategy for a successful therapeutic approach. Evid Based Complement Alternat Med. 2014: Article ID 651593.
- Coelho V, Mazzardo-Martins L, Martins DF, Santos AR, da Silva Brum LF, Picada JN, Pereira P. 2013. Neurobehavioral and genotoxic evaluation of (-)-linalool in mice. J Nat Med. 67:876–880.
- Dharmala K, Yoo JW, Lee CH. 2008. Development of chitosan-SLN microparticles for chemotherapy: in vitro approach through efflux-transporter modulation. J Control Release. 131:190–197.
- Ding Y, Qiao Y, Wang M, Zhang H, Li L, Zhang Y, Ge J, Song Y, Li Y, Wen A. 2015. Enhanced neuroprotection of acetyl-11-keto-beta-boswellic acid (AKBA)-loaded O-carboxymethyl chitosan nanoparticles through antioxidant and anti-inflammatory pathways. Mol Neurobiol. p. 1–12; [cited 2015 Jul 11]. Available from: http://link.springer.com/article/10.1007%2Fs12035-015-9333-9.
- Firatligil-Durmus E, Evranuz O. 2010. Response surface methodology for protein extraction optimization of red pepper seed (Capsicum frutescens). LWT – Food Sci Technol. 43:226–231.
- Gu X, Zhang W, Liu J, Shaw JP, Shen Y, Xu Y, Lu H, Wu Z. 2011. Preparation and characterization of a lovastatin-loaded protein-free nanostructured lipid carrier resembling high-density lipoprotein and evaluation of its targeting to foam cells. AAPS PharmSciTech. 12:1200–1208.
- Gu Y, Ting Z, Qiu X, Zhang XZ, Gan XX, Fang YM, Xu XH, Xu RZ. 2010. Linalool preferentially induces robust apoptosis of a variety of leukemia cells via upregulating p53 and cyclin-dependent kinase inhibitors. Toxicology. 268:19–24.
- Guo WL, Li HL, Ji GL, Zhang GY. 2012. Ultrasound-assisted production of biodiesel from soybean oil using Brønsted acidic ionic liquid as catalyst. acidic liquid catalyst. Bioresour Technol. 125:332–334.
- Guo XH, Cui FD, Xing YB, Mei Q, Zhang ZZ. 2011. Investigation of a new injectable thermosensitive hydrogel loading solid lipid nanoparticles. Pharmazie. 66:948–952.
- Guzman-Gutierrez SL, Bonilla-Jaime H, Gomez-Cansino R, Reyes-Chilpa R. 2015. Linalool and β-pinene exert their antidepressant-like activity through the monoaminergic pathway. Life Sci. 128:24–29.
- Hashem FM, Al-Sawahli MM, Nasr M, Ahmed OA. 2015. Custom fractional factorial designs to develop atorvastatin self-nanoemulsifying and nanosuspension delivery systems-enhancement of oral bioavailability. Drug Des Devel Ther. 9:3141–3152.
- Horn D, Rieger J. 2001. Organic nanoparticles in the aqueous phase-theory, experiment, and use. Angew Chem Int Ed Engl. 40:4330–4361.
- Jedlickova Z, Mottl O, Sery V. 1992. Antibacterial properties of the Vietnamese cajeput oil and ocimum oil in combination with antibacterial agents. J Hyg Epidemiol Microbiol Immunol. 36:303–309.
- Jyothi KR, Beloor J, Jo A, Nguyen MN, Choi TG, Kim JH, Akter S, Lee SK, Maeng CH, Baik HH, et al. 2015. Liver-targeted cyclosporine A-encapsulated poly (lactic-co-glycolic) acid nanoparticles inhibit hepatitis C virus replication. Int J Nanomedicine. 10:903–921.
- Li Y, Lv O, Zhou F, Li Q, Wu Z, Zheng Y. 2015. Linalool inhibits LPS-induced inflammation in BV2 microglia cells by activating Nrf2. Neurochem Res. 40:1520–1525.
- Lin CC, Chen F, Ye TT, Zhang LN, Zhang WJ, Liu DD, Xiong W, Yang XG, Pan WS. 2014. A novel oral delivery system consisting in “drug-in cyclodextrin-in nanostructured lipid carriers” for poorly water-soluble drug: vinpocetine. Int J Pharm. 465:90–96.
- Liu X, Wang Z, Feng R, Hu Y, Huang G. 2013. A novel approach for systematic delivery of a hydrophobic anti-leukemia agent tamibarotene mediated by nanostructured lipid carrier. J Biomed Nanotechnol. 9:1586–1593.
- Liu Y, Wang Y, Zhuang D, Yang J, Yang J. 2012. Bionanoparticles of amphiphilic copolymers polyacrylate bearing cholesterol and ascorbate for drug delivery. J Colloid Interface Sci. 377:197–206.
- Mancarella S, Greco V, Baldassarre F, Vergara D, Maffia M, Leporatti S. 2015. Polymer-coated magnetic nanoparticles for curcumin delivery to cancer cells. Macromol Biosci. 15:1365–1374.
- Miraghazadeh SG, Shafaroodi H, Asgarpanah J. 2015. Analgesic and antiinflammatory activities of the essential oil of the unique plant Zhumeria majdae. Nat Prod Commun. 10:669–672.
- Mitropoulou G, Fitsiou E, Stavropoulou E, Papavassilopoulou E, Vamvakias M, Pappa A, Oreopoulou A, Kourkoutas Y. 2015. Composition, antimicrobial, antioxidant, and antiproliferative activity of Origanum dictamnus (dittany) essential oil. Microb Ecol Health Dis. 26:26543.
- Miyashita M, Sadzuka Y. 2013. Effect of linalool as a component of humulus lupulus on doxorubicin-induced antitumor activity. Food Chem. Toxicol. 53:174–179.
- Muller RH, Shegokar R, Keck CM. 2011. 20 years of lipid nanoparticles (SLN and NLC): present state of development and industrial applications. Curr Drug Discov Technol. 8:207–227.
- Park SN, Lim YK, Freire MO, Cho E, Jin D, Kook JK. 2012. Antimicrobial effect of linalool and α-terpineol against periodontopathic and cariogenic bacteria. Anaerobe. 18:369–372.
- Peana AT, D'Aquila PS, Chessa ML, Moretti MD, Serra G, Pippia P. 2003. (-)-Linalool produces antinociception in two experimental models of pain. Eur J Pharmacol. 460:37–41.
- Piryaei M, Abolghasemi MM, Nazemiyeh H. 2015. Fast determination of Ziziphora tenuior L. essential oil by inorganic-organic hybrid material based on ZnO nanoparticles anchored to a composite made from polythiophene and hexagonally ordered silica. Nat Prod Res. 29:833–837.
- Pornaroonthama P, Thouchprasitchai N, Pongstabodee S. 2015. CO2 adsorption on diatomaceous earth modified with cetyltrimethylammonium bromide and functionalized with tetraethylenepentamine: optimization and kinetics. J Environ Manage. 157:194–204.
- Pourfarzad A, Khodaparast MHH, Karimi M, Mortazavi SA. 2014. Optimization of a novel improver gel formulation for Barbari flat bread using response surface methodology. J Food Sci Technol. 51:2344–2356.
- Pradhan M, Singh D, Murthy SN, Singh MR. 2015. Design, characterization and skin permeating potential of Fluocinolone acetonide loaded nanostructured lipid carriers for topical treatment of psoriasis. Steroids. 101:56–63.
- Puglia C, Sarpietro MG, Bonina F, Castelli F, Zammataro M, Chiechio S. 2011. Development, characterization, and in vitro and in vivo evaluation of benzocaine- and lidocaine-loaded nanostructrured lipid carriers. J Pharm Sci. 100:1892–1899.
- Rahaiee S, Shojaosadati SA, Hashemi M, Moini S, Razavi SH. 2015. Improvement of crocin stability by biodegradeble nanoparticles of chitosan-alginate. Int J Biol Macromol. 79:423–432.
- Ranpise NS, Korabu SS, Ghodake VN. 2014. Second generation lipid nanoparticles (NLC) as an oral drug carrier for delivery of lercanidipine hydrochloride. Colloids Surf B Biointerfaces. 116:81–87.
- Scheman A, Scheman N, Rakowski EM. 2014. European directive fragrances in natural products. Dermatitis. 25:51–55.
- Sharma P, Dube B, Sawant K. 2011. Development and evaluation of nanostructured lipid carriers of cytarabine for treatment of meningeal leukemia. J Nanosci Nanotechnol. 11:6676–6682.
- Shi F, Yang G, Ren J, Guo T, Du Y, Feng NP. 2013. Formulation design, preparation, and in vitro and in vivo characterizations of β-elemene-loaded nanostructured lipid carriers. Int J Nanomedicine. 8:2533–2541.
- Tavacoli JW, Katgert G, Kim EG, Cates ME, Clegg PS. 2012. Size limit for particle-stabilized emulsion droplets under gravity. Phys Rev Lett. 108:268306.
- Vitorino C, Almeida A, Sousa J, Lamarche I, Gobin P, Marchand S, Couet W, Olivier JC, Pais A. 2014. Passive and active strategies for transdermal delivery using co-encapsulating nanostructured lipid carriers: in vitro vs. in vivo studies. Eur J Pharm Biopharm. 86:133–144.
- Wang Q, Sun Y, Zhang Z, Duan Y. 2015. Targeted polymeric therapeutic nanoparticles: design and interactions with hepatocellular carcinoma. Biomaterials. 56:229–240.
- Xue M, Zhao Y, Li XJ, Jiang ZZ, Zhang L, Liu SH, Li XM, Zhang LY, Yang SY. 2012. Comparison of toxicokinetic and tissue distribution of triptolide-loaded solid lipid nanoparticles vs free triptolide in rats. Eur J Pharm Sci. 47:713–717.
- Yang SC, Lu LF, Cai Y, Zhu JB, Liang BW, Yang CZ. 1999. Body distribution in mice of intravenously injected camptothecin solid lipid nanoparticles and targeting effect on brain. J Control Release. 59:299–307.
- Yang Y, Xie X, Yang Y, Zhang H, Mei X. 2015. Photo-responsive and NGR-mediated multifunctional nanostructured lipid carrier for tumor-specific therapy. J Pharm Sci. 104:1328–1339.
- Ye YJ, Wang Y, Lou KY, Chen YZ, Chen R, Gao F. 2015. The preparation, characterization, and pharmacokinetic studies of chitosan nanoparticles loaded with paclitaxel/dimethyl-beta-cyclodextrin inclusion complexes. Int J Nanomed. 10:4309–4319.
- Zhang L, Zhang Q, Wang X, Zhang W, Lin C, Chen F, Yang X, Pan W. 2015. Drug-in-cyclodextrin-in-liposomes: a novel drug delivery system for flurbiprofen. Int J Pharm. 492:40–45.
- Zhu Y, Peng W, Zhang J, Wang M, Firempong CK, Feng C, Liu H, Xu X, Yu J. 2014. Enhanced oral bioavailability of capsaicin in mixed polymeric micelles: preparation, in vitro and in vivo evaluation. J Funct Foods. 8:358–366.
- Zhu Y, Zhang J, Zheng Q, Deng W, Li Q, Firempong CK, Wang S, Tong S, Xu X, Yu J. 2015. In vitro and in vivo evaluation of capsaicin-loaded microemulsion for enhanced oral bioavailability. J Sci Food Agric. 95:2678–2685.