
Abstract
Context: Vicenin-1, a flavonol glycoside, has potent platelet aggregation inhibition, antioxidant, radioprotectants and anti-inflammatory activities.
Objective: To establish a rapid, simple, precise and sensitive high-performance liquid chromatography (HPLC) method for determination of vicenin-1 in rat plasma, and to investigate the pharmacokinetics, tissue distribution and excretion after a single 60 mg/kg oral dose in rats.
Materials and methods: Vicenin-1 was extracted by solid–liquid extraction through Tulsicon® ADS-400 (0.40–1.2 mm). Chromatographic separation was achieved by HPLC with a C18 column with a mobile phase composed of water and acetonitrile (75:25 v/v) and a flow rate of 1 mL/min along with UV detection at 210 nm.
Results: Good linearity of calibration curve was found between 10.5 and 100.5 μg/mL (R2 = 0.995) for plasma and tissue, whereas 2.5–500 μg/mL (R2 = 0.999) for the urine and stool samples. The extraction recoveries were 98.51–99.58% for vicenin-1 in plasma, whereas intra-day and inter-day precision were validated by relative standard deviation (%RSD), that came in the ranges of 1.16–1.79% and 1.28–1.73%, respectively. The pharmacokinetics results showed Cmax (7.039 μg/mL) and Tmax (2 h) after oral administration of vicenin-1. Tissue distribution study showed that the highest concentration of vicenin-1 was achieved in the liver followed by the lung. Approximately 24.2% of its administered dose was excreted via urinary excretion route.
Conclusion: The first-pass metabolism, poor solubility and presence of reducing sugar moiety in vicenin-1 may decrease its bioavailability. The developed method is sensitive, specific and was successfully applied to the pharmacokinetics, tissue distribution and excretion studies of vicenin-1 in rats.
Introduction
Over last few decades, there has been an enormous increase of interest in herbal medicine in both developed and developing countries. Herbal medicines from Ayurveda play a vital role in the health enhancement and prevention of chronic diseases. These agents also show additive action when administered along with conventional medicines. Thus, there is a need to incorporate these herbal moieties as adjuvant drug therapies (Saad et al. Citation2005; Omeish et al. Citation2011). With the increasing market of medicinal products from the herbal origin, many pharmaceutical industries are showing interest in the evaluation of safety and efficacy of herbal products via pre-clinical pharmacological studies as well as controlled and randomized clinical trials (Calixto Citation2000).
However, to be a better medicinal agent with useful pharmacological activity, chemical moieties should possess a well-characterized pharmacokinetic profile (Sy et al. Citation2014). It has been reported that approximately 30–40% of the new drug candidates failed during drug development process due to their poor pharmacokinetic properties (Grimaldi et al. Citation1990; Liang et al. Citation2013). Thus, animal models play a crucial role in understanding the pharmacokinetic properties of novel drugs (Kandhare et al. Citation2011). Moreover, in vivo disposition pattern, as well as a major site of action of the drug, can be evaluated by the distribution and excretion property of that chemical moiety.
There is an absolute necessity to develop an appropriate, well-characterized and fully validated analytical method for quantitative determination of drugs as well as their metabolites in biological samples such as plasma, urine, faecal matter, as well as various tissue homogenates. Development of a rapid, simple, precise and sensitive analytical method by using a sophisticated instrument like HPLC played a crucial role in the evaluation, interpretation of bioavailability, bioequivalence as well as pharmacokinetic data of therapeutic moiety in a biological fluid (Shah et al. Citation1992). Thus, this developed analytical method must comply with all the necessary criteria for specificity, linearity, precision, sensitivity, accuracy and limit of quantification adjusted to analyses (ICH Guideline Citation2005).
Fenugreek, or Trigonella foenum-graecum Linn. (Leguminosae) is one of the oldest known medicinal plants with dietary and medicinal uses. Its seeds are the most frequently used part of the plant in a variety of diseases in Indian, Middle Eastern and Mediterranean countries. Over the past decades, more than 50 chemical constituents have been isolated and purified from fenugreek seeds. This includes protein, dietary fibre (mucilaginous soluble fibre and insoluble fibre), fixed fatty acids, essential oils, steroidal saponins, alkaloids (trigonelline, cholin, gentianine, carpaine, etc.), free amino acids (4-hydroxyisoleucine) and individual spirostanols and furastanols like vicenin-1, vitexin, diosgenin, gitogenin, yamogenin, etc. (Bhaskaran & Vishwaraman Citation2012; Mandegary et al. Citation2012; Kandhare et al. Citation2015b). All these ingredients have a broad spectrum of biological activities including antibacterial, anti-inflammatory, insulinotropic, antidiabetic, hypocholesterolemic, antifertility and anticancer activity (Valette et al. Citation1984; Madar et al. Citation1988; Al-Habori & Raman Citation1998; Aswar et al. Citation2010). Vicenin-1, a water-soluble flavonoid has been reported to have potent radioprotectant, antioxidant, anti-inflammatory and metal chelating activities (Uma Devi et al. Citation2000; Devi Citation2001; Vrinda & Uma Devi Citation2001; Uma Devi & Satyamitra Citation2004). Although vicenin-1 possesses unceasingly expanding the list of postulated targets, exploration of its pharmacological properties is still poor due to lack of pharmacokinetic studies. However, it has been well documented that this flavonoid often have poor bioavailability due to their pre-systemic metabolism (Gee et al. Citation2000; Barnes et al. Citation2004). Thus, these promising pharmacological effects prompted researchers to investigate and characterize the pharmacokinetic profiling of vicenin-1 isolated from fenugreek seeds.
However, to the best of our knowledge, there has been no report on the pharmacokinetics and tissue distribution patterns of vicenin-1. Therefore, it is necessary to develop a comprehensive investigation of the pharmacokinetics for vicenin-1. Hence, the aim of the present investigation was to develop a simple, rapid and sensitive high-performance liquid chromatography (HPLC) method for the determination of vicenin-1 isolated from fenugreek seeds in rat plasma by solid–liquid extraction (SLE). This method was then applied to study the tissue distribution and excretion after a single oral administration of vicenin-1 to healthy rats.
Materials and methods
Extraction and characterization of vicenin-1 from fenugreek seeds extract
Extraction of vicenin-1 was carried out according to the previously reported method (Bhaskaran & Vishwaraman Citation2012; Kandhare et al. Citation2015a). Briefly, vicenin-1 was prepared from the hydroalcoholic extract of fenugreek seeds as follows: the cultivated fenugreek seeds were collected during the summer of the year 2011 from Mandsaur, Madhya Pradesh, India. Fenugreek seeds were authenticated by Dr. A. M. Mujumdar, Department of Botany, Agharkar Research Institute, Pune, India (voucher specimen No. IND/Lab/08/10-11). Air-dried fenugreek seeds were extracted with a solvent mixture of ethanol and water (80:22 v/v). The solvent was passed through the layer of flaked seeds for 10 h at 35 °C, and the eluent was recycled. After 10 h, the extract was filtered through a 200-mesh cloth to get a clear solution, and this was concentrated at 50 °C under vacuum to a semi-solid mass. The resultant semi-solid mass was dissolved in deionized water and subjected to countercurrent extraction with n-butanol. The clear water layer was passed through a strong cation exchange column to remove all the amphoteric compounds like amino acids, proteins and trigonelline. This solution was passed through the resin bed comprising Dowex Optipore L493 (highly cross-linked polymer adsorbent with a high surface area and unique pore size distribution) for 2 h. The adsorption process was monitored by a thin-layer chromatography (TLC) system comprising toluene–ethyl acetate–methanol–water (6:3:6:1 v/v/v/v). The bioactive components started eluting at ethyl alcohol–water (70:30 v/v). These fractions were collected, screened, pooled and concentrated at 50 °C to yield a final composition.
The characterization of vicenin-1 was carried out with HPLC to establish the purity of compounds in the composition. The eluted compound of column chromatography was highly purified and characterized by using TLC, LC–MS, 1H NMR as well as 13C NMR analysis and was used as a reference standard. The HPLC conditions were as follows: Column: Kromasil C18 column (250 mm ×4.6 mm, 5 μm), detector: UV-2075 (wavelength: 210 nm), injection volume: 20 μL; flow rate: 1 mL/min (gradient elution technique), mobile phase: acetonitrile–water starting in various concentration from 75:25 v/v to 65:35 v/v over 20 min.
Chemicals
Acetonitrile (HPLC grade) was purchased from Merck & Company (Merck Specialities Pvt. Ltd., Mumbai, India). Deionized water was purified by Milli-Q system (Merck Specialities Pvt. Ltd.). All other reagents were of analytical grade and obtained from conventional commercial sources.
Animals
Male Wistar rats (180–220 g) were purchased from the National Institute of Biosciences (Pune, India) and were used for the study. They were housed in cages at a temperature of 24 ± 1 °C and relative humidity 56–66%, with 12 h fluorescent light and 12 h dark cycle in an animal house facility. The rats had free access to water ad libitum throughout the study duration except during actual measurements. All experiments were carried out between 09:00 h and 17:00 h. The experimental protocol (CPCSEA/35/2012) was approved by Institutional Animal Ethics Committee (IAEC) of Poona College of Pharmacy, Pune, India. The experiments were performed in accordance with the ethical guidelines for animal experimentation recommended by the Committee for Control and Supervision of Experimentation on Animals (CPCSEA), Government of India, New Delhi, India.
Instrumentation and chromatographic conditions
The HPLC analysis was carried out on chrompass liquid chromatographic-4000 system (JASCO Corporation, Hachioji, Tokyo, Japan) equipped with an autosampler and UV-2075 plus detector. Data acquisition was controlled by JASCO ChromPass Chromatography Data System software. Chromatographic separation was accomplished on a Kromasil 100-5 C18 (Serial No. E31667) (250 mm ×4.6 mm, 5 μm) analytical column (Sigma-Aldrich, Powai, Mumbai, India), pump: pu-2080 plus, UV detector: UV-2075 and autosampler: AS-2055 plus. The mobile phase was water and acetonitrile (75:25 v/v) at a flow rate of 1 mL/min. Chromatograms were monitored at 210 nm with run time of 30 min and the column temperature was maintained at 25 °C.
Extraction of plasma samples
For the assay of plasma samples, the internal standard solution (100 μL) and the mixture (100 μL) of water and acetonitrile corresponding to the volume of the working standard solutions were added to a glass tube and the solvent was evaporated to dryness under the nitrogen gas flow. Plasma sample (1 mL) was added to the residue, and the mixture was vortex mixed for 5 min and applied to Tulsicon® ADS-400 (0.40–1.2 mm) column followed by washing with 6 mL distilled water. Then, the column was eluted with 2 mL of methanol and eluate was concentrated under nitrogen. The resultant residue was mixed with 1 mL of distilled water and analysed by HPLC. A 20-μL aliquot was injected into the HPLC system for analysis.
Calibration standards and quality control samples preparation
A stock solution of vicenin-1 was prepared in methanol to give a final concentration of 1.0 mg/mL. A series of working solutions were obtained by diluting the vicenin-1 stock solution with methanol and were stored at 4 °C until used. Calibration standards of vicenin-1 were prepared by spiking the appropriate amount of the working solutions into 100 μL drug-free rat plasma or tissue homogenates. The final concentrations of calibration standard samples were in the range of 10.5–100.5 μg/mL. Quality control (QC) samples were prepared at the concentrations of 10.5, 52.5, 100.5 μg/mL for plasma and 2.5–500 μg/mL for different tissue homogenates, urine and faecal samples (Food and Drug Administration Citation2001).
General procedure for sample preparation for vicenin-1 analysis in plasma, tissue, urine and faecal samples
A SLE of vicenin-1 in biosamples was performed prior to HPLC analysis. Briefly, 100 μL of plasma or tissue samples or clear supernatant of urine or stool was obtained by centrifuging the whole urine at 10,000 rpm at 4 °C for 20 min. Then, it was passed through Tulsicon® ADS-400 (0.40–1.2 mm), washed with 6 mL of distilled water and eluted with 2 mL of methanol. Samples were concentrated under nitrogen and residue of each sample was dissolved in 1 mL mobile phase consisting of water and acetonitrile (75:25 v/v). An aliquot (20 μL) of the supernatant was injected into the HPLC system.
Method validation
Specificity
Specificity was assessed by analysing blank plasma and tissue homogenate samples, blank plasma and tissue homogenate samples spiked with vicenin-1.
Calibration curves and lower limit of quantification
Calibration standard was prepared as described above in triplicate and analysed for three consequent days. The lower limit of quantification (LLOQ) was defined as the lowest concentration of an analyte in a sample that provided a peak area with a signal-to-noise ratio higher than 10.
Precision and accuracy
Intra- and inter-day precision and accuracy were evaluated by analysis of the three QC samples with six determinations per concentration on the same day, while the inter-day precision and accuracy were measured over three consecutive days. The precision was defined as the relative standard deviation (%RSD), while accuracy was determined by calculating the percentage deviation observed in the analysis of QC samples and expressed by relative error (%RE). The accepted criteria for the data were that the precision and accuracy should not exceed 2%, except at the LLOQ where it should not exceed 3%.
Extraction recovery and stability
The extraction recoveries of vicenin-1 were determined at the low, medium and high level of QC samples. Recoveries were calculated by comparing the observed peak area ratios in biosamples to those non-processed standard solutions at the same concentrations (Food and Drug Administration Citation2001).
The stability of vicenin-1 in plasma and tissue was determined by different storage or handling conditions. Short-term stability was assessed by analysing QC samples kept at ambient temperature for 8 h. Freeze–thaw stability was evaluated at three consecutive freeze–thaw cycles. Long-term stability was studied by assaying samples following a period of 2 weeks of storage at −70 °C (Food and Drug Administration Citation2001).
In vivo pharmacokinetic study
Six rats were used for pharmacokinetic investigation. Vicenin-1 was administered orally at a dose of 60 mg/kg. At the time points interval of 0 (pre-dose), 0.083, 0.25, 0.5, 0.75, 1, 1.5, 2, 4, 8, 12, 24, 48, 72 and 96 h post-injection, blood samples (1 mL) were collected in heparinized tubes from the retro-orbital puncture, and then centrifuged at 10,000 rpm for 5 min to obtain plasma. The plasma was stored at −70 °C prior to HPLC analysis.
Tissue distribution study
For tissue distribution study, three rats were used, and vicenin-1 was administered orally at a dose of 60 mg/kg. After administration, the rats were sacrificed after 2 h following administration, and the tissue specimens including the brain, kidney, adrenal gland, liver, lungs and small intestine were collected. Tissue samples were rinsed in saline and blotted dry with filter paper. This sample were then weighed for wet weight and homogenized in ice-cold physiological saline solution (500 mg/mL). The obtained tissue homogenates were stored at −70 °C until analysis performed using the procedure described above.
Urinary and faecal excretion study
For urinary and faecal excretion study, three rats were used, and vicenin-1 was administered orally at a dose of 60 mg/kg. The rats were housed in metabolic cages (Techniplast SPA, Buguggiate VA, Italy) with free access to water and food was returned approximately 4 h post-dosing. Urine and faeces were collected at 0–24, 24–48, 48–72, 72–96 and 96–108 h post-dosing. The faeces were dried at room temperature. The specimens were stored at −70 °C after the urine volume and faeces dry weight for each collection period were measured.
Statistical analysis
All the data were expressed as the mean ± SEM. The pharmacokinetic parameters were calculated using the Kinetica v 5.0 (Alfasoft AB, Kyrkogatan 24, Göteborg, Sweden).
Results
Characterization of vicenin-1
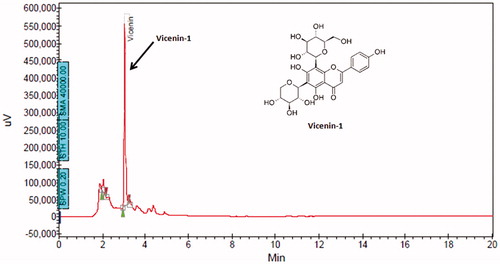
The compound corresponding to the present peak (RT =3.2 min in HPLC) was isolated and characterized. TLC study using toluene–ethyl acetate–methanol–water (6:3:6:1 v/v/v/v), following 5% anisaldehyde sulphuric acid spray and heating at 110 °C for 15 min yielded single yellow spot with melting point of 214–216 °C and a mass (m/z) spectrum 564 (M + H = 565) (LC–MS analysis) confirming presence of these flavonoid glycoside structure. The NMR study revealed following details: 13C NMR in CD3OD (100 MHz): δC (ppm) 164.57 (C-2), 103.05 (C-3), 182.7 (C-4), 161.4 (C-5), 108.55 (C-6), 158.7 (C-7), 104.1 (C-8), 155.5 (C-9), 103.1 (C-10), 122.0 (C-1′), 129.2 (C-2′), 116.45 (C-3′), 161.6 (C-4′), 116.29 (C-5′), 129.1 (C-6′); xylose: 74.6 (C-1″), 70.5 (C-2″), 79.3 (C-3″), 70.7 (C-4″), 68.9 (C-5″); glucose: 71.76 (C-1‴), 70.99 (C-2‴), 79.67 (C-3‴), 70.05 (C-4‴), 82.35 (C-5‴), 61.6 (C-6‴); 1H NMR analysis in DMSO-d6 (at 25 °C): aromatic proton corresponding to flavones proton ring – [6.79, 6.8, 7.936, 7.949; 6.897, 6.951, 8.0, 8.031], sugar protons-6-C-xyloside between 3.09 and 4.65 and 8-C-glucoside between 3.29 and 4.77. From the NMR data, the structure of the compound corresponding to the present peak was confirmed to be vicenin-1 with purity of 93% as observed in HPLC ().
Figure 1. HPLC chromatogram showing the peak of isolated vicenin-1 (RT =3.02 min).
Selection of mobile phase
Biosample extraction was performed using a SLE and different solvents such as ethyl acetate, chloroform, hexane, formic acid and acetonitrile were investigated. Finally, water and acetonitrile in a mixture of 75:25 v/v were found to be optimal, because it could produce clean chromatograms for plasma, tissues, urine and faecal. It also showed the highest recovery for the analytes.
Method Validation
Linearity of calibration curve and LLOQ
The calibration curves showed a good linearity over the concentration range of 10.5–100.5 μg/mL in rat plasma and tissue homogenates with a correlation coefficient (R2) larger than 0.995. The peak area versus concentration equipped well with a straight line, with the equation y = 95.99x + 75.38 for plasma and tissue homogenates. For the urine and stool samples, calibration curves showed a good linearity over the concentration range of 2.5–500 μg/mL with a correlation coefficient (R2) larger than 0.999. The peak area versus concentration equipped well with a straight line, with the equation y = 11.55x − 27.54 for urine and faecal sample. The current assay offered an LLOD of 8.96 μg/mL, whereas LLOQ of 27.53 μg/mL for plasma, and for tissue samples LLOD of 7.12 μg/mL and LLOQ of 21.59 μg/mL for urine and faecal sample were obtained. The limits were sufficient for studies of pharmacokinetics, tissue distribution and urine elimination following a single oral administration of vicenin-1 (; ).
Figure 2. Concentration versus residual plot of vicenin-1.
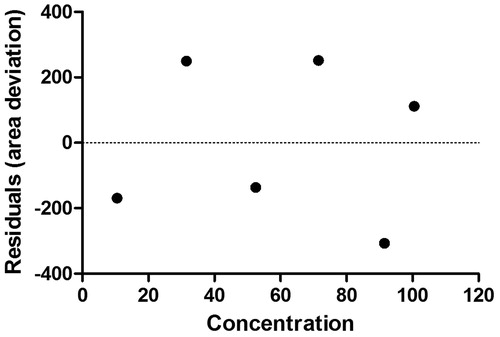
Table 1. Linear regression data for the calibration curves in plasma (n = 6).
Precision and accuracy
The intra- and inter-day precision and accuracy of the method in plasma are summarized in . For all the samples spiked with analytes at three concentration levels, the %RSD of both intra-day and inter-day precision was between 1.16–1.79% and 1.28–1.73%, respectively. Accuracy was calculated as % recovery, and it was ranged between 98.51% and 99.58% for the matrices studied for vicenin-1 in plasma, whereas the intra- and inter-day precision and accuracy of the method in urine are summarized in . For all the samples spiked with analytes at three concentration levels, the %RSD of both intra-day and inter-day precision was between 1.04–1.73% and 1.09–1.67% respectively. Accuracy was calculated as % recovery, and it was ranged between 100.91% and 111.82% for the matrices studied for vicenin-1 in urine.
Table 2. Intra- and inter-day precision of the HPLC method, recovery and robustness study for vicenin in plasma.
Table 3. Intra- and inter-day precision of the HPLC method, recovery and robustness study for vicenin in urine.
The results demonstrated that the method is accurate and reproducible for determination of vicenin-1 in rat plasma, tissues, urine and faecal samples. This data indicated that the biosample extraction procedure was satisfied and can achieve the acceptable extraction recovery. The low values of %RSD were less than three (< 2%), with no significant differences in values for intra- and inter-day precision, that indicated the method’s reproducibility with high precision.
Robustness
Robustness of the envisaged method studied after deliberate alterations of the analytical parameters indicated that peak areas of interest and retention factor remained unaffected by small changes in the operational parameters (%RSD <2). The summary of validation parameters of proposed method is given in and .
Specificity
The HPTLC-UV spectra of vicenin-1 were at 210 nm. The representative chromatograms for determination of vicenin-1 in plasma are shown in , in tissues (liver, lung, brain, small intestine and kidney were chosen as representative tissues) are presented in , respectively, and in urinary excretion are shown in . The retention time of vicenin-1 was about 3.02 min. This indicates that the analyte was well separated, and no interferences were detected from endogenous substances or metabolites.
Figure 3. Representative chromatograms of methanol (A); plasma spiked with vicenin-1 (B); plasma sample at 0 h before administration of vicenin-1 (C) and plasma sample after 2 h of vicenin-1 administration at a single 60 mg/kg oral dose (D).
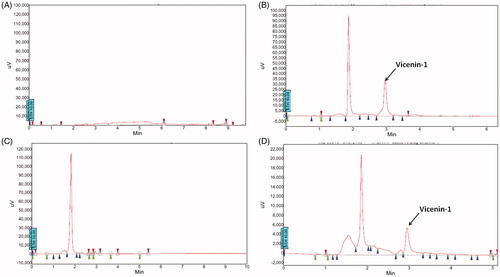
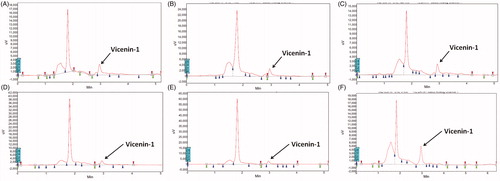
Figure 4. Representative chromatograms of liver tissue homogenate (A), lung tissue homogenate (B), brain tissue homogenate (C), small intestine tissue homogenate (D), kidney tissue homogenate (E) and urinary excretion (F) after a single 60 mg/kg oral dose of vicenin-1.
Pharmacokinetics of vicenin-1 in rats
The mean plasma concentration-time profiles of vicenin-1 in rats following oral administration at a dose of 60 mg/kg is shown in , and the corresponding pharmacokinetic parameters are summarized in . It was found that the data were best fitted with a two-compartment model. Vicenin-1 had a slow distribution phase as it appeared in plasma after 30 min followed by a relative slow elimination phase that could be detected by 48 h post-dosing.
Figure 5. Mean plasma concentration–time profiles of vicenin-1 in rats after receiving a single oral dose at a concentration of 60 mg/kg (A) and cumulative urinary excretion of vicenin-1 in rats after receiving a a single 60 mg/kg oral dose (B).
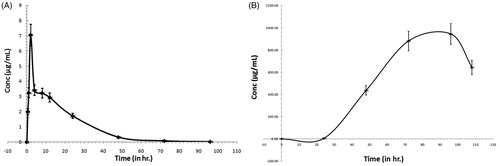
Table 4. Pharmacokinetic parameters for vicenin in rats after receiving a single 60 mg/kg oral dose.
Tissue distribution study
The tissue distribution of vicenin-1 after single oral administration of 60 mg/kg in rats showed that the highest concentration of vicenin-1 which was observed in the liver followed by the lung. The high affinity in the lung of vicenin-1 confirms that it has a good curative effect on hepatic and respiratory diseases. Also, the presence of vicenin-1 in a very low concentration was detected in the brain, suggesting that vicenin-1 has difficulty in crossing the blood–brain barrier ().
Urinary and faecal excretion study
The excretion of vicenin-1 in urine was illustrated in . After a single oral administration of 60 mg/kg vicenin-1, the mean elimination in urine was after 24 h and could be detected until 108 h post-dosing. Hence, the major unchanged amount of vicenin-1 was eliminated from the urine over 108 h that showed 24.2% of cumulative urinary excretion of vicenin-1 as that of 60 mg/kg oral dose administration. It did not show any faecal excretion over a period of 108 h. The elimination rate constant for vicenin-1 was 0.059 h−1.
Discussion
A systematic landscape of the pharmacokinetics of isolated moieties from natural resources plays a decisive role in in vivo and in vitro pharmacological properties of the molecule. Thus, pharmacokinetics properties of herbal constituents serve as an important and useful tool for understanding the link between the herb consumption and its pharmacological effects of medicinal principles (Lu et al. Citation2008). Systematic pharmacokinetic study of herbal medicine helps in understanding the various pathways that influence the systemic exposure of administered medicine (Kandhare et al. Citation2015c). Pharmacokinetic analysis of compound based on HPLC-UV method is a traditional technique for quantification and quantitation with ease and cost effectiveness. In the present investigation, a simple, rapid and sensitive HPLC-VU method for determination of vicenin-1 isolated from fenugreek seeds in plasma, various tissues, urine and faecal was optimized.
The results of present investigation suggested that the developed bioanalytical method for identification of vicenin-1 is accurate because LLOQ was 27.53 μg/mL, ranging within the acceptance limits of the theoretical value. Moreover, the precision value was found to be between 1.16% and 1.79%, which was also within the acceptance limits. The results from QC samples revealed that the developed method showed adequate specificity, sensitivity, accuracy and precision. In the present study, to minimize baseline distortion and optimize extraction recovery we have used acetonitrile as a simple one-step protein precipitating agent. Other reagents employed for protein precipitation included ethyl acetate, chloroform, hexane and formic acid. However, recoveries using these agents were either very low or showed interference peaks during detection. Thus, finally, water and acetonitrile in a mixture of 75:25 v/v was selected as the best amount and kind of protein precipitant where chromatograms showed a good baseline separation and retention of vicenin-1. Moreover, there was no interference from endogenous plasma and tissue compounds near the retention time of the vicenin-1. Thus, the developed method for determination of vicenin-1 was economic, simple, precise, accurate and sensitive with shorter analysis time and higher recovery.
The plasma concentration profiling of vicenin-1 showed that, although the plasma level of vicenin-1 was very low, a substantial amount of vicenin-1 was eliminated in the urine samples after oral administration. It has been documented that the high rate of the first-pass metabolism of drug, variable rate of gastric emptying and motility of the gastrointestinal tract may result in low bioavailability of the drug. The variation in degrees of drug response to the absorption site also influences the bioavailability (Liang et al. Citation2013). For the oral route of administration, metabolism in the intestinal membrane and the liver is of major concern as it can reduce the systemic bioavailability of the drug (Kushwaha et al. Citation2014). Exposure of drugs to various pH conditions, nature of gut microflora and the presence of various enzymes in gastrointestinal transit also decrease the bioavailability of drugs (Shi et al. Citation2006; Ou-yang et al. Citation2013). It has been reported that the presence of sugar moieties in the molecule structure results in increasing hydrogen bond count, polar surface area and molecular flexibility of the molecules to unfavorable levels of poor membrane permeability (Liu et al. Citation2009). Thus, the presence of reducing sugar moiety associated with decreased solubility of the molecule caused a decrease in intestinal absorption of the drug. In the present investigation, the low bioavailability of vicenin-1 attributed to the presence of reducing sugar in its structure (), which may interference with the intestinal absorption of vicenin-1. This fact was further supported by the high amount of vicenin-1 excreted in the urine. In addition, the poor permeability could also be partially explained the observations of present investigation where the amount of vicenin-1 was very low in tissue distribution study. In most cases, the tissue concentrations of vicenin-1 were lower than the urinary excretion levels. However, the concentration of vicenin-1 in liver was higher than that of the plasma levels that may be due to the active transport of vicenin-1 in the hepatic cells via some uptake transporters.
The mean residence time (MRT) is a useful tool for predicting the behaviour of the drug in the body after oral administration (Cutler Citation1978; Yamaoka et al. Citation1978). MRT is a composite variable that reflects all the kinetic processes including absorption and disposition of a drug in the body (Yamaoka et al. Citation1978). Moreover, high MRT suggests the delayed absorption of drugs. In the present investigation, MRT of the vicenin-1 was found to be at 17.97 h, which may be due to delayed absorption of vicenin-1 from the gastrointestinal tract, that was further supported by the delayed urinary elimination of vicenin-1 over a period of 108 h.
Concentrations of vicenin-1 were determined in various tissues of rat such as the brain, kidney, liver, lung, small intestine and adrenal gland. Very low concentrations were detected in brain (0.09%), kidney (0.02%) and adrenal gland (0.002%). This suggested that vicenin-1 may have limitations in crossing the blood–brain barrier, which is also supported by the poor solubility of vicenin-1 in a fat solvent. Furthermore, the content of vicenin-1 was found to be higher in the lung (0.18%), reflecting that it may have certain effects on lung-related disorder. As the liver is the main organ of the first-pass metabolism, vicenin-1 may undergo first-pass metabolism in the liver. Thus, the highest concentration of vicenin-1 (1.59%) was found in liver. However, vicenin-1 may play a potential role in hepatic diseases amelioration, and further research may be carried out to elucidate these properties.
Conclusion
In conclusion, a simple, precise, accurate, rapid, sensitive and specific HPLC-UV method was developed and validated for the determination of vicenin-1 in rat plasma that has been applied successfully to the pharmacokinetic and tissue distribution study of vicenin-1 to the rats after single oral administration. The method included a single-step sample preparing procedure with easy to operate and control. In the present study, single oral administration of vicenin-1 (60 mg/kg) in rats showed wide distribution throughout the brain, kidney, liver and lung. Moreover, it was excreted by the kidney due to the first-pass effect of the liver. As far as we are concerned, this is the first report using HPLC-UV to investigate pharmacokinetics and tissue distribution after oral administration of vicenin-1 in rats.
Table 5. Concentration of vicenin in rat various tissues after receiving a single 60 mg/kg oral dose.
Acknowledgements
The authors would like to acknowledge Dr. S. S. Kadam, Vice-Chancellor and Dr. K. R. Mahadik, Principal, Poona College of Pharmacy, Bharati Vidyapeeth Deemed University, Pune, and Sunil Bhaskaran, MD, Indus Biotech Private Limited, Pune, India, for providing necessary facilities to carry out the study.
Disclosure statement
The authors declare no conflict of interest.
References
- Al-Habori M, Raman A. 1998. Antidiabetic and hypocholesterolaemic effects of fenugreek. Phytother Res. 12:233–242.
- Aswar U, Bodhankar SL, Mohan V, Thakurdesai PA. 2010. Effect of furostanol glycosides from Trigonella foenum-graecum on the reproductive system of male albino rats. Phytother Res. 24:1482–1488.
- Barnes S, D’Alessandro T, Kirk MC, Patel RP, Bersma BJ, Darley-Usmar VM, et al. 2004. The importance of in vivo metabolism of polyphenols and their biological actions. In: Meskin MS, Bidlack WR, Davies AJ, Lewis DS, Randolph RK, editors. Phytochemicals: mechanisms of action. Boca Raton (FL): CRC Press. p. 51–59.
- Bhaskaran S, Vishwaraman M. 2012. Composition and method thereof. Google Patents. Publication no. US8513203 B2; [cited 2012 Feb 13]. Available from: http://www.google.co.in/patents/US8513203
- Calixto BJ. 2000. Efficacy, safety, quality control, marketing and regulatory guidelines for herbal medicines (phytotherapeutic agents). Braz J Med Biol Res. 33:179–189.
- Cutler DJ. 1978. Theory of the mean absorption time, an adjunct to conventional bioavailability studies. J Pharm Pharmacol. 30:476–478.
- Devi PU. 2001. Radioprotective, anticarcinogenic and antioxidant properties of the Indian holy basil, Ocimum sanctum (Tulasi). Indian J Exp Biol. 39:185–190.
- Food and Drug Administration. 2001. FDA guidance for industry: bioanalytical method validation. Vol. 1. Rockville (MD): US Department of Health and Human Services. p. 124–129.
- Gee JM, DuPont MS, Day AJ, Plumb GW, Williamson G, Johnson IT. 2000. Intestinal transport of quercetin glycosides in rats involves both deglycosylation and interaction with the hexose transport pathway. J Nutr. 130:2765–2771.
- Grimaldi R, De Ponti F, D’Angelo L, Caravaggi M, Guidi G, Lecchini S, Frigo GM, Crema A. 1990. Pharmacokinetics of the total triterpenic fraction of Centella asiatica after single and multiple administrations to healthy volunteers. A new assay for asiatic acid. J Ethnopharmacol. 28:235–241.
- ICH Guideline. 2005. Validation of analytical procedures: text and methodology, Q2 (R1). Published in the Federal Register, 60, 11260; [cited 2012 Feb 13]. Available from: http://www.ich.org/cache/compo/363-272-1.html
- Kandhare AD, Bodhankar SL, Mohan V, Thakurdesai PA. 2015a. Acute and repeated doses (28 days) oral toxicity study of glycosides based standardized fenugreek seed extract in laboratory mice. Regul Toxicol Pharmacol. 72:323–334.
- Kandhare AD, Bodhankar SL, Mohan V, Thakurdesai PA. 2015b. Effect of glycosides based standardized fenugreek seed extract in bleomycin-induced pulmonary fibrosis in rats: decisive role of Bax, Nrf2, NF-κB, Muc5ac, TNF-α and IL-1β . Chem Biol Interact. 237:151–165.
- Kandhare AD, Bodhankar SL, Mohan V, Thakurdesai PA. 2015c. Pharmacokinetics, tissue distribution and excretion study of a furostanol glycoside-based standardized fenugreek seed extract in rats. Ren Fail. 37:1208–1218.
- Kandhare AD, Raygude KS, Ghosh P, Gosavi TP, Bodhankar SL. 2011. Patentability of animal models: India and the globe. Inter J Pharm Biol Arc. 2:1024–1032.
- Kushwaha HN, Mohan NK, Sharma AK, Singh SK. 2014. Pharmacokinetic study and bioavailability of a novel synthetic trioxane antimalarial compound 97/63 in rats. Malar Res Treat. 2014:759392.
- Liang L, Liu X, Wang Q, Cheng S, Zhang S, Zhang M. 2013. Pharmacokinetics, tissue distribution and excretion study of resveratrol and its prodrug 3,5,4′-tri-O-acetylresveratrol in rats. Phytomedicine. 20:558–563.
- Liu H, Yang J, Du F, Gao X, Ma X, Huang Y, Xu F, Niu W, Wang F, Mao Y, et al. 2009. Absorption and disposition of ginsenosides after oral administration of Panax notoginseng extract to rats. Drug Metab Dispos. 37:2290–2298.
- Lu T, Yang J, Gao X, Chen P, Du F, Sun Y, Wang F, Shang H, Huang Y, et al. 2008. Plasma and urinary tanshinol from Salvia miltiorrhiza (Danshen) can be used as pharmacokinetic markers for cardiotonic pills, a cardiovascular herbal medicine. Drug Metab Dispos. 36:1578–1586.
- Madar Z, Abel R, Samish S, Arad J. 1988. Glucose-lowering effect of fenugreek in non-insulin dependent diabetics. Eur J Clin Nutr. 42:51–54.
- Mandegary A, Pournamdari M, Sharififar F, Pournourmohammadi S, Fardiar R, Shooli S, Arad J. 2012. Alkaloid and flavonoid rich fractions of fenugreek seeds (Trigonella foenum-graecum L.) with antinociceptive and anti-inflammatory effects. Food Chem Toxicol. 50:2503–2507.
- Omeish AF, Abbadi W, Ghanma IM, Drabaa Z, Botoosh FA, Seif A, Massadeh M. 2011. Hospital-based study on the use of herbal medicine in patients with coronary artery disease in Jordan. Hospital. 67:683–687.
- Ou-yang Z, Cao X, Wei Y, Tuan LA. 2013. Pharmacokinetic study of rutin and quercetin in rats after oral administration of total flavones of mulberry leaf extract. Revi Bras Farmacog. 23:776–782.
- Saad B, Azaizeh H, Said O. 2005. Tradition and perspectives of Arab herbal medicine: a review. Evid Based Complement Alternat Med. 2:475–479.
- Shah VP, Midha KK, Dighe S, McGilveray IJ, Skelly JP, Yacobi A, Layloff T, Viswanathan CT, Cook CE, McDowall RD, et al. 1992. Analytical methods validation: bioavailability, bioequivalence, and pharmacokinetic studies. J Pharm Sci. 81:309–312.
- Shi YB, Shi YP, Meng QG. 2006. Determination and pharmacokinetic study of bergenin in rat plasma by RP-HPLC method. Biomed Chromatogr. 20:1065–1070.
- Sy SK, Wang X, Derendorf H. 2014. Introduction to pharmacometrics and quantitative pharmacology with an emphasis on physiologically based pharmacokinetics, applied pharmacometrics. AAPS advances in the pharmaceutical sciences series. FL, USA: Springer. p. 1–64.
- Uma Devi P, Ganasoundari A, Vrinda B, Srinivasan KK, Unnikrishnan MK. 2000. Radiation protection by the ocimum flavonoids orientin and vicenin: mechanisms of action. Radiat Res. 154:455–460.
- Uma Devi P, Satyamitra M. 2004. Protection against prenatal irradiation-induced genomic instability and its consequences in adult mice by Ocimum flavonoids, orientin and vicenin. Int J Radiat Biol. 80:653–662.
- Valette G, Sauvaire Y, Baccou JC, Ribes G. 1984. Hypocholesterolaemic effect of fenugreek seeds in dogs. Atherosclerosis. 50:105–111.
- Vrinda B, Uma Devi P. 2001. Radiation protection of human lymphocyte chromosomes in vitro by orientin and vicenin. Mutat Res. 498:39–46.
- Yamaoka K, Nakagawa T, Uno T. 1978. Statistical moments in pharmacokinetics. J Pharmacokinet Biopharm. 6:547–558.