Abstract
Objectives. To investigate whether coronary microemboli have long-term effects on left ventricular (LV) function in an experimental model. Furthermore, to determine if first-pass perfusion and late gadolinium enhancement (LGE) patterns differs between small- and large-sized microemboli. Design. Six pigs underwent left anterior descending (LAD)-coronary microembolization with small-sized (40–120 μm, n∼250 000) microemboli using a combined x-ray and MRI-system. MR-images before, one hour after and 7–8 weeks after microembolization were obtained. Results were compared to MRI obtained by large-sized (100–300 μm, n∼7200) microemboli. Results. Cine MRI showed an acute drop in ejection fraction (from 49.5 ± 2.6% to 32.5 ± 2.8) that substantially recovered at 7–8 weeks (47.5 ± 3.2%). Regional LV-function assessed as circumferential, longitudinal and radial strain declined in both microinfarcts and remote regions followed by partial recovery at 7–8 weeks. The decline in LV function and the severe perfusion deficit from the small microemboli was similar to the large microemboli at one hour. There was a significant recovery in perfusion at 7–8 weeks in the microinfarcts. LGE demonstrated the microinfarcts at 7–8 weeks but not at one hour and the microinfarcts were confirmed by histopathology. Conclusion. Microembolization causes long-term, regional LV dysfunction and this study confirmed the need of a comprehensive MRI-protocol for the detection of microinfarcts. These findings suggest that even small microemboli (40–120 μm in diameter), which may escape the distal protective devices influence cardiac function.
Microembolization has been shown to contribute to the pathophysiological injury during ST-elevation myocardial infarction (STEMI) (Citation1), unstable angina and non-STEMI (Citation2) and coronary interventions for stable angina (Citation3–5). In patients with STEMI, impaired myocardial tissue perfusion is seen in a third of patients after successful epicardial revascularization and part of the explanation is thought to be microembolization (Citation1). Microembolization has also been shown at autopsy in patients with sudden death (Citation6–8) and in 80% of patients who died following thrombolytic therapy or percutaneous coronary intervention (PCI) (Citation9). Microembolization has been found in association with a variety of other heart diseases, e.g. valvular disease (Citation10), endocarditis (Citation11) and arrhythmias (Citation12). Different definitions regarding heterogeneous microinfarcts have been used. Investigators have used the term microinfarcts for increase in plasma biochemical markers in acute coronary syndrome either spontaneous or PCI-induced (Citation13). Furthermore, pathologists have used the term microinfarcts for microscopically detectable myocardial necrosis but not to infarcts visually detectable on gross specimen, and use the term heterogeneous infarcts for areas of non-uniform early myocardial necrosis and scar (Citation8). In this study, the term microinfarcts will be used for heterogeneous and multifocal small areas of infarcts within the perfusion territory undergoing coronary interventions or microembolization in line with recent magnetic resonance imaging (MRI) publications (Citation14–18).
Previous MRI studies have demonstrated the ability of late gadolinium enhancement (LGE) to detect microinfarcts in both experimental (Citation15–17) and clinical (Citation4,Citation14,Citation19) settings. A clinical MRI study found no decrease in global left ventricular (LV) function after coronary intervention despite evidence of microinfarcts (Citation19), which may be related to a small size and load of shedded microemboli in this group of patients. In contrast, experimental studies have shown significant decrease in LV function at one hour and one week after embolization (Citation20,Citation21), and this may be due to a larger load and size of microemboli of delivered microemboli. The long-term effects of microemboli on regional LV strain and global LV function in experimental models have not been examined by MRI.
We have previously demonstrated, with the use of large-sized microemboli (100–300 μm), the need for a combination of perfusion and LGE MRI for the detection of microinfarcts at one hour and one week. We recently reported the ability of MRI and CT to detect the effects of microembolization on perfusion and viability (Citation17). However, in patients the sizes of microemboli vary as shown by in-vivo (47–2075 μm) (Citation5,Citation22) and post-mortem (Citation9,Citation23) studies and there is no MRI-data on the acute effects of small-sized microemboli on the combination of perfusion and viability.
Therefore, in this MRI study the aim was to investigate whether coronary microemboli have long-term deleterious effects on LV function. Furthermore, we sought to study whether the perfusion and LGE patterns differ between small (40–120 μm) and large (100–300 μm) microemboli at the acute stage.
Methods
Study design
The Institutional Committee on Animal Research approved the study which followed the Guide for the Care and Use of Laboratory Animals (Citation24). MRI was used to study the short- and long-term effects of microembolization on LV function, perfusion and viability. The animals and the MRI protocol used in this study has previously been described (Citation17). In short, six farm pigs (33 ± 1 kg) underwent baseline MRI before subsequent microembolization. MRI was performed one hour and 7–8 weeks after microembolization for detection of the effects on myocardial function, perfusion and viability (Citation17). The rationale for waiting 7–8 weeks to study the long-term effects of the microinfarcts was based on the healing of homogeneous infarct seen in pigs in previous studies at this time point (Citation25); the scarred lesions are well developed by this time. Animals were anesthetized using a mixture of Isoflurane (2–5%) and Oxygen (2–3 l/min), as previously described (Citation17). An XMR, a hybrid x-ray (Integris V5000, Philips Medical Systems, Best, the Netherlands) and MRI (Achieva I/T) system, was used to place a catheter in the left anterior descending (LAD) artery, to deliver the microemboli and to quantify the LV function. A 3F-catheter (Infusion Catheter: Cook, Chicago, Ill.) was placed distal to the first diagonal of the LAD under x-ray guidance. With the catheter in place the animal was moved to the MR-scanner where an intra-arterial injection of diluted Gd-DOTA (10ml 10%, Dotarem®, Guerbet, France) was performed. LGE imaging immediately after injection was used to delineate the area at risk (AAR) as previously described (Citation26). Remote myocardium was defined as the area not contrast enhanced by the selective injection of Gd-DOTA and hence not perfused by the coronary artery undergoing microembolization. In all pigs, remote myocardium used for quantification was located in the lateral wall. Microembolization was performed through the 3F catheter using an infusion of 250 000 microemboli with a diameter between 40–120 μm (Embosphere®, Biosphere Med, Rockland, MA). The results were compared to previously published results on microembolization using the same experimental setup but a mixture of large (100–300 μm, n∼7200) microemboli (Citation16,Citation20).
MRI
Cine MR-images covering the LV in the short axis view for quantification of regional and global function were acquired using a steady-state free-precession sequence (TR/TE/flip angle = 3.5 ms/ 1.75 ms/70°, spatial resolution 1.0 × 1.0 × 10 mm3, 16 heart phases).
PC-strain MR images for quantification of longitudinal strain were acquired in three long-axis views (2-chamber, 4-chamber and 3-chamber) with a phase contrast velocity encoded fast-field echo sequence (TR/TE/flip angle = 23.4 ms/4.8 ms/15°, spatial resolution 1.6 × 1.6 × 7 mm3, 16 heart phases, VENC = 20 cm/s and blood saturation bands parallel to the imaging plane) (Citation27). The velocity data were obtained in two in-plane directions, anterior-posterior, right-left or feet-head.
Tagged MR images for circumferential strain in the short axis plane were acquired using a tagged turbo-field echo-planar sequence (TR/TE = 35/6.1 ms, flip = 25°, spatial resolution 1.0 × 1.0 × 10 mm3, heart phases = 16, EPI factor = 11, complementary spatial modulation of magnetization with horizontal and vertical tag orientation obtained in one breath hold, line spacing = 8 mm).
First-pass perfusion MR images were acquired during administration of 0.1 mmol/kg Gd-DOTA with an injection rate of 3 ml/min. Four short-axis slices were acquired with a saturation-recovery gradient-echo sequence (TR/TE = 4.5/2.2 ms, α = 20°, image resolution 1.0 × 1.0 × 10 mm3).
LGE-MR images were acquired 5–10 minutes after an additional 0.05 mmol/kg Gd-DOTA injection. A shorter time between contrast injection and LGE acquisition was used because of faster wash-in and wash-out in the microinfarcts as compared to homogeneous infarcts (Citation16,Citation28). Images were acquired in short- and long-axis views encompassing the LV using an inversion recovery gradient echo sequence (TR/TE/flip = 5 ms/2 ms/15°, shot interval = 2RR-intervals, slice thickness = 3 mm, spatial resolution 1.1 × 1.1 × 4 mm3, the inversion time was chosen to null normal myocardium).
Image analysis
MR-images were analyzed using Segment v1.7 (http://segment.heiberg.se) (Citation29) with the exception of tagged MR-images which were analyzed using the HARP software (Diagnosoft Inc, Palo Alto, CA). Cine images were used for measuring the ejection fraction (EF), end-diastolic volume (EDV) and end-systolic volume (ESV) and LV mass by standard delineation of the endocardium and epicardium in end-diastole and end-systole. Systolic wall thickening in percent was quantified by dividing the difference in wall thickness in systole and diastole by the thickness in diastole and multiplying by 100. The mean wall thickening of the region of microinfarcts was calculated and compared to remote and used as a measure of radial strain. PC-strain images were analyzed by a semi-automated method where the myocardial contours are manually drawn on the end-diastolic timeframe followed by an automated myocardial contour tracking (Citation30). A strain tensor was calculated from the velocity information and decomposed into the longitudinal direction for quantification of longitudinal strain (Citation31). Tagging MRI for circumferential strain was quantified as previously described (Citation32).
Cine, Tagging and PC-strain images were correlated with the first-pass perfusion and LGE images to define the regions of microinfarcts and remote myocardium. First-pass perfusion images were used to determine semi-quantitative parameters of perfusion, namely max upslope, peak signal intensity (SI) and time to peak in the LV blood pool, areas of microinfarcts and remote myocardium as previously described (Citation16). The total size of the microinfarcts were quantified on LGE-images by selecting regions with +3SD above the signal intensity of remote myocardium (Citation16).
Post mortem examinations
Animals were euthanized using 40 ml of saturated KCl and the hearts were excised, sliced into 10 mm thick slices and soaked for 15 min in 2% triphenyltetrazolium chloride (TTC). For histopathology, representative formalin-fixed tissue samples were taken from the areas with microinfarcts and remote myocardium before being dehydrated and embedded in paraffin, sliced at 5 μm and stained with hematoxylin-eosin or Masson's trichrome according to standard procedure (Citation33). The histopathology was used to confirm the delivery of microemboli to the target region, and not to the remote myocardium, as well as to establish formation of scarred lesions at 7–8 weeks.
Statistical analysis
Continuous variables are presented as mean ± SEM. All statistical analyses were performed using GraphPad (GraphPad Prism version 5.00 for Windows, GraphPad Software, San Diego, CA). The two-tailed Wilcoxon test was used to determine if variables differed between areas with microinfarcts and remote myocardium between parameters at baseline, one hour and 7–8 weeks after microembolization. The parameters tested were: LV volumes, EF, strain, total microinfarct size as well as the semi-quantitative perfusion parameters (max upslope, time to peak and peak enhancement). The Mann-Whitney test was used to determine whether these parameters differed between animals that received small and large microemboli; as well as comparing LV function in animals with microinfarcts and homogeneous infarcts.
Results
Global LV function
At one hour microemboli caused an acute drop in global LV function as demonstrated by the increased EDV and ESV and decreased EF (). By 7–8 weeks there was a recovery of global LV function. The results regarding global LV function at one hour in animals with microinfarcts (100–300 μm) (Citation20) are inserted for comparison along with results at 7–8 weeks from homogenous infarcts in pigs induced in a similar coronary territory (distal to the second diagonal of the LAD) (Citation25) (). There was no difference in the global LV function parameters at one hour between 40–120 μm and 100–300 μm microemboli. At 7–8 weeks, homogenous infarcts were associated with a more severe decrease in function as compared with microinfarcts (p < 0.05 for all) ().
Table I. Global LV function. *indicates p < 0.05 compared to baseline MRI.
Table II. MRI data from microembolization using a mixture of 100–300 μm sized microemboli (Citation16) and homogenous infarcts caused by a 2-hour ischemia and reperfusion of the LAD at 7–8 weeks (Citation25) for comparison with the data of the present study. *indicates p < 0.05 compared to microinfarcts at 7–8 weeks caused by the 40–120 sized microemboli.
Regional function
Longitudinal strain. Coronary microemboli caused an acute reduction of longitudinal strain in areas with microinfarcts compared to baseline (p < 0.001, peak systolic strain 2.2 ± 2.7% versus −11.5 ± 3.2%, respectively) (). A decline was also found in the remote myocardium (p < 0.001, peak systolic strain −6.8 ± 1.6% versus −13.0 ± 2.2%), suggesting that microembolization has a global effect at one hour. By 7–8 weeks there was a partial recovery of function in areas with microinfarcts (peak systolic strain −8.2 ± 3.1%) and in remote myocardium (peak systolic strain −8.3 ± 1.5%), p < 0.001 for both compared to one hour. In the microinfarcted region there was a minor reduction of longitudinal strain at 7–8 weeks compared to baseline (p < 0.05).
Figure 1. Longitudinal strain over the cardiac cycle decreased from baseline to one hour in both the area with microinfarcts (left) and remote (right) myocardium. There was a partial recovery at 7–8 weeks. *indicates p < 0.05 and ***p < 0.001 compared to baseline.
Circumferential strain. There was a persistent decline in circumferential strain at one hour and 7–8 weeks in areas with microinfarcts compared to baseline (p < 0.001 for both, peak systolic strain −6.7 ± 1.5%, −6.0 ± 1.6% and −14.7 ± 1.3% respectively) (). Similarly, in remote myocardium, circumferential strain demonstrated a decline at both one hour and 7–8 weeks as compared with baseline (p < 0.001 for both, peak systolic strain −12.6 ± 1.5%, −5.8 ± 4.6% and −16.7 ± 1.8% respectively).
Figure 2. Circumferential strain over the cardiac cycle showed a persistent decline over the course of 7–8 weeks in both the area with microinfarcts (left) and remote myocardium (right). ***indicates p < 0.001 compared to baseline.
Systolic wall thickening. At one hour, systolic wall thickening was reduced in areas with microinfarcts and remote myocardium in both the basal, middle and apical slice through the embolized region (). At 7–8 weeks, there was no difference in wall thickening compared to baseline in remote myocardium and a partial recovery of the function in areas with microinfarcts. At 7–8 weeks, wall thickening was decreased in areas with microinfarcts compared to remote myocardium.
Figure 3. Systolic wall thickening in the area with microinfarcts (left) and remote myocardium (right) in three short axis slices through the embolized myocardium. *indicates p < 0.05 compared to baseline and †p < 0.05 compared to the area with microinfarcts within the same slice.
Perfusion. Microinfarcts were detected at one hour as a perfusion defect on first-pass perfusion both visually () and semi-quantitatively (). The maximum upslope was lower in areas with microinfarcts (106.3 ± 11.3 s−1) compared to remote myocardium (166.6 ± 18.3 s−1, p < 0.05), the maximum signal intensity was lower (1164 ± 86 vs. 1683 ± 193, p < 0.05) and the time to peak was longer (25.6 ± 2.3 s vs. 20.4 ± 1.6 s, p < 0.05). As earlier reported (Citation17), no perfusion defect was detected by visual assessment at 7–8 weeks and semi-quantitative parameters revealed a minor decrease in regional perfusion in areas with microinfarcts. The results at one hour were similar to those published earlier for the large microemboli (Citation16).
Figure 4. A. The area at risk for microinfarcts demonstrated on LGE shortly after intra-arterial injection of diluted Gd-DOTA. First-pass perfusion images at one hour (B) and 7–8 weeks (C) in two short-axis planes. The area with microinfarcts can be visualized as a perfusion defect (arrows) at one hour but not 7–8 weeks after microembolization.
Figure 5. First pass perfusion at one hour. There is a significant perfusion decrease at one hour in the microinfarcted territory compared to remote.
Viability. The area at risk (AAR) was 31.9 ± 3.9% LV. At one hour after microembolization, microinfarcts were not visible on LGE and quantitative analysis revealed negligible areas of enhancement (0.1 ± 0.0% LV, 0.0 ± 0.0% AAR) (). However, at 7–8 weeks LGE showed clear differential enhancement in the microembolized region, but not in remote myocardium. The total microinfarct size was 6.6 ± 0.5% of the LV-mass or 21.2 ± 1.7% of the AAR and did not differ from that by the fewer but large-sized microemboli reported previously (Citation16). The patterns of enhancement in microinfarcts differ compared to homogenous infarcts, as different sized microinfarcts were dispersed across the embolized LV wall. The heterogeneous area of scar included patches of viable myocardium ( and ). Thus, the LGE patterns did not differ at one hour or the follow-up phase between small and large microemboli.
Figure 6. LGE images from one animal at one hour (left) and 7–8 weeks (right) after microembolization, A: horizontal long axis, B and C: short-axis. There are no detectable microinfarcts on LGE at one hour but at 7–8 weeks they were clearly visualized as areas of differential enhancement (arrows). The microinfarcts are patchy with interspersed viable myocardium, distributed in the transmural extent of the myocardium and show stripes or tongues of scarred tissue from the epicardium to the endocardium.
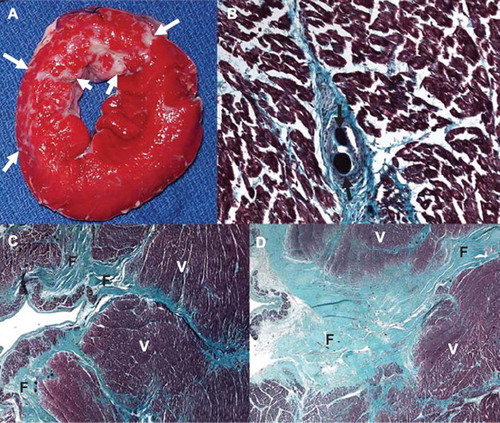
Figure 7. Histochemical and histopathological visualization of the heterogeneous small infarcts caused by microemboli (microinfarcts) and the deposition of microemboli in the coronary vasculature. A. TTC staining of the gross sample showing unstained pale areas (white arrows) corresponding to healed heterogeneous infarcts in the microembolized area. The short axis slice is displayed with the anterior wall up and the septum to the left. B. High power microscopic image from a Masson trichrome staining showing two microemboli (black arrows) trapped in the microvasculature and an organized thrombus surrounding it. C and D. Low power microscopic images showing different sizes of tongues of fibrotic tissue (F) from the epicardium (left) towards the endocardium (right) interspersed with viable tissue (V) stained by Masson trichrome. The difference in fibrotic tissue sizes seen in C and D is most likely related to the differences in diameters of obstructed microvessels.
Pathology
Histochemical staining by TTC at postmortem at 7–8 weeks conformed to the areas of heterogeneous scarring seen grossly (). Histopathology showed patchy dense collagen denoting scar replacing myocardium; microemboli were identified in the perfusion territory. The scarred lesions displayed a similar pattern as previous experiments with large microemboli, namely tongues of collagen (“stripes”) replacing muscle and extending from the epicardium towards the endocardium. Histologically normal remaining muscle was interspersed between the tongues of fibrosis.
Discussion
The new findings of the current study are that: 1) small microemboli (40–120 μm) resulting in microinfarction caused persistent decline in both longitudinal, radial and circumferential strain in the area of microinfarction as determined by PC-strain, cine and tagged MR-imaging, 2) there was an acute effect on regional strain in remote myocardium not subjected to microembolization with partial recovery at 7–8 weeks, 3) the small microemboli inflected severe global LV dysfunction at the acute phase, which completely recovered at 7–8 weeks and 4) perfusion and viability patterns do not differ between smaller and larger sized microemboli.
The acute impairment of the myocardial contractile function has been linked to an inflammatory response and release of cytokines such as tumor necrosis factor (TNF)-α (Citation21,Citation34,Citation35). Interestingly, we found that the decline in regional wall function extended to remote myocardium although the microembolization was performed in a single coronary artery indicating a global effect of microembolization on LV function. The acute changes in remote myocardium could be linked to the concomitant changes in LV dimensions. The long-term effects of microembolization on LV function are probably caused by myocyte and interstitial remodelling resembling ischemic cardiomyopathy (Citation36).
The LGE and first-pass perfusion findings confirm our previous results using large microemboli with no LGE but a severe perfusion defect detected at one hour in microinfarcts. The results are in line with those of Breuckmann et al. where LGE was increasingly detected with longer delays (up to eight hours) in imaging after microembolization (Citation37). This is not surprising as the number of necrotic myocytes increases with the duration of ischemia and in swine the time to reach 50% infarct in the myocardium at risk in a model of homogenous infarction is 37 minutes (Citation38). However, first-pass perfusion discloses a perfusion defect at one hour after microembolization greater than that of the resulting microinfarcts at 7–8 weeks. Thus, the early perfusion defect is not only caused by mechanical obstruction of microvessels by the emboli. The greater perfusion defect at one hour can also be attributed to regional inflammation caused by the microembolization (Citation13). The findings of the present study are consistent with the results from large emboli at subacute imaging (one week) (Citation16). At long-term follow up, the findings of LGE and first-pass perfusion are reversed; LGE is clearly present but the perfusion defect is too subtle to be visualized. However the perfusion defect can be detected by semi-quantitative assessment. Recovery of perfusion has earlier been observed in continuous macroinfarction using perfusion SPECT (Citation39). On the other hand our group demonstrated only limited increase in first-pass MRI perfusion in a porcine model of reperfused infarction although infarct size decreased significantly (Citation40). This illustrates that MRI may be an important tool in future clinical studies when following infarct healing as infarct shrinkage and changes in perfusion can be quantified separately in a serial non-invasive fashion.
Clinical implications
The findings of this experimental study warrant longitudinal studies on viability, perfusion and regional function in patients, for example undergoing coronary interventions for acute coronary syndrome and stable angina. There have been considerable advances in developing devices and therapies for minimizing microembolizaion during coronary intervention and improving microvascular function (Citation1,Citation22,Citation41–44). MRI conceivably could be of use as a comprehensive imaging technique to provide information on the success of these efforts. The results of this study suggest that MRI may have the potential to determine the benefits of these devices and therapies. Distal microembolization causing microinfarcts may be a basis for inadequate flow in the epicardial vessels following apparent successful revascularization in patients treated with PCI for ST-elevation myocardial infarctions (Citation45). This has also been recognized as a potential explanation for the early release of cardiac biomarkers seen when the infarct related artery were revascularized in the subacute phase in the OAT and TOSCA-2 studies (Citation46,Citation47). Early MR-imaging with first-pass perfusion, high resolution LGE and regional function in these patients could provide further insight to the pathophysiology behind this phenomenon (Citation48).
The arrhythmogenic effects of the peri-infarction zone have been addressed in recent studies (Citation49–51). The proposed pathophysiological explanation is that the tissue heterogeneity with re-entrant ventricular tachycardia is promoted in patchy infarcts with interwoven bundles of myocytes as shown in experimental models of reperfused infarcts (Citation52) and patients with ischemic heart disease (Citation49,Citation53). Microembolization in patients may also cause peri-infarction zones around each small focus of microinfarct and therefore these heterogeneous lesions might also be an arrhythmogenic substrate (Citation18). Studies with high resolution LGE in patients at risk for this type of lesion and correlation with arrhythmic events could therefore be of value.
Limitations
In this study exogenous emboli were used and there may be differences in the pathophysiological effects of plaque and thrombus microembolization in patients. However, the histopathological examinations in former studies using the same materials of synthetic microemboli (Citation16,Citation20,Citation54) have shown inflammatory cells in the microembolized tissue and surrounding the microemboli as well as the formation of thrombus with fibrin and blood cells inside the blood vessels. These responses are similar to autopsy findings in patients with microembolization (Citation7,Citation8). This study used young healthy pigs and the results may very well differ in patients with atherosclerotic coronary arteries. For example swine has less collaterals than humans (Citation38). The impact of coronary microembolization in areas of healthy myocardium may differ compared to myocardium with increased collateralization because of stenotic vessels or previously scarred myocardium. Finally, the number of animals was restricted in concordance with the institutional constraint on animal studies. Nonetheless, the findings are consistent in all animals and the numbers are deemed to be sufficient for the aims of the study.
Conclusions
This longitudinal MRI study has demonstrated a persistent, long-term, regional LV dysfunction caused by microembolization and confirmed the need of a combined functional, first-pass perfusion and LGE protocol in the detection of these microinfarcts. These findings suggest that even small microemboli (40–120 μm in diameter), which may escape the distal protective devices influence cardiac function. Furthermore, MRI may have the potential to monitor the results in clinical studies using new devices and therapies in coronary interventions that are aimed to reduce microembolization and the resulting microinfarcts.
Acknowledgements
The work of Dr. Carlsson was supported by grants from the Swedish Heart Association, the Swedish Heart and Lung Foundation, Lund University, the Swedish Society for Medical Research and the Swedish Society of Medicine.
Declaration of interest: The authors report no conflicts of interest. The authors alone are responsible for the content and writing of the paper.
References
- Srinivasan M, Rihal C, Holmes DR, Prasad A. Adjunctive thrombectomy and distal protection in primary percutaneous coronary intervention: Impact on microvascular perfusion and outcomes. Circulation. 2009;119:1311–9.
- Anderson JL, Adams CD, Antman EM, Bridges CR, Califf RM, Casey DE, Jr., . ACC/AHA 2007 guidelines for the management of patients with unstable angina/non-ST-Elevation myocardial infarction: A report of the American College of Cardiology/American Heart Association Task Force on Practice Guidelines (Writing Committee to Revise the 2002 Guidelines for the Management of Patients With Unstable Angina/Non-ST-Elevation Myocardial Infarction) developed in collaboration with the American College of Emergency Physicians, the Society for Cardiovascular Angiography and Interventions, and the Society of Thoracic Surgeons endorsed by the American Association of Cardiovascular and Pulmonary Rehabilitation and the Society for Academic Emergency Medicine. J Am Coll Cardiol. 2007;50:e1–e157.
- Topol EJ, Yadav JS. Recognition of the importance of embolization in atherosclerotic vascular disease. Circulation. 2000; 101:570–80.
- Porto I, Selvanayagam JB, Van Gaal WJ, Prati F, Cheng A, Channon K, . Plaque volume and occurrence and location of periprocedural myocardial necrosis after percutaneous coronary intervention: Insights from delayed-enhancement magnetic resonance imaging, thrombolysis in myocardial infarction myocardial perfusion grade analysis, and intravascular ultrasound. Circulation. 2006;114:662–9.
- Bahrmann P, Werner GS, Heusch G, Ferrari M, Poerner TC, Voss A, . Detection of coronary microembolization by Doppler ultrasound in patients with stable angina pectoris undergoing elective percutaneous coronary interventions. Circulation. 2007;115:600–8.
- Davies MJ, Thomas AC. Plaque fissuring – the cause of acute myocardial infarction, sudden ischaemic death, and crescendo angina. Br Heart J. 1985;53:363–73.
- Davies MJ, Thomas AC, Knapman PA, Hangartner JR. Intramyocardial platelet aggregation in patients with unstable angina suffering sudden ischemic cardiac death. Circulation. 1986;73:418–27.
- Falk E. Unstable angina with fatal outcome: Dynamic coronary thrombosis leading to infarction and/or sudden death. Autopsy evidence of recurrent mural thrombosis with peripheral embolization culminating in total vascular occlusion. Circulation. 1985;71:699–708.
- Saber RS, Edwards WD, Bailey KR, McGovern TW, Schwartz RS, Holmes DR, Jr. Coronary embolization after balloon angioplasty or thrombolytic therapy: An autopsy study of 32 cases. J Am Coll Cardiol. 1993;22:1283–8.
- Charles RG, Epstein EJ, Holt S, Coulshed N. Coronary embolism in valvular heart disease. Q J Med. 1982;51:147–61.
- Kitts D, Bongard FS, Klein SR. Septic embolism complicating infective endocarditis. J Vasc Surg. 1991;14:480–5; Discussion 5–7.
- Takenaka T, Horimoto M, Igarashi K, Yoshie H, Tsujino I, Morihira M. Multiple coronary thromboemboli complicating valvular heart disease and atrial fibrillation. Am Heart J. 1996;131:194–6.
- Heusch G, Kleinbongard P, Bose D, Levkau B, Haude M, Schulz R, . Coronary microembolization: From bedside to bench and back to bedside. Circulation. 2009;120: 1822–36.
- Ricciardi MJ, Wu E, Davidson CJ, Choi KM, Klocke FJ, Bonow RO, . Visualization of discrete microinfarction after percutaneous coronary intervention associated with mild creatine kinase-MB elevation. Circulation. 2001; 103:2780–3.
- Nassenstein K, Breuckmann F, Bucher C, Kaiser G, Konorza T, Schafer L, . How much myocardial damage is necessary to enable detection of focal late gadolinium enhancement at cardiac MR imaging? Radiology. 2008;249:829–35.
- Carlsson M, Wilson M, Martin AJ, Saeed M. Myocardial microinfarction after coronary microembolization in swine: MR imaging characterization. Radiology. 2009;250:703–13.
- Carlsson M, Saloner D, Martin AJ, Ursell PC, Saeed M. Heterogeneous microinfarcts caused by coronary microemboli: Evaluation with multidetector CT and MR imaging in a swine model. Radiology. 2010;254:718–28.
- Appelbaum E, Manning WJ. Science to practice: Can the combination of resting first-pass myocardial perfusion and late gadolinium-enhanced cardiovascular MR imaging help identify myocardial infarction resulting from coronary microembolization? Radiology. 2009 250:609–11.
- Selvanayagam JB, Porto I, Channon K, Petersen SE, Francis JM, Neubauer S, . Troponin elevation after percutaneous coronary intervention directly represents the extent of irreversible myocardial injury: Insights from cardiovascular magnetic resonance imaging. Circulation. 2005;111:1027–32.
- Carlsson M, Martin AJ, Ursell PC, Saloner D, Saeed M. Magnetic resonance imaging quantification of left ventricular dysfunction following coronary microembolization. Magn Reson Med. 2009;61:595–602.
- Skyschally A, Gres P, Hoffmann S, Haude M, Erbel R, Schulz R, . Bidirectional role of tumor necrosis factor-alpha in coronary microembolization: Progressive contractile dysfunction versus delayed protection against infarction. Circulation Res. 2007;100:140–6.
- Angelini A, Rubartelli P, Mistrorigo F, Della Barbera M, Abbadessa F, Vischi M, . Distal protection with a filter device during coronary stenting in patients with stable and unstable angina. Circulation. 2004;110:515–21.
- Schwartz RS, Burke A, Farb A, Kaye D, Lesser JR, Henry TD, . Microemboli and microvascular obstruction in acute coronary thrombosis and sudden coronary death: Relation to epicardial plaque histopathology. J Am Coll Cardiology. 2009;54:2167–73.
- National Research Council. Guide for the care and use of laboratory animals. 7th. Washington DC: National Academy Press; 1996.
- Saeed M, Lee RJ, Weber O, Do L, Martin A, Ursell P, . Scarred myocardium imposes additional burden on remote viable myocardium despite a reduction in the extent of area with late contrast MR enhancement. Eur Radiol. 2006;16:827–36.
- Carlsson M, Saeed M. Intracoronary injection of contrast media maps the territory of the coronary artery: An MRI technique for assessing the effects of locally delivered angiogenic therapies. Acad Radiol. 2008;15: 1354–9.
- Bergvall E, Cain P, Arheden H, Sparr G. A fast and highly automated approach to myocardial motion analysis using phase contrast magnetic resonance imaging. J Magn Reson Imaging. 2006;23:652–61.
- Kim RJ, Chen EL, Lima JA, Judd RM. Myocardial Gd-DTPA kinetics determine MRI contrast enhancement and reflect the extent and severity of myocardial injury after acute reperfused infarction. Circulation. 1996;94:3318–26.
- Heiberg E, Sjogren J, Ugander M, Carlsson M, Engblom H, Arheden H. Design and validation of Segment – freely available software for cardiovascular image analysis. BMC Med Imaging. 2010;10:1.
- Dicks DL, Carlsson M, Heiberg E, Martin A, Saloner D, Arheden H, . Persistent decline in longitudinal and radial strain after coronary microembolization detected on velocity encoded phase contrast magnetic resonance imaging. J Magn Reson Imaging. 2009;30:69–76.
- Bergvall E, Hedstrom E, Bloch KM, Arheden H, Sparr G. Spline-based cardiac motion tracking using velocity-encoded magnetic resonance imaging. IEEE Trans Med Imaging. 2008;27:1045–53.
- Carlsson M, Osman NF, Ursell PC, Martin AJ, Saeed M. Quantitative MR measurements of regional and global left ventricular function and strain after intramyocardial transfer of VM202 into infarcted swine myocardium. Am J Physiol Heart Circ Physiol. 2008;295:H522–32.
- Saeed M, Saloner D, Martin A, Do L, Weber O, Ursell PC, . Adeno-associated viral vector-encoding vascular endothelial growth factor gene: Effect on cardiovascular MR perfusion and infarct resorption measurements in swine. Radiology. 2007;243:451–60.
- Skyschally A, Haude M, Dorge H, Thielmann M, Duschin A, van de Sand A, . Glucocorticoid treatment prevents progressive myocardial dysfunction resulting from experimental coronary microembolization. Circulation. 2004;109: 2337–42.
- Skyschally A, Schulz R, Erbel R, Heusch G. Reduced coronary and inotropic reserves with coronary microembolization. Am J Physiol Heart Circ Physiol. 2002;282:H611–4.
- Ikeda Y, Yutani C, Huang Y, Masuda K, Yuasa T, Kawaguchi O, . Histological remodeling in an ovine heart failure model resembles human ischemic cardiomyopathy. Cardiovasc Pathol. 2001;10:19–27.
- Breuckmann F, Nassenstein K, Bucher C, Konietzka I, Kaiser G, Konorza T, . Systematic analysis of functional and structural changes after coronary microembolization: A cardiac magnetic resonance imaging study. J Am Coll Cardiol Imaging. 2009;2:121–30.
- Hedstrom E, Engblom H, Frogner F, Astrom-Olsson K, Ohlin H, Jovinge S, . Infarct evolution in man studied in patients with first-time coronary occlusion in comparison to different species – implications for assessment of myocardial salvage. J Cardiovasc Magn Reson. 2009;11:38.
- Achilli F, Malafronte C, Lenatti L, Gentile F, Dadone V, Gibelli G, . Granulocyte colony-stimulating factor attenuates left ventricular remodelling after acute anterior STEMI: Results of the single-blind, randomized, placebo-controlled multicentre STem cEll Mobilization in Acute Myocardial Infarction (STEM-AMI) Trial. Eur J Heart Fail. 2010;12:1111–21.
- Saeed M, Martin A, Ursell P, Do L, Bucknor M, Higgins CB, . MR Assessment of myocardial perfusion, viability, and function after intramyocardial transfer of VM202, a new plasmid human hepatocyte growth factor in ischemic swine myocardium. Radiology. 2008;243:451–60.
- Svilaas T, Vlaar PJ, van der Horst IC, Diercks GF, de Smet BJ, van den Heuvel AF, . Thrombus aspiration during primary percutaneous coronary intervention. New Engl J Med. 2008;358:557–67.
- Grube E, Gerckens U, Yeung AC, Rowold S, Kirchhof N, Sedgewick J, . Prevention of distal embolization during coronary angioplasty in saphenous vein grafts and native vessels using porous filter protection. Circulation. 2001;104:2436–41.
- Okamura A, Ito H, Iwakura K, Kawano S, Inoue K, Maekawa Y, . Detection of embolic particles with the Doppler guide wire during coronary intervention in patients with acute myocardial infarction: Efficacy of distal protection device. J Am Coll Cardiol. 2005;45:212–5.
- Haeck JD, Koch KT, Bilodeau L, Van der Schaaf RJ, Henriques JP, Vis MM, . Randomized comparison of primary percutaneous coronary intervention with combined proximal embolic protection and thrombus aspiration versus primary percutaneous coronary intervention alone in ST-segment elevation myocardial infarction: The PREPARE (PRoximal Embolic Protection in Acute myocardial infarction and Resolution of ST-Elevation) study. JACC Cardiovasc Interv. 2009;2:934–43.
- Fokkema ML, Vlaar PJ, Vogelzang M, Gu YL, Kampinga MA, de Smet BJ, . Effect of high-dose intracoronary adenosine administration during primary percutaneous coronary intervention in acute myocardial infarction: A randomized controlled trial. Circ Cardiovasc Interv. 2009; 2:323–9.
- Dzavik V, Buller CE, Lamas GA, Rankin JM, Mancini GB, Cantor WJ, . Randomized trial of percutaneous coronary intervention for subacute infarct-related coronary artery occlusion to achieve long-term patency and improve ventricular function: The Total Occlusion Study of Canada (TOSCA)-2 trial. Circulation. 2006;114:2449–57.
- Hochman JS, Lamas GA, Buller CE, Dzavik V, Reynolds HR, Abramsky SJ, . Coronary intervention for persistent occlusion after myocardial infarction. New Engl J Med. 2006;355:2395–407.
- Taylor AJ, Al-Saadi N, Abdel-Aty H, Schulz-Menger J, Messroghli DR, Gross M, . Elective percutaneous coronary intervention immediately impairs resting microvascular perfusion assessed by cardiac magnetic resonance imaging. Am Heart J. 2006;151:891 e1–7.
- Yan AT, Shayne AJ, Brown KA, Gupta SN, Chan CW, Luu TM, . Characterization of the peri-infarct zone by contrast-enhanced cardiac magnetic resonance imaging is a powerful predictor of post-myocardial infarction mortality. Circulation. 2006;114:32–9.
- Schmidt A, Azevedo CF, Cheng A, Gupta SN, Bluemke DA, Foo TK, . Infarct tissue heterogeneity by magnetic resonance imaging identifies enhanced cardiac arrhythmia susceptibility in patients with left ventricular dysfunction. Circulation. 2007;115:2006–14.
- Schuleri KH, Centola M, George RT, Amado LC, Evers KS, Kitagawa K, . Characterization of peri-infarct zone heterogeneity by contrast-enhanced multidetector computed tomography: A comparison with magnetic resonance imaging. J Am Coll Cardiol. 2009;53:1699–707.
- Karagueuzian HS, Fenoglio JJ, Jr., Weiss MB, Wit AL. Protracted ventricular tachcardia induced by premature stimulation of the canine heart after coronary artery occlusion and reperfusion. Circulation Res. 1979;44:833–46.
- de Bakker JM, van Capelle FJ, Janse MJ, Wilde AA, Coronel R, Becker AE, . Reentry as a cause of ventricular tachycardia in patients with chronic ischemic heart disease: Electrophysiologic and anatomic correlation. Circulation. 1988; 77:589–606.
- Dorge H, Neumann T, Behrends M, Skyschally A, Schulz R, Kasper C, . Perfusion-contraction mismatch with coronary microvascular obstruction: Role of inflammation. Am J Physiol Heart Circ Physiol. 2000;279: H2587–92.