
Abstract
Objectives. Myocardial scar will lead to heterogeneous left ventricular deformation. We hypothesized that a myocardial scar will display an elevated standard deviation (SD) of phase and that this effect could be compared with mechanical dispersion. Design. Thirty patients (three women and 27 men) were investigated over 4–8 weeks after ST-elevation myocardial infarction treated with percutaneous coronary intervention. Seventeen had a scar area > 75% in at least one antero- or inferoseptal segment (scar) and 13 had a scar area < 1% (non-scar). The phase delays of velocity, displacement, and strain were measured in the longitudinal direction, tangential to the endocardial outline, and in the radial direction, perpendicular to the tangent. Results. The SD of phase in radial measurements differentiated scar patients from those without scar (p < 0.01), while longitudinal measurements did so only for longitudinal strain. Likewise, the SD for radial measurements of time to peak for segmental velocity, displacement, and strain performed better than longitudinal measurements and equal to the results of phase. Conclusion. Phase dispersion in deformation imaging may be used for detecting heterogeneous left ventricular contraction.
Introduction
Amplitude, time to peak (TPk) amplitude, and phase delay are features that accurately describe the deformation pattern of the left ventricle. A normal left ventricle has been demonstrated to have homogeneous deformation (Citation1). In a scarred left ventricle, heterogeneous deformation due to delayed electrical activation and contractile dysfunction may be seen (Citation2). In addition, tethering effects of segments close to the scar will also affect the deformation pattern (Citation1,Citation3). In daily practice, deformation of the left ventricular (LV) wall is most often evaluated by visual inspection only (Citation4). In such assessment, the human eye integrates amplitude and timing of the contracting LV segments (Citation5). Temporal differences in the pattern of deformation may be seen as asynchronous wall motion, or, when measured in terms of velocity, displacement, or strain, expressed as the standard deviation (SD) of the TPk value of these measurements. An increase in the temporal difference between segments has been described as “mechanical dispersion” (Citation2,Citation6). Reduced and delayed wall deformation as a consequence of acute and chronic myocardial ischemia is known to increase the risk for arrhythmia (Citation2,Citation6,Citation7). Various methods have been devised to objectively detect wall motion abnormalities (Citation8–12), but their clinical application has been limited.
Phase analysis has been used in, for example, cardiac-gated single photon emission computed tomography or SPECT to assess wall motion in patients who were candidates for cardiac resynchronization therapy (Citation7). Phase analysis has also been applied in echocardiographic deformation imaging (Citation13). We have previously reported on the use of a prototype feature tracking software adapted for cine magnetic resonance imaging (MRI) (2D CPA MR® – Cardiac Performance Analysis, version 1.0 b 081002 Tomtec Imaging Systems GmbH, Unterschleissheim, Germany), which also incorporates a phase analysis algorithm. This algorithm calculates phase delay per segment in either milliseconds (ms) or as a percentage of the cardiac cycle time, phase% (, , and ) (Citation14). Previous publications have focused on the issue of the measured parameter, that is, strain, displacement, or velocity. When the concept of mechanical dispersion was launched, it was natural to investigate if another measure of timing, that is, analysis of phase, in some way could be used to obtain additional information from cine MRI.
Figure 1. Viewport with strain curves from a patient with anteroapical infarction. Radial strain upper right and longitudinal strain lower right. Blue fields to the left display segmental values and green horseshoes in the middle display phase per segment.
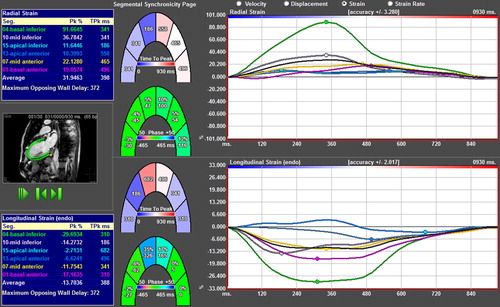
Figure 2. Principle of phase delay. The sine function is identical to the cosine function but delayed by п/2, or 25% of the cycle length.
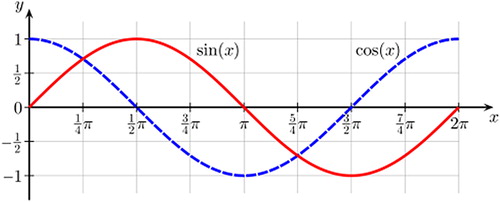
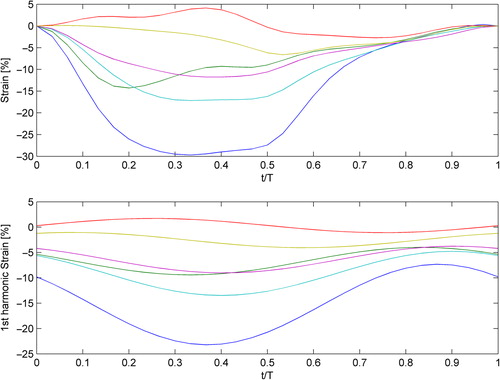
Figure 3. Enlargement of the six strain curves of the patient in (above), with their respective phase curves (below). Image courtesy of Professor Gianni Pedrizetti.
The deformation of a cardiac wall segment can be described as a time-varying periodic function whose main timing content can be modeled by a sinusoidal wave with a phase difference in relation to other periodic functions (). The fit between the real function and the sinusoidal model is far from perfect but may be the best representation for mathematical analysis. In the present study, we have measured the phase in scar- and non-scar patients using the first harmonic of velocity, displacement, and strain, which carries information from the entire RR interval and not only from the peak of the curve. Phase% is in this setting phase in relation to the mean deformation of the six segments of the slice, corrected for the duration of the RR interval. depicts a sine and a cosine function with a delay of π/2 radians, which equals 25% of the cycle time.
The aim of the present study was to assess whether the SD of phase% of velocity, displacement, and strain might detect heterogeneous LV wall deformation caused by myocardial scar and to compare with analysis based on the SD of TPk.
Materials and methods
Study population
Thirty patients (3 women and 27 men, age: 62 ± 11 years, height: 177 ± 7 cm, and weight: 85 ± 11 kg) were selected based on the presence or absence of extensive myocardial scar in anteroseptal and inferoseptal segments (Citation15). These patients were recruited between February 2006 and September 2007 as part of a larger study assessing primary percutaneous coronary intervention (PCI) for ST-elevation myocardial infarction and they agreed to return for infarct size determination with MRI 6 ± 2 weeks after primary PCI. Seventeen patients with scar area > 75% in at least one segment (scar patients) and 13 without scar in any part of the myocardium were selected (non-scar patients). None of them had bundle branch block on resting 12-lead electrocardiogram (ECG) (mean QRS duration was 97 ms in scar patients and 92 ms in non-scar patients). Additional coronary stenoses not dilated at the index event were seen in seven of the 17 scar patients and in two of the 13 non-scar patients. Three patients in the scar group had a history of previous myocardial infarction. Two of these and one patient in the non-scar group had undergone PCI earlier. None of the patients underwent coronary artery bypass graft surgery (CABG). Initial exclusion criteria were unwillingness to participate in the study or issues related to performing MRI such as pacemaker, atrial fibrillation, and claustrophobia.
The study was approved by the Regional Ethical Review Board in Linköping, Sweden, and adhered to Good Clinical Practice as set forth in the Declaration of Helsinki. Written informed consent was obtained from all patients after the nature of the procedure had been fully explained. The study was registered in the EMEA database as EudraCT 2005-001529-27.
MR imaging
Contrast-enhanced cardiac MRI was performed on a Philips 1.5T Achieva Nova Dual scanner (Philips Medical Systems, Best, the Netherlands) using a five-element cardiac synergy surface coil. ECG-triggered MR images were obtained during repeated breath-holding. Cine MRI was performed with a balanced steady-state free precession turbo field-echo or b-SSFP TFE sequence and covered the entire left ventricle with an average of 19 (range, 17–25) short-axis and three apical long-axis slices (2-, 3-, and 4- chamber views). Slice thickness was 10 mm and slice gap was − 5 mm. Temporal resolution ranged between 26 and 41 ms (30 acquired phases). The contrast-enhanced images were acquired at the same slice positions as the cine images, about 20 min after the administration of gadopentetate dimeglumine or Gd-DTPA: 0.2 mmol/kg bodyweight (Schering Nordiska AB, Järfälla, Sweden). The inversion recovery TFE (IR-TFE) sequence was a segmented 3D spoiled gradient echo sequence with echo time or TE = 1.3 ms, repetition time or TR = 4.4 ms, and TFE factor 43, leading to an acquisition phase time of 188 ms acquired during diastole.
Infarct size and transmurality
Myocardial scar was visualized with the late gadolinium enhancement (LGE) technique. Infarct size was determined in milliliters and as a percentage of LV mass from the stack of short-axis images, using “Segment,” (http://segment.heiberg.se) (Citation16). “Segment” utilizes an algorithm that not only evaluates the signal intensity compared with a remote area but also accounts for partial volume effects by weighting the contribution of voxels in the “gray” area surrounding the central parts of scar. The algorithm was tested in a computer model and in experimental infarction in animals, and was applied to clinical patient cases (Citation17). A scar segment was defined as any segment with LGE-positive area > 1% of the segmental area. Since the main analysis of phase% and TPk was performed on long-axis cine views, the transmural extent of scar (scar area per segment and for the entire slice) was determined on long-axis slices positioned identically to those used for cine, to achieve an optimal co-registration of the data.
Analysis of left ventricular size, function, phase, and time-to-peak
LV volume and EF were measured on cine loops from the short-axis orientation using ViewForum® software (Philips Healthcare, Philips Extended MR Workspace, version 2.6.6.3, Eindhoven, the Netherlands). Velocity, displacement, and strain of LV segments as well as segmental TPk and phase delay were determined with the 2D-CPA-MR software from DICOM images recorded in the long-axis view and converted to .avi files. The LV endocardium and epicardium were outlined manually in diastole, followed by software tracking of the deformation of the wall throughout the cardiac cycle (Citation18). The LV myocardium was divided into six segments in each of the three long-axis views, giving a total of 18 segments (six in each level, base-mid-apex). The tracing of the myocardium was repeated three times and the mean value of the SD of phase% and TPk was used. Velocity, displacement, and strain were calculated tangential to the endocardial outline (“longitudinal”) and perpendicular to the tangent (“radial”). The segmental delay TPk value was displayed for each of the six segments per long-axis view (blue boxes of ). The average SD of phase% was computed for each apical view. Since the three views of each patient are independent, the root sum square (RSS) of the SD of phase% was calculated per subject and compared with the RSS of the SD of TPk.
Reproducibility
The long-axis recordings of 10 patients (five scar and five non-scar) were analyzed by two independent observers performing three repeated segmentations on three views. For intraobserver analysis, three measurements on three views were available for all 30 patients (180 data points). Analysis of short-axis recordings was done only for comparison of reproducibility and was based on three repeated measurements of three short-axis slices (one for each level base-mid-apex) from five scar and five non-scar patients, by two observers.
Statistical analysis
Statistical analyses were performed using SPSS 16.0 (SPSS Inc., Chicago, Illinois, USA) as well as Statistica 8.0 (Statsoft Inc, Tulsa, Oklarhoma, USA). The variables did not deviate from normality, allowing parametric tests to be used. Paired and unpaired two-tailed Student's t-tests were used along with analysis of variance or ANOVA (followed by Duncan's test in case of significance). Receiver-operating characteristic (ROC) curves were constructed using MedCalc® Version 6.10 (MedCalc Software, Mariakerke, Belgium). Intra- and interobserver variabilities of phase% and TPk were expressed according to Dahlberg (Citation19) and Bland-Altman (Citation20) and as intraclass correlation coefficient (ICC).
Results
Left ventricular scar size, volume, and LVEF
In scar patients, the size of the scar was on average 31 ± 12 ml or 17 ± 8% of the LV myocardium. LV end-diastolic volumes (LVEDV) and end-systolic volumes (LVESV) were significantly larger and LVEF was lower in the scar group compared with those in the non-scar group ().
Table I. Cardiac function and scar size.
Scar area per view and per segment
In the scar group, scar area was 29.9 ± 9.9% (range: 7–45%) in the four-chamber view, 37.5 ± 10.4% (range: 13–51%) and 35.3 ± 8.8% (range: 19–48%) in the two-chamber and in the three-chamber views, respectively. Expressed per segment, scar area exceeded 50% in 35% of the segments of the scar patients (). Significant gadolinium uptake was not seen in the non-scar group.
Difference in phase% between scar and non-scar patients
The average SD of phase% per view as well as total RSS_SD-phase% per subject is shown in , left panels. In the radial direction, average SD for phase% was significantly higher for scar versus non-scar for velocity, displacement, and strain in all views except for strain in the apical four-chamber view, (p < 0.001 for all). Average SD for phase% in the longitudinal direction showed no difference between scar and non-scar for velocity and displacement but was significant for strain in the apical two-and three-chamber views.
Figure 4. Graphical display of the SD of phase and TPk in patients with and without myocardial scar. Left: Phase% delay, average SD for three apical views and RSS per patient for strain (upper), velocity (middle), and displacement (lower panel). Radial measurements left, longitudinal right. Slashed bars denote scar patients and solid black bars denote patients without scar. Right: Average SD for TPk and RSS_SD-TPk for the same measurements.
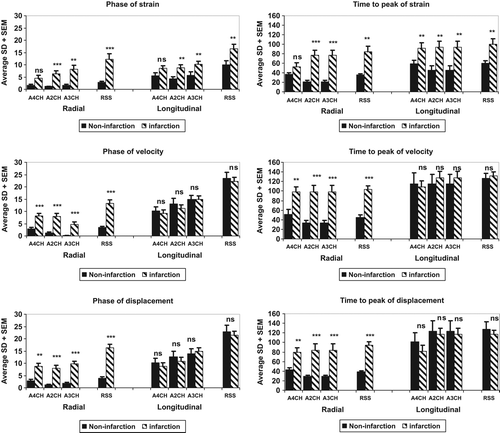
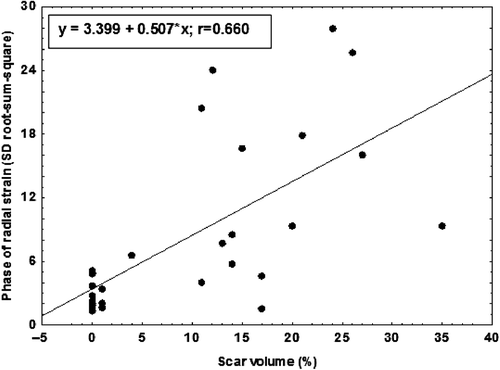
RSS_SD-phase% in the radial direction (three apical views per subject taken together) was significantly higher for scar versus non-scar patients (p < 0.001 for velocity and displacement, p < 0.01 for strain). RSS_SD-phase% in the longitudinal direction was significant only for strain (p < 0.01) (). Using a cutoff of 5.2% of RSS_SD-phase% of radial strain, scar patients with 76% sensitivity and 100% specificity were identified. The RSS_SD-phase% for radial velocity, displacement, and strain correlated with the size of myocardial scar (strain is shown in ).
Figure 5. Relationship between radial strain RSS_SD-phase% and scar volume. The correlation is y = 3.399 + 0.507*x; r = 0.660.
Difference in TPk between scar and non-scar patients
The SD of TPk for velocity, displacement, and strain in the radial direction (RSS, composite of all three views) was 103, 95, and 85 ms for scar patients and 44, 39, and 36 ms for non-scar patients , respectively (). This difference was significant for all three measures, but in the longitudinal direction, only strain displayed a statistically significant difference between scar and non-scar patients.
Using a cutoff of 50 ms for the RSS_SD-TPk of radial strain, as suggested for echocardiographic longitudinal strain by Haugaa et al (Citation2), scar patients with 85% sensitivity and 92% specificity were identified.
ROC analysis of phase% and TPk for the detection of myocardial scar
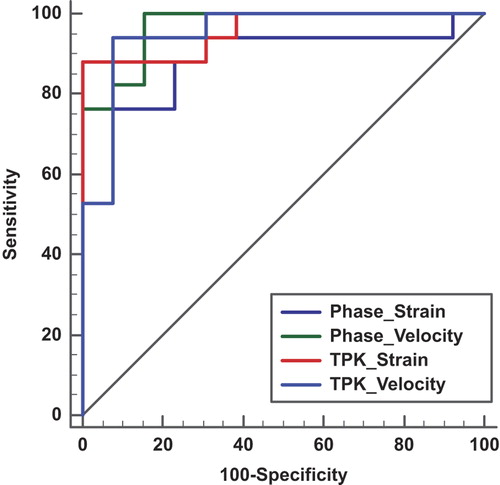
Displacement, velocity, and strain are all interconnected and in this study based on the same segmentation and tracking session. In univariate analysis, SD of phase% and SD of TPk for velocity and strain in the radial direction performed best. All four had values for area under the curve (AUC) > 0.9 for the detection of scarred segments. In DeLong pairwise testing, the difference in AUC was not significant for any of the four measures. The best value was obtained for radial velocity with AUCtpk-sd 0.95 and AUCphase-sd 0.97 ().
Figure 6. AUC for the detection of scar in a patient-based analysis using RSS_SD-phase% for radial strain (Ph_rad_strain_SD, AUC = 0.9) and radial velocity (Ph_Rad_Vel_SD, AUC = 0.968) compared with RSS_SD-TPk for radial strain (TPK_Rad_Strain_SD, AUC = 0.959) and radial velocity (TPK_Rad_Vel_SD, AUC = 0.95). There is no significant difference between the four curves, when analyzed according to DeLong.
Intraobserver variability
Intraobserver variability, based on all 30 patients’ three views and three measurements (intra_SD for long axis segmentation, ), was expressed as the coefficient of variation (COV) of a single determination calculated from two successive differences according to Dahlberg (Citation19). This figure was lowest for radial velocity and radial displacement (24% and 23%) but higher in the longitudinal direction and for radial and longitudinal strain.
Table II. Intra- and interobserver variability from the long- and short-axis views.
Since the three views constitute independent samples, the RSS was also calculated (intra_RSS), which had a COV of 16–18% for velocity and displacement, and 25% for strain ().
For comparison, intra_SD for short axis measurements of strain only (10 patients, three slices, three measurements, two observers) showed radial COV 44% and circumferential COV 62%. Intra_RSS was higher than that for long-axis segmentations, radial COV being 32% and circumferential being 36%.
Interobserver variability
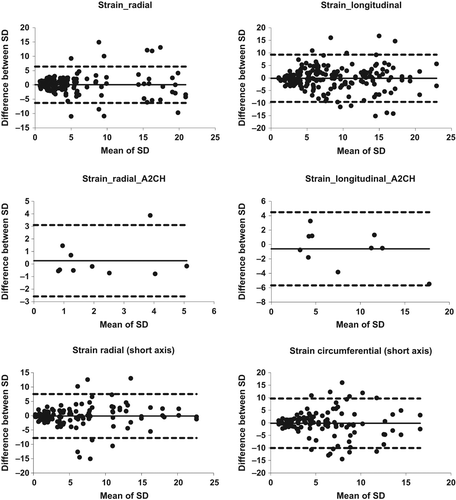
Interobserver variability of phase%, determined from an average of three measurements for each observer (inter-SD for the long axis in ), showed little difference between radial and longitudinal measurements: COV 17% for both radial velocity and displacement, while radial strain had higher COV 44% than longitudinal strain, which had COV 22% (). Interobserver variability showed no apparent difference between smaller and larger absolute values, as can be seen from the Bland–Altman plot ().
In short-axis segmentations, inter_SD had radial COV of 47% and circumferential COV of 49% ().
All measurements have also been calculated as ICCs and according to Dahlberg (Citation19) ().
Bland–Altman diagrams were created but are only shown for strain (). Intraobserver variability has identical limits of agreement for long-axis segmentation (upper two panels) and short-axis segmentation (lower two panels). Interobserver Bland–Altman was calculated for the apical two-chamber view to illustrate the effect of averaging three measurements, which had about half the limit of agreement as the individual measurements (middle panels).
Discussion
The focus in deformation imaging has been on the size of the measurement, regardless of whether it has been obtained from tissue Doppler, speckle tracking echocardiography, or tagging MRI. This is the first study to evaluate phase differences obtained from deformation as the basis for detecting myocardial scar. The deformation of a myocardial segment is a complicated summation of shortening in the fiber direction, cross-fiber shortening, the interaction of fibers of different angles, and effects of the extracellular matrix (Citation21). We found a very low phase difference in hearts without scar indicating homogeneous deformation (). In patients with scar, the difference in the SD of phase% in the radial direction increased threefold and in the SD of TPk twofold, possibly due to post-systolic shortening (Citation22) or early systolic lengthening (Citation23). An increased phase difference, as detected in our study, expresses heterogeneous contraction, which has been previously connected with an increased risk of malignant arrhythmia (Citation2, Citation24, Citation25). Analysis of phase from plain cine MRI may thus add an objective measure and improve the large intra- and interobserver variation of visual assessment that has been documented for MRI (Citation26) as well as for echocardiography (Citation27).
Speckle tracking in echocardiography tracks the longitudinal direction better than the radial, possibly due to a low lateral resolution (Citation28). The 2D-CPA-MR software used in this study showed COV for phase% that was similar in both the radial and longitudinal directions. However, in terms of ICC, the radial direction had lower variability. Hypothetically, the large contrast between the myocardium and the signal from blood in the ventricular cavity facilitates 1D-tracking perpendicular to the outline of the endocardium, as explained by Hor et al (Citation18), while tracking longitudinal deformation relies on detecting features in the myocardium analogous to echocardiographic speckles (“2D-tracking”). Nevertheless, even if reproducibility is important, the ability to discriminate between scar and non-scar patients is the final clinical test. In that respect, phase displayed a larger difference between scar and non-scar individuals than TPk. Furthermore, even if COV was lowest for velocity and displacement, strain was the only parameter that could separate scar from non-scar in the longitudinal direction.
Despite several limitations in the present study, 5.2% of RSS_SD-phase% of radial strain identified patients with scar with 76% sensitivity and 100% specificity. Using analysis of TPk, a cutoff of RSS_SD-TPk of 50 ms for radial strain had 85% sensitivity and 92% specificity for the detection of scar patients. We have previously shown that measurements of velocity, displacement, and peak systolic strain in the radial direction by MRI were able to differentiate segments with varying extent of scar (Citation14). The most accurate information was obtained by measurements of radial strain in that study. In the present patient-based analysis, phase% or TPk of radial velocity and strain performed equally in the identification of scar. Future studies should investigate if phase analysis could add important information about the propensity for life-threatening arrhythmia in patients at risk or possibly give additional information if added to a composite measure of amplitude and timing of deformation.
Reproducibility
Previous publications have been concerned with the reproducibility of feature tracking (Citation29). Based on the reproducibility of data obtained from healthy volunteers, Morton et al. recommended the use of circumferential strain, which had a lower COV than longitudinal or radial strain. In the present patient cohort, we could not confirm this advantage of circumferential measurements for the analysis of phase, either when using single determinations or when using an average of three tracings. Our data show that averaging three measurements as expected reduces variability (), in line with a current publication on the use of feature tracking for atrial function (Citation30).
Limitations
This study was performed as proof of concept on a small number of patients. The analysis of phase or TPk needs to be applied also on scar patients with different degrees of transmurality and preferably in larger patient samples since the phase% of wall deformation in patients with subendocardial scar might be different from those with transmural scar. Additionally, extensive scar within one slice could possibly lead to similar phase delays in several segments effectively eliminating any differences in phase% between segments. In a comparison of measurements derived from the short-axis compared with those from the long-axis, we chose to use COV of the individual measurements, but a complete ROC analysis would have been preferable. Furthermore, the temporal resolution of MRI cine is of concern. Echocardiographic speckle tracking accepts temporal resolution as low as 38 fps, which is within the range achieved with this time-averaged cine cardiac magnetic resonance or CMR. We therefore believe that the temporal resolution in our study is apparently sufficient for detecting temporal dispersion with strain and displacement while the highest velocities might be missed. Lastly, some patients had additional stenoses that were not dilated at primary PCI. We found it unlikely that they would have caused stunning and additional phase delay since the patients were free from symptoms of ischemia.
Conclusions
MRI feature tracking with phase analysis is able to detect heterogeneous myocardial deformation that closely follows the presence of transmural scar. Further studies are needed for determining the predictive value of this finding as an indicator of the risk for malignant arrhythmia in individual patients.
Acknowledgements
We gratefully acknowledge Johan Kihlberg, RN, and the MRI technicians at CMIV for scanning the patients and Elisabeth Logander, RN, for coordinating patient recruitment. Professor Gianni Pedrizzetti, University of Trieste, and Rolf Baumann, chief technology officer of Tomtec, provided fruitful discussions on issues regarding phase.
Funding
Futurum – the Academy for healthcare, Jonkoping County Council [grant 5339], the Swedish Heart Lung Foundation [grant 20120449], the Medical Research Council of Southeast Sweden [grant 4138], and CMIV, Linkoping University.
Financial disclosures
None.
Declaration of interest: The authors report no declarations of interest. The authors alone are responsible for the content and writing of the paper.
References
- Edvardsen T, Gerber BL, Garot J, Bluemke DA, Lima JA, Smiseth OA. Quantitative assessment of intrinsic regional myocardial deformation by Doppler strain rate echocardiography in humans: validation against three-dimensional tagged magnetic resonance imaging. Circulation. 2002;106: 50–6.
- Haugaa KH, Smedsrud MK, Steen T, Kongsgaard E, Loennechen JP, Skjaerpe T, et al. Mechanical dispersion assessed by myocardial strain in patients after myocardial infarction for risk prediction of ventricular arrhythmia. JACC Cardiovasc Imaging. 2010;3:247–56.
- Force T, Kemper A, Perkins L, Gilfoil M, Cohen C, Parisi AF. Overestimation of infarct size by quantitative two-dimensional echocardiography: the role of tethering and of analytic procedures. Circulation. 1986;73:1360–8.
- Blondheim DS, Beeri R, Feinberg MS, Vaturi M, Shimoni S, Fehske W, et al. Reliability of visual assessment of global and segmental left ventricular function: a multicenter study by the Israeli Echocardiography Research Group. J Am Soc Echocardiogr. 2010;23:258–64.
- Kvitting JP, Wigstrom L, Strotmann JM, Sutherland GR. How accurate is visual assessment of synchronicity in myocardial motion? An In vitro study with computer-simulated regional delay in myocardial motion: clinical implications for rest and stress echocardiography studies. J Am Soc Echocardiogr. 1999;12:698–705.
- Nagueh SF. Mechanical dyssynchrony in congestive heart failure: diagnostic and therapeutic implications. J Am Coll Cardiol. 2008;51:18–22.
- Atchley AE, Trimble MA, Samad Z, Shaw LK, Pagnanelli R, Chen J, et al. Use of phase analysis of gated SPECT perfusion imaging to quantify dyssynchrony in patients with mild-to-moderate left ventricular dysfunction. J Nucl Cardiol. 2009;16:888–94.
- Amundsen BH, Crosby J, Steen PA, Torp H, Slordahl SA, Stoylen A. Regional myocardial long-axis strain and strain rate measured by different tissue Doppler and speckle tracking echocardiography methods: a comparison with tagged magnetic resonance imaging. Eur J Echocardiogr. 2009;10: 229–37.
- D’Hooge J, Heimdal A, Jamal F, Kukulski T, Bijnens B, Rademakers F, et al. Regional strain and strain rate measurements by cardiac ultrasound: principles, implementation and limitations. Eur J Echocardiogr. 2000;1:154–70.
- Madler CF, Payne N, Wilkenshoff U, Cohen A, Derumeaux GA, Pierard LA, et al. Non-invasive diagnosis of coronary artery disease by quantitative stress echocardiography: optimal diagnostic models using off-line tissue Doppler in the MYDISE study. Eur Heart J. 2003;24:1584–94.
- Osman NF, Prince JL. Regenerating MR tagged images using harmonic phase (HARP) methods. IEEE Trans Biomed Eng. 2004;51:1428–33.
- Ryf S, Spiegel MA, Gerber M, Boesiger P. Myocardial tagging with 3D-CSPAMM. J Magn Reson Imaging. 2002;16: 320–5.
- Breithardt OA, Stellbrink C, Kramer AP, Sinha AM, Franke A, Salo R, et al. Echocardiographic quantification of left ventricular asynchrony predicts an acute hemodynamic benefit of cardiac resynchronization therapy. J Am Coll Cardiol. 2002;40:536–45.
- Maret E, Todt T, Brudin L, Nylander E, Swahn E, Ohlsson JL, Engvall JE. Functional measurements based on feature tracking of cine magnetic resonance images identify left ventricular segments with myocardial scar. Cardiovasc Ultrasound. 2009;7:53.
- Cerqueira MD, Weissman NJ, Dilsizian V, Jacobs AK, Kaul S, Laskey WK, et al. Standardized myocardial segmentation and nomenclature for tomographic imaging of the heart: a statement for healthcare professionals from the Cardiac Imaging Committee of the Council on Clinical Cardiology of the American Heart Association. Circulation. 2002;105: 539–42.
- Heiberg E, Sjogren J, Ugander M, Carlsson M, Engblom H, Arheden H. Design and validation of Segment–freely available software for cardiovascular image analysis. BMC Med Imaging. 2010;10:1.
- Heiberg E, Ugander M, Engblom H, Gotberg M, Olivecrona GK, Erlinge D, Arheden H. Automated quantification of myocardial infarction from MR images by accounting for partial volume effects: animal, phantom, and human study. Radiology. 2008;246:581–8.
- Hor KN, Baumann R, Pedrizzetti G, Tonti G, Gottliebson WM, Taylor M, et al. 2011. Magnetic resonance derived myocardial strain assessment using feature tracking. J Vis Exp. 2011:2356.
- Dahlberg G. Statistical methods for medical and biological students. 2nd edn. London: George Allen & Unwin Ltd; 1940.
- Bland JM, Altman DG. Statistical methods for assessing agreement between two methods of clinical measurement. Lancet. 1986;1:307–10.
- MacGowan GA, Shapiro EP, Azhari H, Siu CO, Hees PS, Hutchins GM, et al. Noninvasive measurement of shortening in the fiber and cross-fiber directions in the normal human left ventricle and in idiopathic dilated cardiomyopathy. Circulation. 1997;96:535–41.
- Ryf S, Rutz AK, Boesiger P, Schwitter J. Is post-systolic shortening a reliable indicator of myocardial viability? An MR tagging and late-enhancement study. J Cardiov Magn Reson. 2006;8:445–51.
- Zahid W, Eek CH, Remme EW, Skulstad H, Fosse E, Edvardsen T. Early systolic lengthening may identify minimal myocardial damage in patients with non-ST-elevation acute coronary syndrome. Eur Heart J Cardiovasc Imaging. 2014;15: 1152–60.
- Haugaa KH, Amlie JP, Berge KE, Leren TP, Smiseth OA, Edvardsen T. Transmural differences in myocardial contraction in long-QT syndrome: mechanical consequences of ion channel dysfunction. Circulation. 2010;122:1355–63.
- Sarvari SI, Haugaa KH, Anfinsen OG, Leren TP, Smiseth OA, Kongsgaard E, et al. Right ventricular mechanical dispersion is related to malignant arrhythmias: a study of patients with arrhythmogenic right ventricular cardiomyopathy and subclinical right ventricular dysfunction. Eur Heart J. 2011;32:1089–96.
- Paetsch I, Jahnke C, Ferrari VA, Rademakers FE, Pellikka PA, Hundley WG, et al. Determination of interobserver variability for identifying inducible left ventricular wall motion abnormalities during dobutamine stress magnetic resonance imaging. Eur Heart J. 2006;27:1459–64.
- Hoffmann R, Lethen H, Marwick T, Arnese M, Fioretti P, Pingitore A, et al. Analysis of interinstitutional observer agreement in interpretation of dobutamine stress echocardiograms. J Am Coll Cardiol. 1996;27:330–6.
- Amundsen BH, Helle-Valle T, Edvardsen T, Torp H, Crosby J, Lyseggen E, et al. Noninvasive myocardial strain measurement by speckle tracking echocardiography: validation against sonomicrometry and tagged magnetic resonance imaging. J Am Coll Cardiol. 2006;47:789–93.
- Morton G, Schuster A, Jogiya R, Kutty S, Beerbaum P, Nagel E. Inter-study reproducibility of cardiovascular magnetic resonance myocardial feature tracking. J Cardiovasc Magn Reson. 2012;14:43.
- Kowallick JT, Kutty S, Edelmann F, Chiribiri A, Villa A, Steinmetz M, et al. Quantification of left atrial strain and strain rate using Cardiovascular Magnetic Resonance myocardial feature tracking: a feasibility study. J Cardiovasc Magn Reson. 2014;16:60.