
Abstract
Objective: Evaluate the association between the multi-biomarker disease activity (MBDA) score and radiographic progression in patients with rheumatoid arthritis (RA) treated with tumor necrosis factor (TNF)-α inhibitors.
Methods: Change (Δ) in modified total Sharp score (mTSS) over 52 weeks and disease activity scores were examined retrospectively by Spearman's rank correlation coefficient in patients (N = 83) with RA initiating TNF-inhibitor treatment. Relative risk (RR) of ΔmTSS >0.5 for low MBDA score and 28-joint count disease activity score (DAS28) categories and associations between ΔmTSS and MBDA score categories conditional on DAS28 categories were assessed.
Results: At 52 weeks, 34% of patients had ΔmTSS >0.5 and 12% had ΔmTSS >3. Strongest correlations were observed between ΔmTSS and MBDA score (r = 0.47) or DAS28 (r = 0.42) at Week 24 and for area under the curve at Week 52 (MBDA score: r = 0.44, DAS28: r = 0.41), all p < 0.001. At Week 24, RR of ΔmTSS >0.5 for moderate/high MBDA score (≥30) or DAS28 (>3.2) were 6.6 (p < 0.001) and 2.7 (p = 0.005), respectively. Low DAS28 had greater risk of ΔmTSS >0.5 at 52 weeks when MBDA score was ≥30 (p < 0.05).
Conclusion: Higher MBDA score or DAS28 at Week 24 was associated with greater radiographic progression over 52 weeks of TNF-inhibitor treatment. MBDA score improved risk discrimination for radiographic progression within DAS28 categories.
Introduction
Rheumatoid arthritis (RA) is a chronic inflammatory disease that, when inadequately controlled, can lead to irreversible joint damage and substantial functional disability [Citation1–3]. Disease-modifying anti-rheumatic drugs (DMARDs) such as methotrexate (MTX) and biologics such as tumor necrosis factor (TNF)-α inhibitors have markedly improved therapeutic outcomes, making clinical remission as well as structural and functional remission achievable treatment goals for many patients [Citation4–6].
TNF inhibitors have been shown to reduce or prevent radiographic progression in most patients, including those with inadequate clinical responses [Citation7–9]. Conversely, radiographic progression can sometimes occur among patients who are in clinical remission [Citation10–13]. Measures that could reliably predict the risk of radiographic progression while tracking disease activity could inform clinicians and patients and support treatment decisions focused on clinical remission and prevention of irreversible joint damage.
A multi-biomarker disease activity (MBDA) test has been developed that measures the concentrations of 12 serum proteins and produces a score on a scale of 1–100 representing the level of RA disease activity [Citation14–16]. The MBDA score has been validated by demonstrating correlation with the 28-joint count disease activity score using C-reactive protein (DAS28-CRP) in several RA cohorts, including in seropositive and seronegative patients [Citation15]. In addition, the MBDA score has been shown to correlate with DAS28-erythrocyte sedimentation rate (ESR), clinical disease activity index (CDAI), and simplified disease activity index (SDAI) in patients receiving DMARD therapy, and to discriminate clinically meaningful changes in disease activity [Citation17,Citation18].
Additional evidence that the MBDA score detects pathologically important inflammation in RA comes from radiographic studies. The MBDA score was shown to be significantly associated with radiographic outcome among patients with established RA receiving non-biologic DMARD therapies in the Leiden cohort [Citation19] and with radiographic progression at 1 year among DMARD-naïve patients with early RA from the Swedish Farmacotherapy (SWEFOT) and the BeSt cohorts [Citation20,Citation21].
The aim of this study was to evaluate the association between the MBDA score and radiographic progression over a 1 year period for DMARD-experienced patients with established RA treated in clinical practice with either adalimumab (ADA), etanercept (ETN), or infliximab (IFX). Previous analyses of this cohort showed that the MBDA score tracked changes in disease activity during treatment with TNF inhibitors [Citation22]. We have now analyzed this cohort to extend our understanding of MBDA score as a predictor of radiographic progression to patients receiving TNF-inhibitor therapy.
Methods
Patient population and study design
This study was performed retrospectively in a cohort of patients with RA who had received ADA, ETN, or IFX for at least 1 year from 2003 to 2010 as part of their routine clinical care at the University of Occupational and Environmental Health, Japan (UOEH), as previously described [Citation22]. Patients fulfilled the 1987 American College of Rheumatology (ACR) revised criteria for RA and met the Japan College of Rheumatology criteria for initiation of anti-TNF therapy. Patients had received at least three months of conventional non-biologic DMARD therapy and either had: (1) tender joint count-28 (TJC28) ≥ 6, swollen joint count-28 (SJC28) ≥ 6, and elevated acute phase protein (CRP ≥2 mg/dL or ESR ≥28 mm/h); or (2) evidence of joint destruction (bone erosion or joint space narrowing) on X-rays and/or DAS28 ≥3.2 [Citation23]. To be included in this study, patients must have had clinical assessment data and serum available at baseline and at Weeks 24 and 52 following initiation of therapy, and radiographic assessment at baseline and 1 year (N = 83). The study was performed in accordance with the Helsinki Declaration and with approval from the ethics committee of the UOEH (approval number: 10–114). All patients provided written informed consent.
Radiographic assessments
Radiographic damage was scored according to the van der Heijde modification of the total Sharp score (mTSS) [Citation24]. Radiographs of hands and feet were scored by two independent readers whose scores were averaged. Radiographic progression was assessed as change in mTSS (ΔmTSS) from baseline to Week 52. Absence of radiographic progression was defined as ΔmTSS ≤0.5, with clinically relevant radiographic progression defined as ΔmTSS >3, and rapid radiographic progression defined as ΔmTSS >5 [Citation25].
Clinical and laboratory assessments
TJC28, SJC28, and patient global assessment (PGA) were obtained at baseline and at Weeks 24 and 52 for all patients. Clinical CRP and ESR were measured in the laboratory of UOEH. DAS28 was derived from the available clinical data and ESR results. DAS28 categories have been previously defined as low (DAS28 ≤ 3.2), moderate (>3.2–5.1), and high (>5.1) [Citation26].
The MBDA score
Serum samples for the MBDA testing were collected within two weeks of the associated clinical assessments and were stored at –40°C at UOEH until transfer to Crescendo Bioscience in South San Francisco, CA, where they were stored at −70°C until testing. Biomarker concentrations were measured in the development laboratory, using the same types of immunoassay instrument and reagents as those used for the commercial Vectra® DA test (Crescendo Bioscience, Inc., South San Francisco, CA). Serum concentrations of 12 protein biomarkers (vascular cell adhesion molecule-1 [VCAM-1], epidermal growth factor [EGF], vascular endothelial growth factor-A [VEGF-A], interleukin [IL]-6, TNF-receptor type 1 [TNF-RI], matrix metalloproteinase [MMP]-1, MMP-3, cartilage glycoprotein 39 [YKL-40], leptin, resistin, serum amyloid A [SAA], and CRP) were measured using a multiplexed immunoassay with signal detection by electrochemiluminescence (MULTI-ARRAY® platform, Meso Scale Discovery, Rockville, MD). Concentrations were combined using the validated algorithm to generate a score on a scale of 1–100 [Citation14–16]. The MBDA score categories have been previously defined as low (the MBDA score <30), moderate (30–44), and high (>44) [Citation15].
Statistical analyses
Patient characteristics at baseline were analyzed across the three TNF-inhibitor treatment group using Kruskal–Wallis test for continuous variables or Fisher’s exact test for categorical variables. Spearman rank correlation was used to evaluate the relationship between ΔmTSS from baseline to Week 52 and: (1) disease activity measures at baseline, Weeks 24 or 52; (2) area under the curve (AUC) of disease activity over a 1 year period; and (3) changes in disease activity from baseline to Weeks 24 or 52. The association between ΔmTSS >0.5 or ΔmTSS >3 and categories of the MBDA score or DAS28 at Week 24 was summarized by relative risk (RR) and tested by Fisher’s exact test. The 95% confidence intervals (CI) for RR were constructed as Koopman asymptotic score CI [Citation27]. Fisher’s exact test was used to assess whether the MBDA score categories were associated with ΔmTSS within the low and moderate/high DAS28 categories. Bivariate logistic regression model was used to confirm the association result by analyzing the MBDA score and DAS28 as continuous variables.
Reported p values were from two-sided tests. Adjustments of p values for multiple testing were applied, using a false discovery rate method [Citation28], to the analyses comparing baseline characteristics among the three treatment groups, and to the analyses assessing the correlations between ΔmTSS and disease activity measures at multiple time points. A p value (or an adjusted p value, when applicable) < 0.05 was considered significant. Statistical analyses were conducted using R version 2.15.1 (www.r-project.org).
Results
Patient demographics and clinical characteristics at baseline
The 83 patients eligible for this study had an average disease duration >8 years and mean age of 59 years; 84% were female. The distribution of patients by anti-TNF treatment group was 49% ADA, 23% ETN, and 28% IFX. Concomitant MTX was received by 89% of patients, at an average dose of 9.6 mg/week. A statistically significant lower proportion of patients received MTX in the ETN group (58%) compared with the ADA (98%) or IFX (100%) groups (adjusted p < 0.001). Although not statistically significant, there were also noteworthy differences for PGA, DAS28, and mTSS across the three treatment groups (p values between 0.05 and 0.1, adjusted p > 0.1). There were no significant differences in the distribution of baseline MBDA score or CRP among the three treatment groups ().
Table 1. Patient demographics.
Treatment response
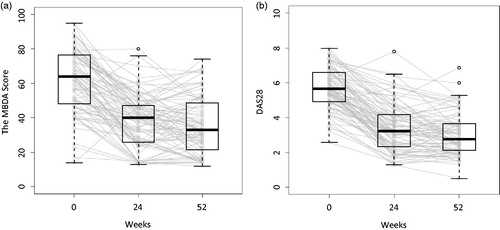
Disease activity evaluated by the MBDA score or DAS28 decreased for most patients following initiation of anti-TNF therapy, with most of the responses occurring between baseline and Week 24. Median MBDA score decreased from 64 (interquartile range [IQR]: 48–77) at baseline to 40 (IQR: 26–47) at Week 24, and to 33 (IQR: 22–49) at Week 52 (). Median DAS28 decreased from 5.7 (IQR: 4.9–6.6) at baseline to 3.2 (IQR: 2.3–4.2) at Week 24, and to 2.8 (IQR: 2.1–3.7) at Week 52 (). At Week 52, MBDA score was low (<30) for 33 (40%) patients and DAS28 was low (≤3.2) for 50 (60%) patients. Good or moderate EULAR response was achieved in 73 (88%) patients at Week 24 and 77 (93%) patients at Week 52.
Figure 1. Disease activity at each time point (n = 83). Disease activity was measured by the MBDA score (a) and DAS28 (b). Boxes indicate interquartile range. Thick horizontal bars represent median values. Whiskers indicate most extreme points within 1.5 × IQR of the box. Gray lines represent connection between the scores of each individual subject over the three visits.
Radiographic progression
Limited radiographic progression was observed in all three treatment groups. The mean ΔmTSS from baseline to Week 52 was 1.03. Radiographic progression (ΔmTSS >0.5) was observed for 28 (34%) patients, with clinically significant progression (ΔmTSS >3) observed in 10 (12%) patients and rapid progression (ΔmTSS >5) in 5 (6%) patients ().
Table 2. Distribution of ΔmTSS from baseline to Week 52 following anti-TNF treatment.
Correlations between disease activity scores and radiographic progression
Among the correlations with ΔmTSS evaluated in this study, the strongest observations were for disease activity measures at Week 24 (the MBDA score: r = 0.47, p < 0.001; DAS28: r = 0.42, p < 0.001), and for the AUC from baseline to Week 52 for the MBDA score (r = 0.44, p < 0.001) and DAS28 (r = 0.41, p < 0.001) (). These correlations remained significant after adjustment for multiple testing (adjusted p < 0.001). The MBDA score at Week 52 also correlated with ΔmTSS (r = 0.32, p = 0.004, adjusted p = 0.015).
Table 3. Spearman correlation between disease activity or change in disease activity and radiographic progressionTable Footnote*.
Relationship between radiographic progression and categories of disease activity at Week 24
Given the significant correlation observed between the amount of radiographic progression and the level of disease activity at Week 24 when analyzed as continuous variables, we further examined this relationship categorically, using different thresholds of radiographic progression and low, moderate, and high categories of disease activity scores at Week 24.
Of the 10 patients with ΔmTSS >3, 9 had high MBDA score (>44) and 4 had high DAS28 (>5.1) (Supplementary Table 1). Patients with high MBDA scores at Week 24 had a greater risk of ΔmTSS >3 compared with patients with low or moderate MBDA score (RR = 14.3, p = 0.001), and patients with high DAS28 had greater risk of ΔmTSS >3 than those with low or moderate DAS28 (RR = 4.4, p = 0.024). Patients with moderate to high MBDA score (≥30) at eek 24 had greater risk of ΔmTSS > 0.5 than those with low MBDA score (RR = 6.6, p < 0.001), and patients with moderate to high DAS28 (>3.2) at Week 24 had greater risk of ΔmTSS >0.5 than those with low DAS28 (RR = 2.7, p = 0.005) ().
Table 4. Relative risk of radiographic progression based on disease activity at Week 24.
Complementarity of the MBDA score and DAS28 categories for assessing risk for radiographic progression
When patients were cross-classified by the MBDA score and DAS28 categories at Week 24, discordance of classifications was observed for 44 of 83 (53%) patients (Supplementary Table 1), suggesting that the MBDA score and DAS28 may be complementary for identifying patients at risk for radiographic progression.
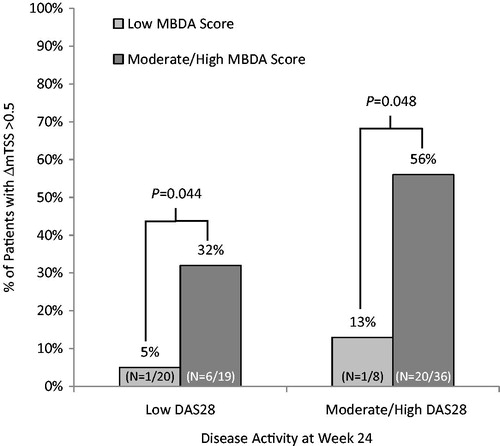
Separate analyses of the subgroups of patients with low DAS28 (≤3.2) and the ones with moderate to high DAS28 (>3.2) showed that the MBDA score could further discriminate patients at risk of radiographic progression. Among the 39 patients with low DAS28 (≤3.2) at Week 24, radiographic progression (ΔmTSS >0.5) was more frequent for patients with moderate or high MBDA scores (≥30) versus low MBDA scores (32% versus 5%; p = 0.044). A similar trend was found among patients with high DAS28 (>3.2) at Week 24 (56% versus 13%; p = 0.048) (). The bivariate logistic regression model showed that both the MBDA score and DAS28 at Week 24, as continuous scores, were significant predictors of ΔmTSS > 0.5. (Supplementary Table 2); for predicting ΔmTSS > 3, both variables had p values between 0.05 and 0.1.
Figure 2. Moderate to high MBDA scores added value to DAS28 at Week 24 for identifying patients with ΔmTSS > 0.5.
Discussion
This is the first report showing the MBDA score as a predictor of joint destruction in patients with established RA treated with biologic DMARDs. This study assessed the association of radiographic progression with biomarker-based (MBDA) and clinical (DAS28) disease activity scores in a cohort of 83 patients treated with a TNF inhibitor (ADA, ETN, or IFX) in clinical practice for at least 1 year (the study was not designed, however, to compare the efficacy between the different TNF inhibitors). Most improvement in disease activity occurred by Week 24, as demonstrated previously [Citation22]. At 1 year, a majority of the patients had no radiographic progression (ΔmTSS ≤0.5), which is in agreement with previous studies [Citation29–32]. Analyses of the correlations between disease activity (or changes in disease activity) and radiographic progression over a 1 year period showed that the strongest significant correlations were observed for MBDA score and DAS28 at Week 24, and for the AUC over the entire year (correlation coefficient ranging from 0.41 to 0.47, all p < 0.001). Correlations were weaker with the 52-week the MBDA score, and not significant for baseline disease activity or the changes to Weeks 24 or 52. These results suggest that the absolute level of disease activity reached in response to TNF inhibitor treatment, assessed here at 24 weeks, is more closely related to the amount of radiographic progression over the first year of treatment than either the level of disease activity prior to initiation of TNF inhibitor treatment or the magnitude of the clinical response. The limited correlation observed between baseline disease activity scores (DAS28 and the MBDA score) and radiographic progression at 1 year in these patients might be in part due to the rapid onset of TNF-inhibitor effect [Citation9,Citation33,Citation34]. Our findings are consistent with previous studies showing that the absolute levels of disease activity achieved at three months were predictive of radiographic progression at 1 year in patients with early RA treated with DMARDs [Citation35–37]. This study provides further supporting evidence, based on patients with established RA in a clinical setting, of the need for early and sustained control of disease activity for good radiographic outcomes.
Significant associations between radiographic progression and the MBDA scores have been previously reported for patients with established RA receiving non-biologic DMARDS [Citation19] and for DMARD-naïve patients with early RA enrolled in clinical trials with tight control strategies [Citation20,Citation21]. Correlation between baseline MBDA score and radiographic progression was not significant in this study. This difference could be due, in part, to the smaller number of patients or, as mentioned previously, to the rapid onset of TNF-inhibitor effect. Another noticeable difference was the fact that most patients from the BeSt and SWEFOT cohorts were treated with non-biologic DMARDs. Furthermore, no interim assessments of the MBDA score were reported between baseline and 1 year for these studies. This is the first time that the MBDA score at 24 weeks post-treatment is shown to be predictive of 1-year radiographic progression.
Categorical analyses showed that patients with moderate to high MBDA scores or moderate to high DAS28 at Week 24 were at greater risk of having ΔmTSS >0.5 than patients with low disease activity scores, and the MBDA score and DAS28 appeared to differ in their ability to discriminate between progressors (ΔmTSS >0.5) and nonprogressors (ΔmTSS ≤0.5). Only 2 of 28 patients (7%) with low MBDA scores (<30) at Week 24 had ΔmTSS >0.5, compared with 7 of 39 patients (18%) with low DAS28 (<3.2). Among patients with low DAS28 at Week 24, a significantly greater proportion of those with low MBDA scores had ΔmTSS ≤ 0.5 compared with those with moderate to high MBDA scores. These results suggest that low MDBA scores might be a stronger indicator of a low risk of radiographic progression than low DAS28. These results are generally consistent with those previously reported in the SWEFOT and BeSt early RA cohorts, which showed that radiographic progression was infrequent among patients with low MBDA score and that high MBDA score (>44) at baseline provided additional information to CRP or DAS28 for radiographic progression (defined as ΔmTSS >3 or >5) [Citation19–21].
The strengths of this study were that the patients were all DMARD-experienced with established disease treated in a clinical practice setting and that they initiated treatment with a TNF inhibitor at the study start. Conversely, the study limitations included the cohort size given the reduced risk of radiographic progression with biologic treatments. For example with ΔmTSS >3 detected in only 10 patients (12%), there was not sufficient power to test whether the MBDA score complemented DAS28 for predicting clinically significant radiographic progression in the bivariate logistic model or in subgroup analyses. As the first serum sample collected after initiation of biologic treatment was at Week 24, it was also not possible to assess the relationship between radiographic progression and the MBDA score at earlier time points. It would be valuable to understand how this relationship evolves over the initial few months after starting TNF inhibitor treatment, as changes in disease activity have been detected by the MBDA score as early as two weeks after initiation of TNF inhibitor treatment [Citation15]. If a significant correlation could be confirmed between radiographic progression at 1 year and MBDA score measured in the initial weeks of TNF-inhibitor therapy, the MBDA score could be useful for early identification of radiographic nonprogressors. This would provide additional support to physicians in their decision making, especially in the context of the recently advocated comprehensive disease control strategy [Citation13].
This is the first study to examine the relationship between radiographic progression and the MBDA score or DAS28, in a cohort of patients treated with TNF inhibitors as part of their standard care. Higher disease activity as measured by the MBDA score and DAS28 at Week 24 was associated with greater risk of radiographic progression over 52 weeks of TNF inhibitor treatment. The relatively strong association of disease activity scores at Week 24 suggested that early achievement of low disease activity was a key factor for inhibition of structural damage. In addition, MBDA score at Week 24 helped discriminate between radiographic progressors (ΔmTSS >0.5) and nonprogressors (ΔmTSS ≤0.5) over DAS28 alone. For the patients with low DAS28 at Week 24, those with moderate to high MBDA scores had greater risk of radiographic progression (ΔmTSS > 0.5) than those with low MBDA scores. These results would need to be confirmed in a larger cohort. It would also be of interest to determine whether the ability of the MBDA score to differentiate patients at greater risk of radiographic progression is also observed in a cohort of patients treated with non-TNF biologics.
Conflict of interest
S.H. has received speaking fees from AbbVie, Eisai, and Bristol-Myers Squibb. W.L. and N.D. are employees of Crescendo Bioscience Inc. Y.K. has received consulting fees and/or honoraria from Pfizer Japan Inc. Y.T. has received consulting fees, speaking fees, and/or honoraria from AbbVie, Daiichi-Sankyo, Chugai, Takeda, Mitsubishi-Tanabe, Bristol-Myers, Astellas, Eisai, Janssen, Pfizer, Asahi-kasei, Eli Lilly, GlaxoSmithKline, UCB, Teijin, MSD, Santen and has received research grants from Mitsubishi-Tanabe, Takeda, Chugai, Astellas, Eisai, Taisho-Toyama, Kyowa-Kirin, AbbVie, Bristol-Myers. S.K., S.F., Y.M., K.H., N.S., and K.S. report no conflicts of interest. This work was supported in part by Crescendo Bioscience, who provided biomarker analyses and statistical support. The study was also supported in part by a Research Grant-In-Aid for Scientific Research by the Ministry of Health, Labor and Welfare of Japan, the Ministry of Education, Culture, Sports, Science and Technology of Japan, and the University of Occupational and Environmental Health, Japan.
Supplementary material available online
Supplementary Material.
Download MS Word (68 KB)Acknowledgments
The authors thank the medical staff of all participating institutions for providing data, and the laboratory staff at Crescendo Bioscience Inc. for conducting the multi-biomarker disease activity tests. We thank Sara Arzeno and Arbor Communications who provided medical writing assistance, and Eric H. Sasso, MD, Oscar G. Segurado, MD, PhD, and Rebecca Bolce, for constructive discussions, and critical review and editing of this manuscript.
S.H. and Y.T. conceived the study. S.H., W.L., N.D., and Y.T. participated in its design and coordination. S.H., S.K., S.F., Y.M., K.H., N.S., K.Y., K.S., and Y.T. enrolled and managed the patients in clinic. S.H., S.K., S.F., and Y.M. participated in radiographic evaluation. Laboratory staff at Crescendo Bioscience Inc. performed measurement of the MBDA score. S.H., W.L., N.D., and Y.T. performed the statistical analyses, data interpretation and wrote the manuscript. S.A. provided medical writing assistance and editorial review. O.S., R.B., and E.S. contributed to data intepretation and review draft manuscript. All authors read and approved the final manuscript.
Related Research Data
References
- Lindqvist E, Jonsson K, Saxne T, Eberhardt K. Course of radiographic damage over 10 years in a cohort with early rheumatoid arthritis. Ann Rheum Dis. 2003;62:611–16.
- van der Heijde DM. Joint erosions and patients with early rheumatoid arthritis. Br J Rheumatol. 1995;34(Suppl. 2):74–8.
- Bombardier C, Barbieri M, Parthan A, Zack DJ, Walker V, Macarios D, et al. The relationship between joint damage and functional disability in rheumatoid arthritis: a systematic review. Ann Rheum Dis. 2012;71:836–44.
- Tanaka Y. Intensive treatment and treatment holiday of TNF-inhibitors in rheumatoid arthritis. Curr Opin Rheumatol. 2012;24:319–26.
- Smolen JS, Aletaha D, Bijlsma JW, Breedveld FC, Boumpas D, Burmester G, et al. Treating rheumatoid arthritis to target: recommendations of an international task force. Ann Rheum Dis. 2010;69:631–7.
- Smolen JS, Landewé R, Breedveld FC, Buch M, Burmester G, Dougados M, et al. EULAR recommendations for the management of rheumatoid arthritis with synthetic and biological disease-modifying antirheumatic drugs: 2013 update. Ann Rheum Dis. 2014;73:492–509.
- Taylor PC, Feldmann M. Anti-TNF biologic agents: still the therapy of choice for rheumatoid arthritis. Nat Rev Rheumatol. 2009;5:578–82.
- Smolen JS, Han C, Bala M, Maini RN, Kalden JR, van der Heijde D, et al. Evidence of radiographic benefit of treatment with infliximab plus methotrexate in rheumatoid arthritis patients who had no clinical improvement: a detailed subanalysis of data from the anti-tumor necrosis factor trial in rheumatoid arthritis with concomitant therapy study. Arthritis Rheum. 2005;52:1020–30.
- Emery P, Genovese MC, van Vollenhoven R. Less radiographic progression with adalimumab plus methotrexate versus methotrexate monotherapy across the spectrum of clinical response in early rheumatoid arthritis. J Rheumatol. 2009;36:1429–41.
- Molenaar ET, Voskuyl AE, Dinant HJ. Progression of radiologic damage in patients with rheumatoid arthritis in clinical remission. Arthritis Rheum. 2004;50:36–42.
- Cohen G, Gossec L, Dougados M, Cantagrel A, Goupille P, Daures JP, et al. Radiological damage in patients with rheumatoid arthritis on sustained remission. Ann Rheum Dis. 2007;66:358–63.
- Lillegraven S, Prince FH, Shadick NA, Bykerk VP, Lu B, Frits ML, et al. Remission and radiographic outcome in rheumatoid arthritis: application of the 2011 ACR/EULAR remission criteria in an observational cohort. Ann Rheum Dis. 2012;71:681–6.
- Emery P, Kavanaugh A, Bao Y, Ganguli A, Mulani P. Comprehensive disease control (CDC): what does achieving CDC mean for patients with rheumatoid arthritis? Ann Rheum Dis. 2015;74:2165–74.
- Eastman PS, Manning WC, Qureshi F, Haney D, Cavet G, Alexander C, et al. Characterization of a multiplex, 12-biomarker test for rheumatoid arthritis. J Pharm Biomed Anal. 2012;70:415–24.
- Curtis JR, van der Helm-van Mil AH, Knevel R, Huizinga TW, Haney DJ, Shen Y, et al. Validation of a novel multi-biomarker test to assess rheumatoid arthritis disease activity. Arthritis Care Res (Hoboken). 2012;64:1794–803.
- Centola M, Cavet G, Shen Y, Ramanujan S, Knowlton N, Swan KA, et al. Development of a multi-biomarker disease activity test for rheumatoid arthritis. PLoS One. 2013;8:e60635.
- Hirata S, Dirven L, Shen Y, Centola M, Cavet G, Lems WF, et al. A multi-biomarker score measures rheumatoid arthritis disease activity in the BeSt study. Rheumatology (Oxford). 2013;52:1202–7.
- Bakker MF, Cavet G, Jacobs JW, Bijlsma JW, Haney DJ, Shen Y, et al. Performance of a multi-biomarker score measuring rheumatoid arthritis disease activity in the CAMERA tight control study. Ann Rheum Dis. 2012;71:1692–7.
- van der Helm-van Mil AHM, Knevel R, Cavet G, Huizinga TW, Haney DJ. An evaluation of molecular and clinical remission in rheumatoid arthritis by assessing radiographic progression. Rheumatology (Oxford). 2013;52:839–46.
- Hambardzumyan K, Bolce R, Saevarsdottir S, Cruickshank SE, Sasso EH, Chernoff D, et al. Pretreatment multi-biomarker disease activity score and radiographic progression in early RA: results from the SWEFOT trial. Ann Rheum Dis. 2014;74:1102–9.
- Markusse IM, Dirven L, van den Broek M, Bijkerk C, Han KH, Ronday HK, et al. A multibiomarker disease activity score for rheumatoid arthritis predicts radiographic joint damage in the BeSt study. J Rheumatol. 2014;41:2114–19.
- Hirata S, Li W, Defranoux N, Cavet G, Bolce R, Yamaoka K, et al. A multi-biomarker disease activity blood test tracks clinical response consistently in patients with rheumatoid arthritis treated with different anti-tumor necrosis factor therapies: a retrospective observational study. Mod Rheum. 2015;25:344–9.
- Japan College of Rheumatology. TNF inhibitor use guidelines for rheumatoid arthritis (RA) (2012 revised edition) (in Japanese) Available from: http://www.ryumachi-jp.com/info/guideline_TNF_120704.html [last accessed 7 May 2015].
- van der Heijde D. How to read radiographs according to the Sharp/van der Heijde method. J Rheumatol. 2000;27:261–3.
- Bruynesteyn K, van der Heijde D, Boers M, Saudan A, Peloso P, Paulus H, et al. Determination of the minimal clinically important difference in rheumatoid arthritis joint damage of the Sharp/van der Heijde and Larsen/Scott scoring methods by clinical experts and comparison with the smallest detectable difference. Arthritis Rheum. 2002;46:913–20.
- Fransen J, van Riel PL. The Disease Activity Score and the EULAR response criteria. Rheum Dis Clin North Am. 2009;35:745–57.
- Koopman PAR. Confidence intervals for the ratio of two binomial proportions. Biometrics 1984;40:513–17.
- Benjamini Y, Hochberg Y. Controlling the false discovery rate: a practical and powerful approach to multiple testing. J R Stat Soc Series B Stat Methodol. 1995;57:289–300.
- Bathon JM, Martin RW, Fleischmann RM, Tesser JR, Schiff MH, Keystone EC, et al. A comparison of etanercept and methotrexate in patients with early rheumatoid arthritis. N Engl J Med. 2000;343:1586–93.
- St Clair EW, van der Heijde DM, Smolen JS, Maini RN, Bathon JM, Emery P, et al. Combination of infliximab and methotrexate therapy for early rheumatoid arthritis: a randomized, controlled trial. Arthritis Rheum. 2004;50:3432–43.
- Breedveld FC, Weisman MH, Kavanaugh AF, Cohen SB, Pavelka K, van Vollenhoven R, et al. The PREMIER study: a multicenter, randomized, double-blind clinical trial of combination therapy with adalimumab plus methotrexate versus methotrexate alone or adalimumab alone in patients with early, aggressive rheumatoid arthritis who had not had previous methotrexate treatment. Arthritis Rheum. 2006;54:26–37.
- van der Heijde D, Klareskog L, Rodriguez-Valverde V, Codreanu C, Bolosiu H, Melo-Gomes J, et al. TEMPO Study Investigators. Comparison of etanercept and methotrexate, alone and combined, in the treatment of rheumatoid arthritis: two-year clinical and radiographic results from the TEMPO study, a double-blind, randomized trial. Arthritis Rheum. 2006;54:1063–74.
- Keystone EC, Breedveld FC, van der Heijde D, Landewé R, Florentinus S, Arulmani U, et al. Long term effect of delaying combination therapy with tumor necrosis factor inhibitor in patients with aggressive early rheumatoid arthritis: 10-year efficacy and safety of adalimumab from the randomized controlled PREMIER trial with open-label extension. J Rheumatol. 2014;41:5–14.
- van der Heijde D, Klareskog L, Landewé R, Bruyn GA, Cantagrel A, Durez P, et al. Disease remission and sustained halting of radiographic progression with combination etanercept and methotrexate in patients with rheumatoid arthritis. Arthritis Rheum. 2007;56:3928–39.
- Smolen JS, Han C, van der Heijde DM, Emery P, Bathon JM, Keystone E, et al. Radiographic changes in rheumatoid arthritis patients attaining different disease activity states with methotrexate monotherapy and infliximab plus methotrexate: the impacts of remission and tumour necrosis factor blockade. Ann Rheum Dis. 2009;68:823–7.
- Grigor C, Capell H, Stirling A, McMahon AD, Lock P, Vallance R, et al. Effect of a treatment strategy of tight control for rheumatoid arthritis (the TICORA study): a single-blind randomised controlled trial. Lancet. 2004;364:263–9.
- Goekoop-Ruiterman YP, de Vries-Bouwstra JK, Allaart CF, van Zeben D, Kerstens PJ, Hazes JM, et al. Comparison of treatment strategies in early rheumatoid arthritis: a randomized trial. Ann Intern Med. 2007;146:406–15.