Abstract
A new simple graphical method is described for the determination of inhibition type and inhibition constants of an enzyme reaction without any replot. The method consists of plotting experimental data as (V–v)/v versus the inhibitor concentration at two or more concentrations of substrate, where V and v represent the maximal velocity and the velocity in the absence and presence of inhibitor with given concentrations of the substrate, respectively. Competitive inhibition gives straight lines that converge on the abscissa at a point where [I] = −Ki. Uncompetitive inhibition gives parallel lines with the slope of 1/K’i. For mixed type inhibition, the intersection in the plot is given by [I] = −Ki and (V–v)/v = −Ki/K’i in the third quadrant, and in the special case where Ki = K’i (noncompetitive inhibition) the intersections occur at the point where [I] = −Ki and (V–v)/v = −1. The present method, the “quotient velocity plot,” provides a simple way of determining the inhibition constants of all types of inhibitors.
Introduction
It has long been common practice to determine the inhibition constants of competitive and noncompetitive inhibitors by use of Dixon plotsCitation[1], in which the reciprocal velocity, 1/v, is plotted against the inhibitor concentration, at two or more values of the substrate concentration. Noncompetitive inhibition gives straight lines converging on the abscissa at –Ki at different concentrations of the substrate, whereas in competitive inhibition extrapolated lines at different substrate concentrations intersect at a single point in the fourth quadrant; this point gives –Ki values. However, the usefulness of the Dixon plot is limited by the fact that it cannot be applied to uncompetitive inhibitionCitation[2]. Cornish-Bowden presented an improved method for the determination of K’i in uncompetitive inhibition, but this plot itself cannot provide the inhibition constant for competitive inhibitionCitation[3]. At present, the inhibition constant can be determined by concomitant use of the Dixon plot and the Cornish-Bowden method. This article presents the “quotient velocity plot,” a new graphical method for direct determination of the inhibition type and inhibition constants including competitive, noncompetitive, and uncompetitive inhibition.
Theory and model
We may write the following reaction scheme
It is formally convenient to regard Km, K9m, Ki, and K9i as dissociation constants of the enzyme–inhibitor complexes as described in Equation (1). General inhibition types are described by the rate equation:
in which V is the maximal velocity. From the rate equation, it follows that:
Types of inhibition
Competitive inhibition
In competitive inhibition, binding of the substrate and the inhibitor to the enzyme is mutually exclusive; thus, K’i = ∞ and K’m = 0. We have the following equation for competitive inhibition:
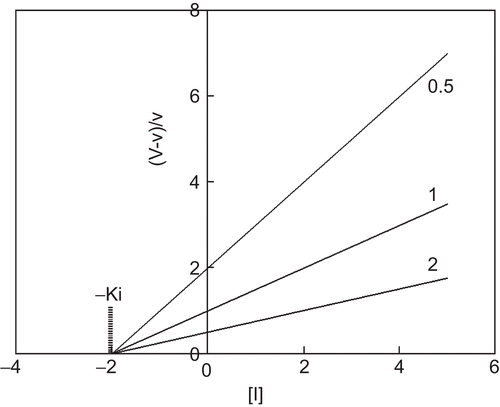
The relationship between (V – v)/v and [I], the concentration of the inhibitor, gives straight lines converging on the abscissa at –Ki at different concentrations of the substrate ().
Figure 1. Quotient velocity plot for competitive inhibition. The lines were drawn in accordance with Equation (3). The following values of parameters were used: Km = 1 and Ki = 2. The substrate concentration is indicated by each line.
Noncompetitive inhibition
In noncompetitive inhibition, both the substrate and the inhibitor bind to the enzyme at completely independent sites, and the affinity of the substrate (inhibitor) is unaffected by the inhibitor (substrate): Km = K’m and Ki = K’i. We have the following equation for noncompetitive inhibition:
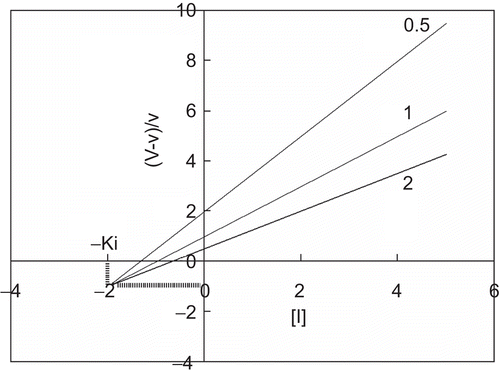
Equation (4) converts a series of inhibition curves obtained with different substrate concentrations into a single straight line converging in the third quadrant at −Ki and −1 ().
Figure 2. Quotient velocity plot for noncompetitive inhibition. The lines were drawn in accordance with Equation (4). The following values of parameters were used: Km = K’m = 1 and Ki = K’i = 2. The substrate concentration is indicated by each line.
Uncompetitive inhibition
Uncompetitive inhibitor does not combine with the free enzyme, but only with the ES complex: Ki = ∞ and then K’m = 0. Equation (2) can be rearranged into the following form:
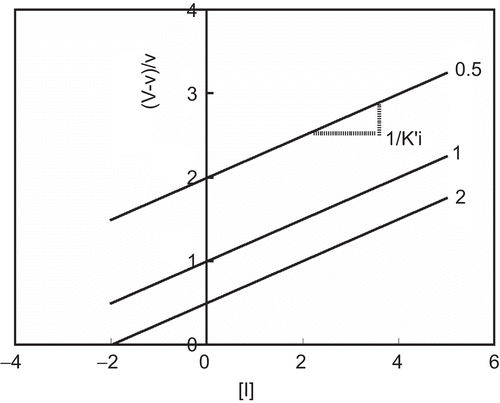
When different substrate concentrations are used, a relationship of (V – v)/v with [I] shows parallel straight lines with a slope of 1/K’i ().
Figure 3. Quotient velocity plot for uncompetitive inhibition. The lines were drawn in accordance with Equation (5). The following values of parameters were used: Km = 1, K’i = 4, K’m = 0, and Ki = ∞. The substrate concentration is indicated by each line.
Mixed type inhibition
General Equation (2) can be applied to mixed type inhibition, and we rearrange this equation as follows:
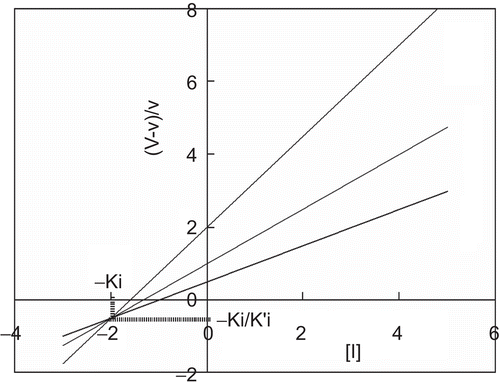
A relationship of (V – v)/v with [I] shows a straight line converging at –Ki and –Ki/K’i in the third quadrant. We can calculate the K’i value from this point ().
Figure 4. Quotient velocity plot for mixed type inhibition. The lines were drawn in accordance with Equation (6). The following values of parameters were used: Km = 1, Ki = 2, and K’i = 4. The substrate concentration is indicated by each line.
summarizes values of the intersection points and slopes of the four types of inhibition.
Table 1. Values of intersection points and slopes of quotient velocity plots.
Discussion
The first step when analyzing enzyme kinetics is determination of the Km and V values. The purpose of the analysis of enzyme inhibition is determination of the inhibition type and inhibition constants, which has been achieved using several graphical methods[Citation1,Citation3–7]. The Dixon plotCitation[1] is the most widely used method, but cannot distinguish unambiguously between competitive and mixed type inhibitorsCitation[2]. Thus, kinetic analysis of enzyme inhibition has been carried out by concomitant use of the Dixon plot and an improved method presented by Cornish-BowdenCitation[3].
The “quotient velocity plot” presented in this article can be applied to all types of inhibition. We can determine the inhibition type using inhibition curves at two or more values of substrate concentration. The intersection of this plot varies depending on the inhibition type: straight lines converging on the abscissa at –Ki show competitive inhibition, and parallel straight lines with a slope of 1/Ki give uncompetitive inhibition. On the other hand, quotient velocity plots of noncompetitive inhibition and mixed inhibition give straight lines intersecting in the third quadrant, but one can distinguish between the two types of inhibition. The intersection of the plots in mixed inhibition gives [I] = –Ki and (V – v)/v = –Ki/K’i. However, the intersection in noncompetitive inhibition occurs at a point where [I] = –Ki and (V – v)/v = –1 because Ki = K’i in this type of inhibition. A graphical method of this type was described by Hunter and DownsCitation[8] more than half a century ago, but their method was not particularly convenient as it involved extrapolation of a curve. Thereafter, the combination plot, a new version of the Hunter and Downs method, was presented for analysis of each type of inhibitionCitation[9]. Cortés et al.Citation[10] further provided a comparison of inhibition plots, in particular Dixon plots and the Cornish-Bowden method, although their study was primarily concerned with relationships between inhibition constants and the concentrations for half-inhibition often used in pharmacology. A similar type of the present quotient velocity plot was also proposed as an analysis method for substrate-inhibited microbial growthCitation[11]. However, application of the method to other enzyme inhibition was not examined.
The present plot serves as a useful graphical method for determining inhibition types and inhibition parameters, although it requires V values for calculation. This plot can contribute to analysis of the inhibition mechanism in enzyme research and drug action in medicinal chemistry. However, recent studies show that a variety of enzymes do not obey Michaelis–Menten kinetics, and non-Michaelian enzymes cannot be analyzed by linear transformation methods. Various linearization methods including the present plot, Dixon plot, and Cornish-Bowden plot should be used only for initial orientation regarding the action of a substrate/inhibitor on Michaelis–Menten type enzymes. Nonlinear analysis with computer simulation methods will be necessary for detailed kinetic studies.
Declaration of interest: The authors report no conflicts of interest.
Related Research Data
References
- Dixon M. The determination of enzyme inhibitor constants. Biochem J 1953;55:170–1.
- Schlamowitz M, Shaw A, Jackson WT. Limitations of the Dixon plot for ascertaining nature of enzyme inhibition. Tex Rep Biol Med 1969;27:483–8.
- Cornish-Bowden A. A simple graphical method for determining the inhibition constants of mixed, uncompetitive and non-competitive inhibitors. Biochem J 1974;137:143–4.
- Eisenthal R, Cornish-Bowden A. The direct linear plot. A new graphical procedure for estimating enzyme kinetic parameters. Biochem J 1974;139:715–20.
- Baici A. The specific velocity plot. A graphical method for determining inhibition parameters for both linear and hyperbolic enzyme inhibitors. Eur J Biochem 1981;119:9–14.
- Yoshino M. A graphical method for determining inhibition parameters for partial and complete inhibitors. Biochem J 1987;248:815–20.
- Whiteley CG. Mechanistic and kinetic studies of inhibition of enzymes. Cell Biochem Biophys 2000;33:217–25.
- Hunter A, Downs CE. The inhibition of arginase by amino acids. J Biol Chem 1945;157:427–46.
- Chan WW. Combination plots as graphical tools in the study of enzyme inhibition. Biochem J 1995;311:981–5.
- Cortés A, Cascante M, Cárdenas ML, Cornish-Bowden A. Relationships between inhibition constants, inhibitor concentrations for 50% inhibition and types of inhibition: new ways of analysing data. Biochem J 2001;357:263–8.
- Wang J, Araki T, Ogawa T, Matsuoka M, Fukuda H. A method of graphically analyzing substrate-inhibition kinetics. Biotechnol Bioeng 1999;62:403–11.