
Abstract
Cellular Src (c-Src) kinases play a critical role in cell adhesion, proliferation, angiogenesis and cancer. Ligand-based pharmacophore models, used to identify the critical chemical features of c-Src inhibitors, were generated and validated by training, test and decoy sets, respectively. Best pharmacophore model, Hypo1, consists of four features such as HBA, HBD, Hy-Ar and RA. Hypo1 was used in virtual screening of the chemical databases such as Maybridge, Chembridge and NCI. The sorted compounds by Hypo1 were further reduced by applying drug-like properties and ADMET. Totally, 85 compounds which showed the good drug-like properties were selected from three databases and subjected to molecular docking for refinement of the retrieved hits by analysing the suitable orientation of the compounds in the active site of c-Src. Finally, 18 compounds were selected based on consensus scoring and hydrogen bond interactions with critical amino acids such as Met341, Thr338, Glu339 or Asp404. In addition, the Bayesian model was generated from the training set to find suitable fragments for inhibition of the c-Src function. Based on the above finding, we suggested that the Hypo1 and the good fragments from the Bayesian model will be helpful to select the compounds from various databases to identify the novel and potent c-Src inhibitor.
Introduction
Protein tyrosine kinases play an essential role in signal transduction and cellular mechanismsCitation1,Citation2. Src family kinases (SFKs), non-receptor tyrosine kinases, are classified into nine groups that share the similar structure and functions: c-Src (cellular Src), Yes, Fyn, Lyn, Lck, Hck, Fgr, Blk and Yrk. The SFKs consist of Src homology domain 1 (SH1), Src homology domain 2 (SH2), Src homology domain 3 (SH3) and Src homology domain 4 (SH4)Citation3,Citation4. The SH1 domain contains kinase domain with phosphorylates tyrosine residue in the C-terminal. The SH2 domain was found to be a selective domain recognizing the phosphorylated tyrosine residueCitation5. This domain is crucial for the regulation of Src activity or binding to other tyrosine proteins. The SH2-linker is located between SH2 and SH1 domains and regulates the Src activity and interacts with SH3 domain. The SH3 domains in c-Src mediated the protein–protein interactions with c-Src itself or SH3 domain via binding to proline-rich peptidesCitation5,Citation6. The SH4 domain is located in the N-terminal region which contains a myristoylation sequence important for membrane attachment. Though a vast number of potent and selective compounds toward SFKs are continuously designed and synthesized, still there is a lack of knowledge on critical chemical features of c-Src inhibitors.
c-Src is a 60 kDa cytoplasmic protein belonging to the non-receptor tyrosine kinase familyCitation7. It plays various roles in cell signalling mediating signal transduction via interactions with multiple proteins and its complexes. c-Src activity was regulated by the interaction of C-terminal tyrosine (Y530) with SH2 domain. The active (open) and inactive (close) states of c-Src is mainly dependent on the binding of Y530 in the dephosphorylation and phosphorylation states with SH2, respectively, via changing the configuration of SH2, SH3 and SH2-linker sitesCitation8. The three-dimensional (3D) structure of c-Src was elucidated for the structural features responsible for its biological functionsCitation9,Citation10. In the past 25 years, a plethora of studies have demonstrated that the c-Src plays an important role in the signalling changes in the steps of cellular adhesion and motilityCitation11, as well as in the growth, progression and metastasis of a variety of human malignancies. Elevated c-Src activity/expression was associated with colon, breast, pancreas, lung and brain cancer, and osteoporosisCitation12,Citation13. Therefore, c-Src has been recognized as an important therapeutic target to design a novel and potent inhibitorsCitation14,Citation15.
In this paper, we employed the pharmacophore modeling-based virtual screening and molecular docking to identify the new potent scaffolds to inhibit the c-Src activity. To proceed with these studies, different inhibitors with their corresponding half maximal inhibitory concentration values (IC50) estimated with the equal bioassay have been collected from various literatures. Top 10 hypotheses were generated and Hypo1 was selected as a best hypothesis based on various validation methods such as Fisher randomization, test and decoy sets. The Hypo1 was used as 3D structural query in virtual screening and the screened molecules were further filtered out by applying Absorption, Distribution, Metabolism, Excretion and Toxicity (ADMET), Rule of five and molecular-docking techniques. Moreover, Bayesian model was also generated from the e-training set compounds to find the suitable fragments for c-Src inhibitors.
Material and methods
Pharmacophore modeling
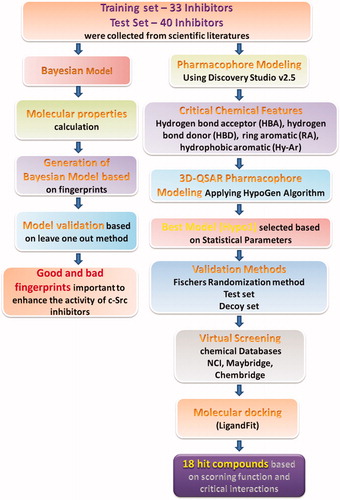
Discovery Studio v2.5 (DS, Accelrys, San Diego, CA) software package was used to run all the calculations. Identification of the critical pharmacophoric features is important to design potent c-Src inhibitors. Feature mapping and 3D QSAR pharmacophore generation modules were used to identify the vital chemical features and to generate the pharmacophore models based on their activity values, respectively. The overall workflow is shown in .
Figure 1. Overall scheme of the work.
Data set preparation
For the generation of pharmacophore model, 73 c-Src inhibitors with their corresponding IC50 values were collected from various literaturesCitation16–18, which were tested with the same biological assay. The total 73 compounds were divided into training (33 compounds) and test sets (40 compounds) based on the principles of structural diversity and wide coverage of activity data. All 2D structures of the compounds were built using MDL-ISIS Draw v2.4 (Frankfurt, Germany) and exported into DS to convert into 3D format. The CHARMm force field was applied to minimize each compoundCitation19,Citation20 and a maximum number of 255 conformers were generated for each compound using the Best conformational analysis method. The training and test sets compounds with good conformation were submitted to generate the quantitative hypotheses and to validate the generated hypotheses, respectively.
Pharmacophore generation
One of the most important steps in pharmacophore generation is to select the suitable chemical features. Hence, all the training set molecules were subjected to Feature mapping protocol to find the important chemical features present in known c-Src inhibitors. Hydrogen bond acceptor (HBA), hydrogen bond donor (HBD), ring aromatic (RA) and hydrophobic aromatic (Hy-Ar) chemical features were selected with the parameters of minimum “0” to maximum of “5” and all other default parameters were also used in pharmacophore model generation. Automated 3D-QSAR pharmacophore generation module was used to generate the hypothesis by utilizing the experimental activity values (IC50) of training set compounds. While generating the quantitative model, a minimum of 0 to a maximum of 5 features were selected to build a series of hypotheses. Ten quantitative pharmacophore models were generated with corresponding statistical parameters such as cost values, root mean square (RMS) and fit values. The best quality hypothesis was selected based on the statistical parameters as well as the Debnath’s analysisCitation21,Citation22.
Pharmacophore model evaluation
A good pharmacophore model should fulfil some of the criteria such as good correlation coefficient, high cost difference, the lowest total cost and lowest RMS values as well as the total cost should be close to the fixed cost and it should be away from the null costCitation23. The Fischer’s randomization method was applied to select the best pharmacophore model from the 10 generated hypotheses. To confirm the predictive ability of the best hypothesis, the best pharmacophore model was further cross-validated by test setCitation24 and decoy setCitation21,Citation22. In Fischer’s randomization method, to achieve 98% significance of the best hypothesis, 49 random training sets with shuffled activity values were created from the original training set to generate 49 different pharmacophore models in Fischer’s randomization method.
Test set was used to predict the correlation value between the experimental and predicted activity values of the external molecules which are not present in the training set. To ascertain the broadness of pharmacophore predictability, the test set consisted of structurally diverse chemical compounds from the training set.
Decoy set was used to determine how well the best hypothesis could differentiate potential c-Src inhibitors from other compounds, respectively. Decoy set was used to validate the best pharmacophore model by calculating an enrichment factor (EF) and goodness of hit (GH). The decoy set was prepared by calculating the 1D property of 15 active inhibitors of c-Src and 1285 inactive or unknown compounds. The EF and GH were calculated using the following equations:
where Ha is the total number of actives molecules in the hit list, D is total number of molecules in the decoy set, Ht is the total number of hit molecules from the databases and A is the total number of actives in the decoy set. The EF and GF values prove the specificity and the selectivity of the best pharmacophore model.
Virtual screening
Virtual screening was used to select a minimum number of candidate molecules that were likely to be active against a chosen biological receptor. The best pharmacophore model was used as a 3D structural query for retrieving the potent molecules from various chemical databases such as NCICitation25, MaybridgeCitation26 and ChembridgeCitation27. Initially, 255 conformers were generated for each molecule in the chemical databases using Fast Conformer Generation method. The hit compounds were further filtered by applying the ADMET tool, Lipinski’s rules of fiveCitation28,Citation29, and the drug-like molecules were subsequently subjected to the molecular-docking technique. The drug-like properties were applied to improve the pharmacokinetics properties of the compounds.
Structure-based molecular-docking protocol
The LigandFitCitation21,Citation30,Citation31, molecular-docking program was used to identify the suitable binding mode of the ligands in protein active site as well as to predict the binding affinity between them. The crystal structure of c-Src (PDB ID: 2BDJ) complex with 3-[2-(2-cyclopentyl-6-{[4-(dimethylphosphoryl) phenyl] amino}-9H-purin-9-yl) ethyl] phenolCitation32 retrieved from Protein Data Bank (PDB, www.rcsb.org) was used as the receptor protein. Initially, protein was prepared for the docking process by removing all the water molecules except few water molecules in the active site of c-Src and the CHARMm force field was applied using Simulation tool. The protein active site is represented as a binding site for ligands that can be identified by applying two methods: (i) eraser algorithm which is based on the receptor shape and (ii) volume occupied by known ligand in the active siteCitation31. Here, we employed the second strategy to identify the protein active site. To evaluate the accuracy of docking programs, co-crystal molecule was sketched and docked into c-Src active site. The docked pose was superimposed on the co-crystal bound conformation to calculate the RMS deviation. The 33 molecules (training set) and 85 hit molecules from the virtual screening were docked into the c-Src active site. Conformation of each ligand was generated by applying the Monte Carlo simulation and flexible fit was selected. Herein, the maximum of 10 poses for each ligand were selected, and the RMS and score threshold were set to 1.50 Å and 20 kcal mol−1, respectively. Scoring functions are based on the assumption that binding affinity can be described as a sum of independent terms. The scoring functions such as piecewise linear potential 1 (PLP1)Citation33, piecewise linear potential 2 (PLP2), potential of mean force 04 (PMF04)Citation34, Dock score, JainCitation35, LigScore1, LigScore236 and LUDICitation37 as well as the consensus score were used. Each of the saved conformations was evaluated and ranked using the consensus scoringCitation38 function which included LigScore1, LigScore2, PLP1, PLP2, JAIN, PMF and LUDI. They are required to select the best docked pose of the candidate compounds in receptor binding sites, to select probable binding modes and to discriminate the binders from non-binders. Finally, the molecules that showed good agreement with consensus scoring were selected, which were manually validated through hydrogen bond interactions with the critical amino acids such as Met341, Asp404, Glu339, Thr338 and Glu310 in c-Src protein.
Bayesian model
To distinguish between the “good” and “bad” fragments of the inhibitors, Bayesian model was built based on a 30 (14 active and 16 inactive) known c-Src inhibitors from training and test sets. Bayesian model can capture a simple two-class relationship (such as active or inactive) and build a model based on multiple classes or multiple end-points. Bayesian model was built based on Bayes’ theoremCitation39,Citation40:
where h denotes the model, d is the observed data, P(h) indicates the prior belief (probability of pharmacophore model h before observing any data), P(d) is the data evidence (marginal probability of the data), P(d/h) is the likelihood (probability of data d if pharmacophore model h is true) and P(h/d) is the posterior probability (probability of pharmacophore model h being true given the observed data d). It generates a large set of Boolean features from the input 2D descriptors. The main aim to calculate the descriptors is to identify which descriptors correlate well with the biological activity of the compounds. The model collects the frequency of occurrence of each feature in the active subset present in all data samples. The following steps are applied to generate the model: (i) the features of the sample are generated, (ii) weight is calculated for each feature using a Laplacian-adjusted probability estimate, (iii) the weights are summed to provide a probability estimate which is a relative predictor of the likelihood of that sample being from the good subset and (iv) Laplacian-corrected estimator is used to adjust the uncorrected probability estimate of a feature to account for the different sampling frequencies of different features. The value of 1 was set to all the active compounds and 0 value was used for inactive compounds. The generated model was validated by leave-one-out cross-validation information. For the test set validation, the best split was calculated by picking the split that minimized the sum of the percent misclassified for category members and for category non-members, using the cross-validated score for each sampleCitation41. A contingency table is constructed which contains the number of true positives (TP), false negatives (FN), false positives (FP) and true negatives (TN)Citation42.
Results and discussion
Pharmacophore generation
The quality of pharmacophore is directly proportional to the goodness of molecules present in the training set. The training set contains 33 compounds () which fulfilled the necessary criteria to produce the good quantitative hypothesis: (i) by covering a wide activity range of five orders of magnitude (0.15–100 000 nM), (ii) the highly active, moderate and inactive compounds were included, (iii) training set compounds bind the same target in a similar way and (iv) activity values (IC50) for each compound were reported by homogeneous procedures (kinase inhibition assay). The training set compounds were grouped into three classes based on their IC50 values such as highly active (IC50 < 2 nM), moderately active (2 ≤ IC50 ≤ 200 nM) and inactive compounds (IC50 > 200 nM).
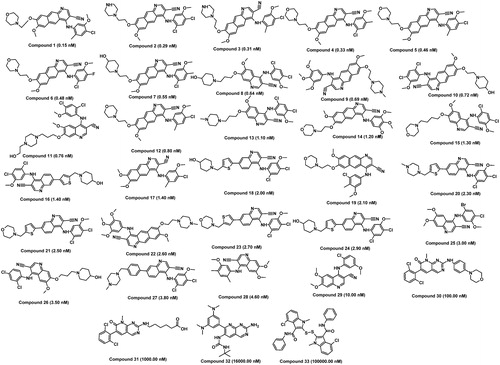
Figure 2. Chemically diverse 33 compounds used as training set in 3D-QSAR Pharmacophore generation (Discovery Studio). IC50 values are indicated in parentheses for each compound.
3D-QSAR Pharmacophore Generation module was used to construct the pharmacophore model by utilizing HBA, HBD, RA and Hy-Ar pharmacophoric features. These chemical features were selected based on the chemical features present in the training set molecules using Feature mapping module. Top 10 resultant pharmacophore models were generated from training set and their corresponding statistical parameters were used to select the best pharmacophore model (). Mainly three parameters reflect the quality of pharmacophore model: (i) RMSCitation43 indicates the quality of prediction pharmacophore model, (ii) correlation coefficient which is based on linear regression derived from the geometric fit index and (iii) cost difference is important for statistical relevance. The best pharmacophore model should have the lowest RMS, best correlation coefficient and highest cost difference. Hypo1 was selected as a best pharmacophore model based on the lowest RMS (0.64), highest cost difference (90.52) and correlation coefficient (0.97). Fixed and null costs are the two important theoretical cost calculations to determine the success of pharmacophore model. Fixed cost, also known as ideal cost represents the simplest model that fits all data perfectly. Null cost represents the highest cost of a pharmacophore with no features and estimates the activity of training set molecules. A significance of the pharmacophore model has been predicted based on the difference between null and fixed cost value (cost difference). If the cost difference is between 40 and 60 bits, it indicates that the pharmacophore model has 75–90% probability of correlating the dataCitation21. The fixed cost, total cost and null cost for Hypo1 are 126.83, 135.76 and 226.28, respectively. The difference between the null and fixed cost values is 90.52, which indicates that Hypo1 has above 90% probability of correlating the data. Two other parameters also determine the quality of pharmacophore model such as configuration cost and error cost. Configuration cost is dependent on the complexity of pharmacophore model space and should have a value less than 17 and error cost depends on the RMS deviation between the estimated and actual activity data. Hypo1 shows the configuration cost of 14.71, which was used to estimate the activity value of all training set compounds.
Table 1. Information of statistical significance values are presented in cost values measured in bits for the top 10 hypotheses as a result of automated 3D-QSAR pharmacophore generation.
Hypo1 () consists of four chemical features such as one feature from each HBA, HBD, Hy-Ar and RA; the distance between every two features is summarized in . The experimental and predicted activity values of training set and the corresponding error values are shown in . Error is the ratio of predicted activity to estimated activity. Predicted IC50 values of most of the training set compounds were found to be within the same order of magnitude.
Figure 3. Hypo1 pharmacophore model with its geometric constrains: hydrogen bond acceptor (HBA, green), hydrogen bond donor (HBD, magenta), hydrophobic aromatic (Hy-Ar, blue) and ring aromatic (RA, brown).
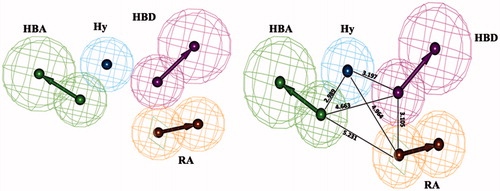
Table 2. Distance between every two features of Hypo1.
Table 3. Actual and estimated activity values of the training set molecules based on the pharmacophore model Hypo1.
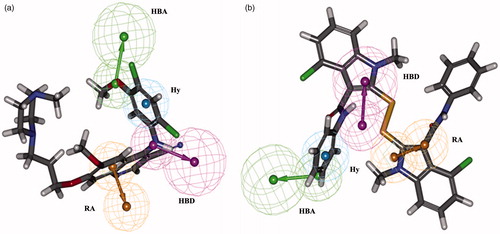
All the training set compounds are predicted in their same order of magnitude except one active was underestimated as moderately active and one moderately active compound overestimated as active. The most active compound 1 (IC50: 0.15 nM) has a fitness score value of 10.02 () when mapped with Hypo1, whereas the least active compound 33 (IC50: 100 000 nM) shows lesser value of 5.26 (). Fit value indicates how well the features in the pharmacophore overlap the chemical features present in the molecule and thereby aid in understanding the chemical meaning of the pharmacophore model.
Figure 4. Best pharmacophore model Hypo1 aligned to a training set compound. (a) Active molecule compound 1 (IC50: 0.15 nM) and (b) inactive molecule compound 33 (IC50: 100 000 nM). Hydrogen bond acceptor (HBA, green), hydrogen bond donor (HBD, magenta), hydrophobic aromatic (Hy-Ar, blue) and ring aromatic (RA, brown).
Pharmacophore validation
The selected best pharmacophore model, Hypo1, was validated by three different methods such as Fischer’s randomization method, test and decoy sets to check whether it has an ability to differentiate between the active and inactive compounds during screening process.
Fischer’s randomization method
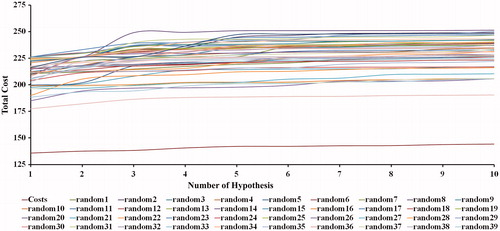
This method was applied to evaluate the statistical relevance of Hypo1. Fischer randomization program scrambled the activity values randomly from training set compounds to construct new pharmacophore model using the same input parameters which were used in the generation of original pharmacophore model. This method checks whether there is any strong correlation between the structures and activity values. The confidence level was set to 98%, so totally, 49 random spreadsheets were generated from the shuffled activity values from the training set compounds. The total costs of 49 random generated pharmacophore models are much higher than the Hypo1 (). The above results provide 98% confidence level on Hypo1, which is not generated by a chance and it represents a true correlation in the training set activity data.
Figure 5. The difference in costs between HypoGen runs and the scrambled runs. The 98% confidence level was selected.
Test set method
An independent test set was used to examine whether the selected best hypothesis is capable to predict the activities of external compounds in the same order of magnitude or not. Test set contains 40 structurally diverse compounds () from training set molecules and prepared as training set. Hypo1 was regressed against the 40 compounds which showed good correlation coefficient value of 0.93 between the experimental and predicted activity values. Overall, all highly active, inactive and 12 of 18 moderately active compounds were predicted correctly (). The four and two moderately active compounds were overestimated as active and underestimated as inactive compounds, respectively. Most of the experimental and predicted activity values of the compounds are in the same order of magnitude. The average error values are less than one order of magnitude which indicate that Hypo1 contains the key chemical features which are crucial for the inhibitors to block the activity of c-Src.
Figure 6. 2D structure of the test set molecules used in the validation of Hypo1.
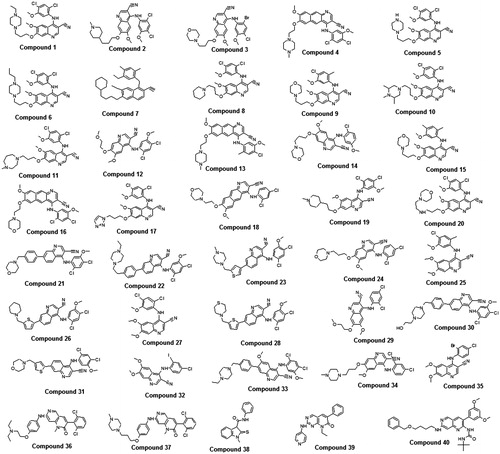
Table 4. Experimental and predicted IC50 data values of 40 test set molecules against Hypo1.
Decoy set
Decoy set was used to validate how well Hypo1 can discriminate the selective c-Src inhibitors from the decoy database. For this validation the database (D) of 1300 molecules was taken, which included 15 active (A) and 1285 inactive inhibitors of c-Src. During the screening process, Hypo1 picked 18 molecules (Ht) from the database (D), 15 were active inhibitors (Ha) of c-Src among these molecules. The calculated GH and EF values for Hypo1 were 0.87 and 7.2, respectively. GH score gives a good indication of how good the hit list is with respect to a compromise between maximum yield and maximum of active retrieved. In the best case, GH value should be 1, in our cases the value is 0.87 () which indicates that the Hypo1 has a very good ability to retrieve the active compounds from database. Finally, Hypo1 was selected as the best pharmacophore model and it was used as 3D query to retrieve the novel scaffold for c-Src inhibitors from various databases such as NCI, Maybridge and Chembridge.
Table 5. Statistical parameter from screening test set molecules.
Pharmacophore model-based virtual screening
Virtual screening of databases is an effective alternative technique for high throughput screening in drug discovery process. In drug discovery process, an automated computational tool of virtual screening is one of the important techniques to discover the novel scaffolds for the drugsCitation44. The ascertained Hypo1 was used as 3D structural query for retrieving the novel compounds from chemical databases such as NCI, Maybridge and Chembridge, which consist of 200 000, 60 000, and 50 000 compounds, respectively. As an initial screening, Hypo1 screened 8110, 21 037 and 18 656 molecules from NCI, Maybridge and Chembridge, respectively. The screened molecules were further sorted out by applying the fit value of greater than 10 (maximum fit value for the active compound in the training set); 191, 239 and 127 molecules were chosen from NCI, Maybridge and Chembridge databases, respectively. The molecular flexibility, the total number of HBA and HBD are found to be important predictors for a compound to have a good oral bioavailability. Hence, rule of five was used to sort the hit compounds from all the three databases. Totally, 39 471 compounds satisfied the following rule of fiveCitation28,Citation29 such as when they possess LogP less than 5, molecular weight less than 500, number of hydrogen bond donors less than 5, number of hydrogen bond acceptors less than 10 and number of rotatable bonds less than 10. The molecules which passed the rule of five were further sorted by applying ADMET to make them more drug-like properties. ADMET properties calculate the values of BBB penetration, solubility, Cytochrome P450 (CYP450), 2D6 inhibition, hepatotoxicity, human intestinal adsorption (HIA) and plasma protein binding (PPB) to access a broad range of toxicity measure of the ligands. Among all these criteria, we mainly focused on BBB, solubility and HIA. The solubility predicts the solubility of each compound in water at 25 °C. It has six prediction levels such as extremely low (0), very low (1), low (2), good (3), optimal (4) and too soluble (5). The BBB predicts whether the compounds will be able to pass the BBB or not. The ability of the compounds to pass the BBB was divided into four levels such as very high penetration (0), high (1), medium (2) and very low (3). The HIA is defined as a percentage absorbed rather than as a ration of concentration. A well-absorbed compound is one that is absorbed at least 90% into the blood stream in humans. The four prediction levels for HIA were good (0), moderate (1), poor (2) and very poor (3). Hence, we selected compounds that showed a good solubility, HIA, BBB level of 3, 0 and 3, respectively. Finally, 85 compounds from the three chemical databases were selected for molecular-docking study.
Structure-based molecular-docking studies
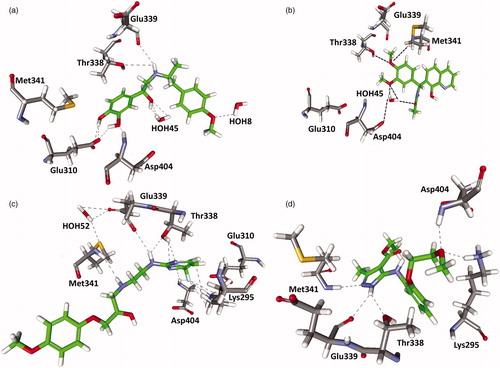
Pharmacophore modeling and molecular-docking studies are the two important methods in computer-aided drug discovery process. Molecular docking was applied to find the accurate binding orientation of ligand in protein active site. In order to refine the retrieved hits, the screened compounds from the databases were docked into the active site of c-Src using LigandFit. The 3D structure (PDB ID: 2BDJ) of c-Src was taken from PDB based on the resolution and the deposited date. 2BDJ is a complex with potent and selective tri-substituted purine-based compounds and the structure was modified in 2009. All the hit molecules (85) and 33 training set compounds were minimized and subsequently docked into the c-Src binding site. The consensus scoring was performed using various scoring functions such as PLP1, PLP2, PMF04, dock score, Jain, LigScore1, LigScore2 and LUDI. By applying the consensus scoring value, most of the active compounds present in training set were screened. Hence, this value was used to sort the hit molecules from the databases in the docking process. Based on the consensus scoring function, 30 compounds were selected as good leads. The 30 compounds were further validated by checking their critical hydrogen bond and hydrophobic interactions with vital amino acids present in c-Src active site. The c-Src protein has two different inhibitor binding modes: first one involved in the hydrogen bonding network with NH group of Met341 as a donor and the backbone carbonyl group of Glu339 as an acceptor, an additional hydrogen bond was formed in the solvent accessible area. The second binding mode shows the hydrogen bond between NH and CO of Met341 backbone interacted with appropriate inhibitor. The overall analysis suggested that the network of hydrogen bonds with Met341, Thr338 and Glu339 are the critical amino acids for the binding of the inhibitors within the hinge region of c-Src. Hence, the molecules which showed a hydrogen bond interaction with Met341, Thr338, either with Glu339 or Asp404 are considered as potent inhibitors of c-Src. From NCI database, two out of seven molecules, Maybridge 14 out of 20 compounds and from Chembridge two out of three molecules showed very good hydrogen bonds with all the critical amino acids (). Finally, 18 molecules were selected based on the consensus score and the hydrogen bond interactions with the critical amino acids. In the inclusive analysis, these final compounds could act as a good candidate compounds to inhibit the activity of the c-Src. Thus, Hypo1 will act as a valuable tool in retrieving a novel scaffold for c-Src inhibitors.
Figure 7. Molecular-docking result. (a) NCI compound, (b) Chembridge compound, (c) Maybridge and (d) Maybridge hit compound bound in the active site of c-Src. Hydrogen bonds are shown in black.
Bayesian model
Bayesian model was used to identify the vital fragment present in the scaffold of the c-Src inhibitors to inhibit the activity. The inhibitors were classified into active and inactive compounds based on their IC50 values. Inhibitors that showed a value less than 2 nM and a value greater than 2 nM were designated as active and inactive by assigning a value of 1 and 0, respectively. The calculated 2D descriptors are ALogP types Daylight Path-based Fingerprints with a diameter of 10 (LPLP10), molecular weight, number of aromatic rings, number of acceptors, number of donors, number of rings, number of rotatable bonds and molecular fractional polar surface. These descriptors were assigned as independent variables to generate a model. The good and bad fragments of c-Src inhibitors are shown in and , respectively. The generated model was validated by receiver operating characteristic (ROC) plot based on the leave-one-out cross-validation. In our case, the leave-one-out cross-validation ROC plot value was 0.94 (), which indicated that our model was excellent in distinguishing between the active and inactive. The ROC value indicates the accuracy of the model, how often the model correctly identifies the true positive and the true negative. Area under the curve plot was generated and the value indicates how often the model correctly identifies the true positive and the true negative as well as this can be used to classify the accuracy of the generated model. If the value is between 0.8 and 0.9, the model is considered as good and the value above 0.9 shows the excellent predictive power of the modelCitation42. Each sample was left out one at a time, and a model was built using the results of the samples, predicted the left-out sample. In the test set validation, the best spilt was calculated by picking the split that minimized the sum of the percent misclassified for category members and non-members. The contingency table was produced using the split which showed that all the active (17) compounds were predicted correctly and 1 inactive compound was overestimated as active (). The LPFP finger prints revealed that 20 different functional groups present in the inhibitors play a crucial role in inhibiting the activity of c-Src (). The generated enrichment shows the percentage of the true category members captured at a particular percentage cut-off. The category statistics result explains the number of members and non-members and their corresponding mean prediction for each subset along with and the estimated deviation of the predictions for each subset (). The above validation confirms that our Bayesian model is able to predict the active and inactive inhibitors of c-Src.
Figure 8. Suitable molecular fragment for c-Src inhibitor obtained from the Bayesian model.
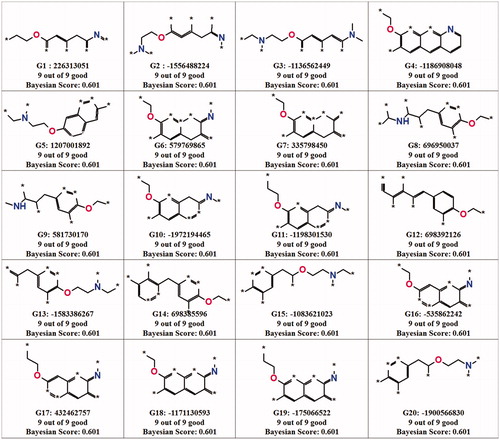
Figure 9. Non-suitable molecular fragment for c-Src inhibitor obtained from the Bayesian model.
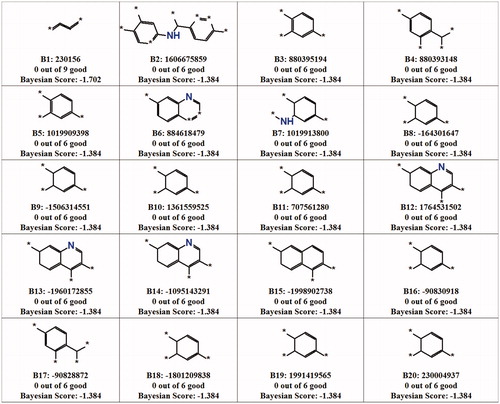
Figure 10. Receiver operating characteristic (ROC) plot of Bayesian model for c-Src inhibitors.
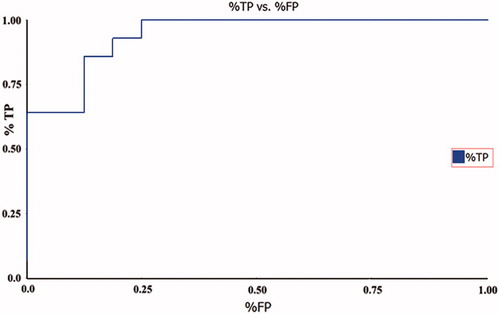
Table 6. Statistical value obtained from the Bayesian model.
Conclusions
In this work, activity-based 3D pharmacophore models of c-Src inhibitors have been developed with the aid of HypoGen algorithm implemented in DS. A highly predictive pharmacophore model, Hypo1, was selected as the best pharmacophore model from the 10 pharmacophore models. Hypo1 contains four features: one HBA, one HBD, one Hy-Ar and one RA. Hypo1 shows the lowest total cost value (135.76), the highest cost difference (90.51), the lowest RMS (0.64) and the best correlation coefficient (0.97). Fischer’s randomization method gives 98% confidence level and the test set shows a fairly good correlation between the experimental and the predicted IC50 values (correlation coefficient of 0.93), indicating a good predictive capability of Hypo1. The EF and GH values calculated from the decoy set also support that Hypo1 is able to distinguish the active from inactive c-Src inhibitors. Hence, Hypo1 was used to search the databases such as NCI, Maybridge and Chembridge and the hits were filtered by ADMET, Lipinski’s rule of five and molecular docking to refine the retrieved hits. Finally, 18 compounds were selected as potent inhibitors of c-Src. Bayesian model is generated from 30 molecules selected from the training set which revealed the suitable and not suitable chemical fragments present in the c-Src inhibitors. Thus, we conclude that Hypo1 truly reflects the features of c-Src inhibitors and should be helpful in identifying novel lead compounds with improved c-Src inhibitory activity through 3D database searches.
Declaration of interest
This research was supported by Basic Science Research Program (2009-0073267), Pioneer Research Centre Program (2009-0081539) and Management of Climate Change Program (2010-0029084) through the National Research Foundation of Korea (NRF) funded by the Ministry of Education, Science and Technology (MEST) of Republic of Korea. This work was also supported by Next-Generation BioGreen 21 Program (PJ008038) from Rural Development Administration (RDA) of Republic of Korea. The authors report no conflicts of interest.
References
- Cohen P. Protein kinases – the major drug targets of the twenty-first century. Nat Rev Drug Discov 2002;1:309–15
- Blume-Jensen P, Hunter T. Oncogenic kinase signalling. Nature 2001;411:355–65
- Michael Bradshaw J. The Src, Syk, and Tec family kinases: distinct types of molecular switches. Cell Signal 2010;22:1175–84
- Sadowski I, Stone JC, Pawson T. A noncatalytic domain conserved among cytoplasmic protein-tyrosine kinases modifies the kinase function and transforming activity of Fujinami sarcoma virus P130gag-fps. Mol Cell Biol 1986;6:4396–408
- Mayer BJ, Hamaguchi M, Hanafusa H. A novel viral oncogene with structural similarity to phospholipase C. Nature 1988;332:272–5
- Xu W, Harrison SC, Eck MJ. Three-dimensional structure of the tyrosine kinase c-Src. Nature 1997;385:595–602
- Banibrata S, Faye MJ. Regulation of Src family kinases in human cancers. J Signal Transduct 2011;2011:1–14
- Pan Q, Qiao F, Gao C, et al. Cdk5 targets active Src for ubiquitin-dependent degradation by phosphorylating Src (S75). Cell Mol Life Sci 2011;68:3425--36
- Sicheri F, Moarefi I, Kuriyan J. Crystal structure of the Src family tyrosine kinase Hck. Nature 1997;385:602–9
- Martin GS. The hunting of the Src. Nat Rev Mol Cell Biol 2001;2:467–75
- Margaret CF. Src in cancer: Deregulation and consequences for cell behaviour. Biochim Biophys Acta Rev Cancer 2002;1602:114–30
- Courtneidge SA. Role of Src in signal transduction pathways. Biochem Soc Trans 2002;30:11–17
- Kraker AJ, Hartl BG, Amar AM, et al. Biochemical and cellular effects of c-Src kinase-selective pyrido[2,3-d]pyrimidine tyrosine kinase inhibitors. Biochem Pharm 2000;60:885–98
- Blake RA, Broome MA, Liu X, et al. SU6656, a selective Src family kinase inhibitor, used to probe growth factor signaling. Mol Cel Biol 2000;20:9018–27
- Wang YD, Miller K, Boschelli DH, et al. Inhibitors of Src tyrosine kinase: the preparation and structure–activity relationship of 4-anilino-3-cyanoquinolines and 4-anilinoquinazolines. Bio Med Chem Lett 2000;10:2477–80
- Berger D, Dutia M, Powell D, et al. Substituted 4-anilino-7-phenyl-3-quinolinecarbonitriles as Src kinase inhibitors. Bio Med Chem Lett 2002;12:2989–92
- Boschelli DH, Wang DY, Ye F, et al. Inhibition of Src kinase activity by 4-anilino-7-thienyl-3-quinolinecarbonitriles. Bioorg Med Chem Lett 2002;12:2011–14
- MacKerell AD, Brooks CL, Nilsson L, et al. CHARMM: the energy function and its parameterization with an overview of the program. In: Schleyer PVR, ed. The encyclopedia of computational chemistry, Vol. 1. Chichester: John Wiley & Sons; 1998:271–7
- Brooks B, Bruccoleri R, Olafson B, et al. CHARMM: a program for macromolecular energy, minimization, and dynamics calculations. J Comput Chem 1983;4:187–217
- Sakkiah S, Thangapandian S, John S, et al. 3D QSAR pharmacophore based virtual screening and molecular docking for identification of potential HSP90 inhibitors. Eur J Med Chem 2010;45:2132–40
- Sakkiah S, Baek A, Lee KW. Pharmacophore modeling and molecular dynamics simulation to identify the critical chemical features against human sirtuin2 inhibitors. J Mol Stru 2012;1011:66–75
- Debnath AK. Generation of predictive pharmacophore models for CCR5 antagonists: study with piperidine- and piperazine-based compounds as a new class of HIV-1 entry inhibitors. J Med Chem 2003;46:4501–15
- Lu IL, Tsai KC, Chiang YK, et al. A three-dimensional pharmacophore model for dipeptidyl peptidase IV inhibitors. Eur J Med Chem 2008;43:1603–11
- National Cancer Institute. 2004. Available from: http://cactus.nci.nih.gov/download/nci [last accessed 31 Jan 2013]
- Maybridge Chemical Company Ltd. Maybridge Chemical Database. Available from: http://www.maybridge.com
- Chembridge. Available from: http://chembridge.com
- Lipinski CA, Lombardo F, Dominy BW, Feeney PJ. Experimental and computational approaches to estimate solubility and permeability in drug discovery and development settings. Adv Drug Deliv Rev 2001;46:3–26
- Lipinski CA, Lombardo F, Dominy BW, Feeney PJ. Experimental and computational approaches to estimate solubility and permeability in drug discovery and development settings. Adv Drug Deliv Rev 1997;23:3–25
- Venkatachalam CM, Jiang X, Oldfield T, Waldman M. LigandFit: a novel method for the shape-directed rapid docking of ligands to protein active sites. J Mol Graph Model 2003;21:289–307
- Sakkiah S, Thangapandian S, John S, Lee KW. Identification of critical chemical features for Aurora kinase-B inhibitors using Hip-Hop, virtual screening and molecular docking. J Mol Struct 2011;985:14–26
- Dalgarno D, Stehle T, Narula S, et al. Structural basis of src tyrosine kinase inhibition with a new class of potent and selective trisubstituted purine-based compounds. Chem Biol Drug Des 2006;67:46–57
- Gehlhaar DK, Verkhivker GM, Rejto PA, et al. Molecular recognition of the inhibitor AG-1343 by HIV-1 protease: conformationally flexible docking by evolutionary programming. Chem Biol 1995;2:317–24
- Muegge I. PMF scoring revisited. J Med Chem 2005;49:5895–902
- Jain AN. Scoring noncovalent protein-ligand interactions: a continuous differentiable function tuned to compute binding affinities. J Comput Aided Mol Des 1996;10:427–40
- Krammer A, Kirchhoff PD, Jiang X, et al. LigScore: a novel scoring function for predicting binding affinities. J Mol Graph Model 2005;23:395–407
- Böhm HJ. The computer program LUDI: a new method for the de novo design of enzyme inhibitors. J Comput Aided Mol Des 1992;6:61–78
- Friesner RA, Banks JL, Murphy RB, et al. Glide: A new approach for rapid, accurate docking and scoring. 1: method and assessment of docking accuracy. J Med Chem 2004;47:1739–49
- Glick M, Jenkins JL, Nettles JH, et al. Enrichment of high-throughput screening data with increasing levels of noise using support vector machines, recursive partitioning, and Laplacian-modified naive Bayesian classifiers. J Chem Inf Model 2005;46:193–200
- Gelman A, Carlin JB, Stern HS. Bayesian model analysis. 3rd ed. London: Chapman & Hall; 2003
- Thangapandian S, John S, Sakkiah S, Lee KW. Pharmacophore-based virtual screening and Bayesian model for the identification of potential human leukotriene A4 hydrolase inhibitors. Eur J Med Chem 2011;46:1593–603
- Oberdoerffer P, Michan S, McVay M., et al. SIRT1 Redistribution on chromatin promotes genomic stability but alters gene expression during aging. Cell 2008;135:907–18
- Imai Si, Armstrong CM, Kaeberlein M, Guarente L. Transcriptional silencing and longevity protein Sir2 is an NAD-dependent histone deacetylase. Nature 2000;403:795–800
- Grosdidier A, Zoete V, Michielin O. SwissDock, a protein-small molecule docking web service based on EADock DSS. Nucleic Acids Res 2011;39:W270–7
- Triballeau N, Acher F, Brabet I, et al. Virtual screening workflow development guided by the “Receiver Operating Characteristic” curve approach. Application to high-throughput docking on metabotropic glutamate receptor subtype 4. J Med Chem 2005;48:2534–47