
Abstract
We previously reported the inhibitory profiles of naproxen and cromolyn against glycogen synthase kinase-3β, which partly explain the molecular mechanisms of their anti-cancer properties. In this study, we performed a detailed biochemical evaluation of the two drugs against colorectal adenocarcinoma (Caco2), hepatocellular carcinoma (HepG2), mammary gland carcinoma (MCF7), epitheloid cervix carcinoma (Hela), lung carcinoma (A5W9) and epidermoid larynx carcinoma (Hep2) cell lines. Additionally, we performed cellular viability tests using trypan blue, proliferation MTT assay, apoptosis, p53 and real-time polymerase chain reaction for gene expression of survivin and caspase-3. Not only the two drugs were found to significantly reduce the viability of different cell lines, but they also were shown to have potent dose-dependent reduction of cellular proliferation. They exhibited cytotoxicity IC50 values of 3.69 and 4.16 μM for naproxen and cromolyn, respectively. Viability and proliferation results clearly correlated with apoptosis and p53 experiments in showing that both drugs significantly raised apoptotic percentages. Furthermore, we observed a significant reduction in survivin and elevation of caspase-3 gene expression upon exposure to the two drugs. It can be concluded that both naproxen and cromolyn have significant anti-cancer properties.
Introduction
Glycogen synthase kinase-3β (GSK-3β) is a multitasking serine/threonine kinase that controls various cellular pathways through inhibitory phosphorylation of different substrate proteinsCitation1–3. Different studies have correlated GSK-3β with human cancerCitation4,Citation5. Inhibition of GSK-3β can be useful in the treatment of several types of cancer, such as colorectalCitation6, ovarianCitation7, prostateCitation8 and skin cancerCitation9. GSK-3β has been shown to participate in nuclear factor-κB (NF-κB) mediated cell survivalCitation10–12, thus behaving as a tumor promoter. GSK-3β directly promotes NF-κB stability and activation through both the degradation of p105 and activation of the p65 subunitCitation13,Citation14. Furthermore, inhibition of GSK-3β prevents p53 degradation and promotes apoptosisCitation15.
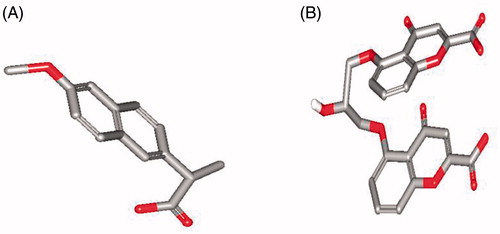
In a previous publication, we reported that both naproxen, the non-steroidal anti-inflammatory drug (NSAID) cyclooxygenase (COX-2) inhibitorCitation16, and cromolyn, the mast cell stabilizer/anti-allergic agentCitation17,Citation18, potently inhibit GSK-3β, and therefore, we decided to deeply explore the anti-cancer properties of these drugs (). Our exploration included detailed biochemical evaluation of the two drugs against colorectal adenocarcinoma (Caco2), hepatocellular carcinoma (HepG2), mammary gland carcinoma (MCF7), epitheloid cervix carcinoma (Hela), lung carcinoma (A5W9) and epidermoid larynx carcinoma (Hep2) cell lines. Additionally, we performed cellular viability tests using trypan blue, proliferation MTT assay, apoptosis, p53 and real-time polymerase chain reaction (RT-PCR) for gene expression of survivin and caspase-3.
Figure 1. Molecular structure of both naproxen (A) and cromolyn (B).
Materials and methods
Cell culture and reagents
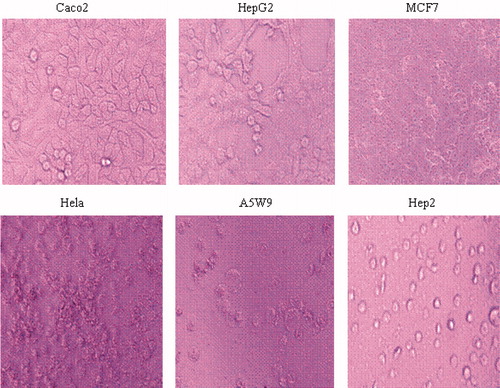
The human cancer cell lines: colorectal adenocarcinoma (Caco2), hepatocellular carcinoma (HepG2), mammary gland carcinoma (MCF7), epitheloid cervix carcinoma (Hela), lung carcinoma (A5W9) and epidermoid larynx carcinoma (Hep2) cell lines were obtained from the Egyptian Company for Vaccine and Serum (VACSERA, Cairo, Egypt) ().
Figure 2. Pictures of Caco2, HepG2, MCF7, Hela, A5W9 and Hep2 cell lines before inhibition.
The cells were cultured in RPMI 1640 (Sigma, St. Louis, MO) supplemented with 10% fetal bovine serum (Sigma, St. Louis, MO) and 100 μg/mL streptomycin, 100 U/mL penicillin. Subsequently, the cells were distributed in 96-well plates at 37 °C and 5% CO2 in air and incubated for 24, 48, 72 and 96 h with changing of medium and drug every 24 h.
Preparation of drugs doses
For in vitro experiments, the cells were subjected to different naproxen and cromolyn concentrations. Naproxen, cromolyn and GSK-3β inhibitor LiCl were added from a 1000-fold concentrated stock in the solvent, dimethyl sulfoxide (DMSO) (Sigma, St. Louis, MO) and diluted in culture media to reach 100 μL/well with final well plate concentrations 10, 100, 1000 and 10 000 nM for the compounds in triplicate. LiCl was prepared in 10, 100, 1000 and 10 000 μM. Control cultures received similar amounts of the solvent in culture media only100 μL/well in triplicate. Final concentrations of the solvent did not exceed 0.1%.
Determination of gene expression and p53 protein
The same conditions mentioned above were applied for the gene expression and p53 protein measurement. However, the concentration of naproxen, cromolyn and LiCl was the maximum concentration in triplicate and the incubation period also was the maximum 96 h. The media of these cells was isolated for the p53 protein measurement, while the cells were harvested for gene expression determination for survivin and caspase-3 genes.
Cell viability, proliferation and apoptosis
Cell viability
Cell viability measures the percentage of a cell suspension that is viable. This is generally accomplished by trypan blue dye (Sigma) exclusion, where viable cells with an intact membrane are able to exclude the dye while non-viable cells without an intact membrane take up the coloring agent. Cells were seeded into 24-well plates at a density of 1–2 × 10⁵ cells/well and drug concentration 100 μM. After 24, 48, 72 or 96 h, cells were harvested by trypsinization (trypsin 0.025%/EDTA 0.02%) before incubating with 0.2% trypan blue solution in PBS for 2 min. A total of 10 μL from each stained cells suspensions were counted using hemocytometer chamber with cells that did not incorporate the dye considered intactCitation19.
Cells proliferation
The measurement of cell proliferation was done by TACS MTT cell proliferation kit (Trevigen Inc., Wiesbaden-Nordenstadt, Germany). Cells were seeded in 96-well microtiter plates at the required concentration of 1–2 × 10⁴ cells/well and after overnight incubation the cells were exposed to the treated media. After 24 h cells incubation, 10 μL of tetrazolium compound, MTT (3-[4,5-dimethylthiazol-2-yl]-2,5-diphenyltetrazolium bromide) was added to the wells and the cells were incubated 2–4 h at 37 °C. MTT was reduced by metabolically active cells to insoluble purple formazan dye crystals. When purple precipitate was clearly visible under the microscope, 100 μL of detergent reagent was added to all wells, including control wells. The covered plate was left in the dark at 18–24 °C for overnight. After that, plate cover was opened and the absorbance was measured of the wells, including the blanks, at 570 nm with a reference wavelength of 650 nm.
A change of medium and drug was carried out every 24 h, and the same procedure was done for 48, 72 and 96 h groupsCitation20. The average was calculated and the blank average value was subtracted, followed by plot survival fraction percentage; the percentage of the average of each concentration group divided on the DMSO control average that was without drug treatment; versus concentration in different time periods.
Cells apoptosis
Programmed cell death, apoptosis was measured for each group through the subtraction of the survival fraction percentage for the highest concentration of each group after 96 h from 100 to yield the death percentage which reflects the degree of apoptosis.
Human p53
Human p53 is a tumor suppressor gene that induces apoptosis. The initiated p53 protein acts to induce cell cycle arrest or apoptosis in response to DNA damage. Because of that, p53 protein was measured by human p53 Platinum ELISA kit (Bioscience, Vienna, Austria). A total of 50 μL sample diluent was added to 50 μL samples; the treated and control untreated groups. Subsequently, 50 μL of biotin conjugate was pipetted and the wells were incubated for 2 h at 18–25 °C with 100 rpm shaking. After washing process, 100 μL streptavidin–HRP was added to each well. Another hour incubation period at room temperature with shaking was performed. Subsequently, the wells were aspirated and washed. Finally, a total of 100 μL of TMB substrate chromogen solution aliquots was added to all wells and incubated for 10 min. At the end, 100 μL stop solution was added to terminate the reaction and the absorbances were measured spectrophotometrically at λ of 450 nm.
Real-time PCR
Isolation of total mRNA
Total RNA was extracted from Caco2, HepG2, MCF7, Hela, A5W9 and Hep2 cell lines using SV total RNA isolation system (Promega, Madison, WI).
cDNA synthesis
The extracted RNA was reverse transcribed into cDNA using RT-PCR kit (Stratagene, La Jolla, CA). M-MuLV reverse transcriptase was used. A total of 1 μL of oligo dT (Roche Applied Science, Indianapolis, IN) to 10 μL of mRNA which was denatured for 2 min at 70 °C in the thermal cycler (Omnigene, London, UK). Reaction mixtures contained 10 mM dNTP mix, 40 U RNase inhibitor (Roche), and 50 U MMuLV reverse transcriptase in reaction buffer. After 1 h incubation for the last mixture at 37 °C in the programmed thermal cycler, reactions were stopped by heating at 95 °C, for 10 min.
Analysis of survivin and caspase-3 genes expression using quantitative RT-qPCR: For quantitative RT reverse transcriptase (qRT-PCR) analysis, cDNA reaction mixtures were mixed with twice AB solute qRT-PCR SYBR@ green ROX master mix (Abgene, Hamburg, Germany) and the appropriate primers then filled with deionized water to 25 μL. qRT-PCRs were performed in triplicates in an Applied Biosystems Step One@ RT-PCR system (Applied Biosystems, Tokyo, Japan) with 15 min as initial stage at 95 °C to activate the DNA polymerase, followed by 40-PCR cycles of 95 °C for 15 s and 60 °C for 1 min. Dissociation curves were generated by heating to 95 °C for 15 s, 60 °C for 30 s and 95 °C for 15 s. Statistical analysis was performed on at least three independent experiments and the ΔΔCt = ΔCT test drug (CT-treated cells–CT reference home gene GAPDH (glycerol aldehyde phosphate dehydrogenase))–ΔCT calibrator (CT control untreated cells–CT reference home gene GAPDH) were calculated. Then, 2−ΔΔCt gives the relative quantification gene expression compared to the control this method was earlier describedCitation21. Standardization was performed by quantification of the GAPDH gene as an endogenous control. Primers (Invitrogen, Freiburg, Germany) sequences (forward and reverse, respectively) were used for conventional and qRT-PCR as follows: survivin; 5′-ATG GCA CGG CGC ACT TT-3′, 5′-TCC ACT GCC CCA CTG AGA A-3′ and caspase3; 5′-CAT GAT TAG CAA GTT ACA GTG ATG C-3′, 5′-CAC AGT CTT AAG TGG GGG GA-3′. Agarose gel electrophoresis was performed; 1% agarose gel containing 0.05% ethidium bromide; and the image was captured for the resulted products. Survivin and caspase3 expression amplified bands was visualized in the images.
Results and discussion
In a previously published article, we proved that naproxen and cromolyn potently inhibit GSK-3β prompting our current exploration of their anti-cancer activities. Many inhibitors were developed because of the vital role of GSK-3β inhibition in the treatment of different types of cancerCitation4–9.
The effect of naproxen and cromolyn on cell viability by trypan blue is presented in . The cell number percentage compared to control were given an average percentage of 44.6, 45.6 and 47.1 after 72 h and 41.2, 42.9 and 44.3 after 96 h for naproxen, cromolyn and LiCl, respectively. A significant reduction in the average viability ratios were observed for the two drugs. These results encouraged us for further evaluation of the cell line proliferation by MTT assay and determination of their cytotoxicity IC50 values. The proliferation results were expressed by survival fraction percentages of Caco2, HepG2, MCF7, Hela, A5W9 and Hep2 cell lines. Dose-dependent inhibition of these cell lines after exposure for naproxen, cromolyn and LiCl is shown in , respectively. A significant reduction in survival percentages appeared after 72 and 96 h by 1 and 10 μM concentrations. Moreover, survival percentages were supported by their cytotoxicity IC50 values that inhibit cell growth by 50% after incubation, as given in . Overall average IC50 values were yielded 4.37, 4.53 μM and 4.62 mM after 72 h and 3.69, 4.16 μM and 4.20 mM after 96 h for naproxen, cromolyn and LiCl, respectively. These IC50 results were almost near by the GSK-3β inhibitory IC50 1.5 μM for naproxen and 2 μM for cromolyn. The viability, proliferation and cytotoxity results were supported together and forced us for further evaluation of the death ratios or apoptosis. A significant elevation of 57.07, 52.8 and 54.49 minimum to 60.81, 59.18 and 56.96 maximum apoptotic percentages for naproxen, cromolyn and LiCl, respectively, compared to the DMSO control group are clarified in . To complete the apoptotic process validation p53 protein was measured for the compounds. p53 is the most commonly mutated gene in human cancer and is considered a stress response gene. The p53 protein acts to induce cell cycle arrest or apoptosis in response to DNA damage, thereby maintaining genetic stability in the organism. p53 was shown to be capable of suppressing the proliferation of transformed cells and its function is essential for the maintenance of the non-tumorgenic phenotype of cells. As a result, it plays a vital role in suppressing the development of cancerCitation22,Citation23. An elevation of 26.1, 20.0 and 16.75 U/mL, the minimum, and 40.63, 35.38 and 39.63 U/mL, the maximum, in p53 levels compared to the control for naproxen, cromolyn and LiCl, respectively, is shown in . All the obtained results exaggerate each other that directed us to examine it by the genetic levels through the determination of survivin and caspase-3 genes expression. The expression for survivin; the survival marker for cancerous cellsCitation24–26; and caspase-3; the cell death sequencerCitation27–30; genes participated in our knowledge for naproxen, cromolyn and LiCl anti-cancer activities. After the calculation of 2−ΔΔCt relative gene expression compared to control group () illustrated that naproxen, cromolyn and LiCl survivin expression values were markedly reduced. The lowest relative expression values were 0.048, 0.099 and 0.0064 compared to control. Moreover, the highest relative expression values were presented as 0.586, 0.981 and 0.845, in the same order compared to control. The apparent percent less than 1.0 that means a reduction in cell survival for these cells by the effects of drugs. Caspase-3 that reflects the degree of death was expressed in this manner to give 2.4, 2 and 2.3, the lowest relative expression values, and 8.77, 10.36 and 10.34, the highest relative expression values, for naproxen, cromolyn and LiCl, respectively, compared to control, as shown in . These results were all approximately over 2.0. Thus, most of treated drugs groups have been relatively higher in death sequence than the control. Survivin and caspase-3 expressions are visulized in Figure 8(A) and (B), respectively via gel electrophoresis bands.
Figure 3. Effects of treatment with naproxen different concentrations and the control DMSO against in vitro proliferation (survival fraction percentage) of Caco2, HepG2, MCF7, Hela, A5W9 and Hep2 cell lines. Mean survival fraction percentage ± SD are the presented data and (*) p value < 0.05 compared to control.
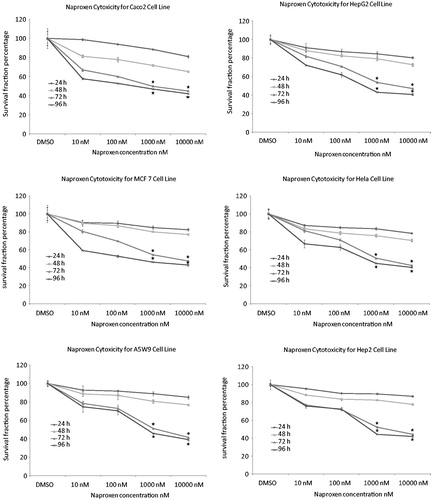
Figure 4. Effects of treatment with cromolyn different concentrations and the control DMSO against in vitro proliferation (survival fraction percentage) of Caco2, HepG2, MCF7, Hela, A5W9 and Hep2 cell lines. Mean survival fraction percentage ± SD are the presented data and (*) p value < 0.05 compared to control.
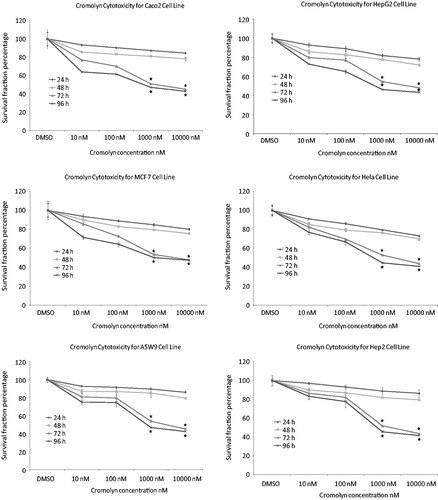
Figure 5. Effects of treatment with Known GSK3β inhibitor LiCl different concentrations and the control DMSO against in vitro proliferation (survival fraction percentage) of Caco2, HepG2, MCF7, Hela, A5W9 and Hep2 cell lines. Mean survival fraction percentage ± SD are the presented data and (*) p value < 0.05 compared to control.
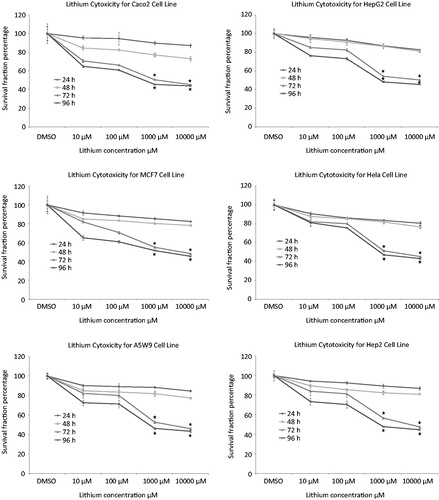
Figure 6. Effects of treatment with naproxen, cromolyn and LiCl highest concentrations 10000 nM and the control DMSO after 96 h on in vitro apoptosis (A) of Caco2, HepG2, MCF7, Hela, A5W9 and Hep2 cell lines and human p53 concentrations for the same conditions and (B) mean ± SD are the presented data and (*) p value < 0.05 compared to control.
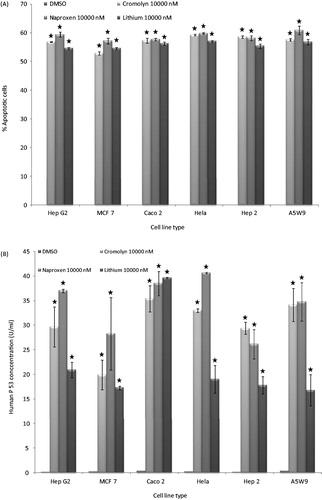
Figure 7. Effects of treatment with naproxen, cromolyn and LiCl highest concentrations 10 000 nM and the control DMSO after 96 h on in vitro relative survivin (A) and caspase3 (B) genes expression of Caco2, HepG2, MCF7, Hela, A5W9 and Hep2 cell lines.
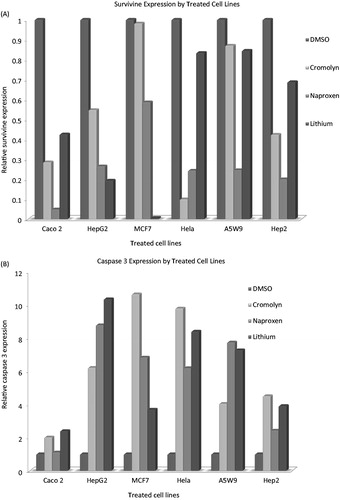
Figure 8. Agarose gel electrophoresis bands of survivin (A) and caspase3 (B) genes after treatment with naproxen, cromolyn and LiCl highest concentrations 10 000 nM and the control DMSO for 96 h on Caco2, HepG2, MCF7, Hela, A5W9 and Hep2 cell lines.
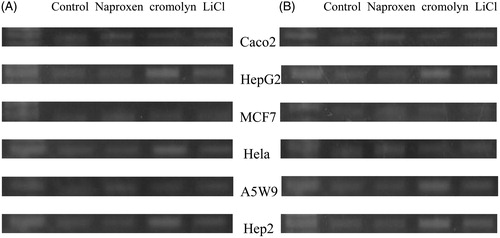
Table 1. Cell viability (number) of GSK3β inhibitors against different cell lines by Trypan blue assay after 72 and 96 h.
Table 2. Cytotoxicities (IC50 in μM for naproxen and cromolyn, while LiCl in mM) of GSK3β inhibitors against different cell lines after 72 and 96 h by MTT proliferation assay.
Naproxen anti-cancer explanation in combination with calcitriol in recurrent prostate cancerCitation31 was not complete. Genetic and clinical studies proved that higher expression of COX-2 is one of the key steps in carcinogenesis and progressionCitation32–34 that is regulated by GSK-3β in gastric cancer cellsCitation35. Since naproxen NSAID inhibits COX-2Citation16, the first anti-cancer prevention and treatment agent in this group was acetyl salicylic acid (Aspirin) along with sulindac and celecoxibCitation36,Citation37. In the other hand, the mast cell stabilization by cromolyn participated in the treatment of some other types of cancers like the pancreatic cancerCitation38–41. In our study, the significant reduction in viability and proliferation percentages was supported by the cytotoxicity IC50 values of 3.69 and 4.16 μM for naproxen and cromolyn, respectively. Apparently, these results were close to the inhibitory GSK-3β IC50 values of 1.5 μM for naproxen and 2 μM for cromolyn. In the same direction, apoptotic percentages and p53 values were increased. Not only the RT-PCR results showed a reduction of cell survival reflected by survivin gene expression values, but also the cell death reflected by caspase-3 gene expression values were observed. This may have contributed, at least partially, to their anti-cancer effects through their inhibitory properties against GSK-3β as mentioned.
Conclusion
Based on the naproxen and cromolyn GSK-3β inhibition, the explored anti-cancer effects against Caco2, HepG2, MCF7, Hela, A5W9 and Hep2 cell lines show a significant reduction in viability, proliferation and survivin gene expression percentages. Supporting these findings, apoptosis, p53 values and caspase-3 gene expression were raised and paralleled with the previous results. Overall, naproxen and cromolyn had, at least partially, some effects against cancer.
Declaration of interest
The authors report no declarations of interest.
Acknowledgements
This study was supervised by the Faculty of Pharmacy at the Cairo University (PhD Thesis of Mohamed A. S. Al-Ghussein). The authors wish to thank the Biochemistry and Molecular Biology Unit at the Faculty of Medicine, Cairo University. The authors would like to thank also the Faculty of Pharmacy and the Drug Design unit at the University of Jordan.
Related Research Data
References
- Manoukian AS, Woodgett JR. Role of glycogen synthase kinase-3 in cancer: regulation by Wnts and other signaling pathways. Adv Cancer Res 2002;84:203–29
- Doble BW, Woodgett JR. GSK-3: tricks of the trade for a multi-tasking kinase. J Cell Sci 2003;116:1175–86
- Jope RS, Johnson GVW. The glamour and gloom of glycogen synthase kinase-3. Trends Biochem Sci 2004;29:95–102
- Liao X, Zhang L, Thrasher JB, et al. Glycogen synthase kinase-3β suppression eliminates tumor necrosis factor-related apoptosis-inducing resistance in prostate cancer. Mol Cancer Ther 2003;2:1215–22
- Mazor M, Kawano Y, Zhu H, et al. Inhibition of glycogen synthase kinase-3 represses androgen receptor activity and prostate cancer cell growth. Oncogene 2004;23:7882–92
- Shakoori A, Ougolkov A, Yu ZW, et al. Deregulated GSK3 beta activity in colorectal cancer: its association with tumor-cell survival and proliferation. Biochem Biophys Res Commun 2005;334:1365–73
- Wulfkuhle JD, Aquino JA, Calvert VS, et al. Signal pathway profiling of ovarian cancer from human tissue specimens using reverse-phase protein microarrays. Proteomics 2003;3:2085–90
- Liao X, Thrasher JB, Holzbeierlein J, et al. Glycogen synthase kinase-3 activity is required for androgen-stimulated gene expression in prostate cancer. J Endocrinol 2004;145:2941–9
- Leis H, Segrelles C, Ruiz S, et al. Expression, localization, and activity of glycogen synthase kinase 3β during mouse skin tumorigenesis. Mol Carcinog 2002;35:180–5
- Ougolkov AV, Fernandez-Zapico ME, Savoy DN, et al. Glycogen synthase kinase-3β participates in nuclear factor κB-mediated gene transcription and cell survival in pancreatic cancer cells. Cancer Res 2005;65:2076–81
- Hoeflich KP, Luo J, Rubie EA, et al. Requirement for glycogen synthase kinase-3β in cell survival and NF-κB activation. Nature 2000;406:86–90
- Schwabe RF, Brenner DA. Role of glycogen synthase kinase-3 in TNF-α-induced NF-κB activation and apoptosis in hepatocytes. Am J Physiol Gastrointest Liver Physiol 2002;283:G204–11
- Demarchi F, Bertoli C, Sandy P, Schneider C. Glycogen synthase kinase-3β regulates NF-κB1/p105 stability. J Biol Chem 2003;278:39583–90
- Schwabe RF, Brenner DA. Role of glycogen synthase kinase-3 in TNF-α-induced NF-κB activation and apoptosis in hepatocytes. Am J Physiol 2002;283:G204–11
- Kulikov R, Boehme KA, Blattner C. Glycogen synthase kinase 3-dependent phosphorylation of Mdm2 regulates p53 abundance. Mol Cell Biol 2005;25:7170–80
- Lichtenberger LM, Romero JJ, Dial EJ, Moore JE. Naproxen-PC: a GI safe and highly effective anti-inflammatory. Inflammopharmacology 2009;17:1–5
- Foreman JC, Haliett MB, Mongar JL. Site of action of the anti-allergic drugs cromoglycate and doxantrazole. Br J Pharmacol 1981;11:473P–4P
- Storms W, Kaliner MA. Cromolyn sodium: fitting an old friend into current asthma treatment. J Asthma 2005;42:79–89
- Ribeiro G, Benadiba M, Colquhoun A, de Oliveira Silva D. Diruthenium (II, III) complexes of ibuprofen, aspirin, naproxen and indomethacin non-steroidal anti-inflammatory drugs: synthesis, characterization and their effects on tumor-cell proliferation. Polyhedron 2008;27:1131–7
- Van de Loosdrecht AA, Beelen RH, Ossenkoppele GJ, et al. A tetrazolium based colorimetric MTT assay to quantitate human monocyte mediated cytotoxicity against leukemic cells from cell lines and patients with acute myeloid leukemia. J Immunol Methods 1994;174:311–20
- Livak KJ, Schmittgen TD. Analysis of relative gene expression data using real-time quantitative PCR and the 2−ΔΔCt method. Methods 2001;25:402–8
- Bates S, Vousden KH. Mechanisms of p53-mediated apoptosis. Cell Mol Life Sci 1999;55:28–37
- Bennett M, Macdonald K, Chan SW, et al. Cell surface trafficking of Fas: a rapid mechanism of p53 mediated apoptosis. Science 1998;282:290–3
- Asanuma K, Kobayashi D, Furuya D, et al. A role for survivin in radio resistance of pancreatic cancer cells. Jpn J Cancer Res 2002;93:1057–62
- Sarela AI, Verbeke CS, Ramsdale J, et al. Expression of survivin, a novel inhibitor of apoptosis and cell cycle regulatory protein, in pancreatic adenocarcinoma. Br J Cancer 2002;86:886–92
- Altieri DC. The molecular basis and potential role of surviving in cancer diagnosis and therapy. Trends Mol Med 2001;7:542–7
- Lavrik IN, Golks A, Krammer PH. Caspases: pharmacological manipulation of cell death. J Clin Invest 2005;115:2665–72
- Blanc C, Deveraux QL, Krajewski S, et al. Caspase-3 is essential for procaspase-9 processing and cisplatin-induced apoptosis of MCF-7 breast cancer cells. Cancer Res 2000;60:4386–90
- Yang X-H, Sladek TL, Liu X, et al. Reconstitution of caspase 3 sensitizes MCF-7 breast cancer cells to doxorubicin- and etoposide-induced apoptosis. Cancer Res 2001;61:348–54
- Evan GI, Vousden KH. Proliferation, cell cycle and apoptosis in cancer. Nature 2001;411:342–8
- Srinivas S, Feldman D. A phase II trial of calcitriol and naproxen in recurrent prostate cancer. Anticancer Res 2009;29:3605–10
- Hussain T, Gupta S, Mukhtar H. Cyclooxygenase-2 and prostate carcinogenesis. Cancer Lett 2003;191:125–35
- De Marzo AM, Nakai Y, Nelson WG. Inflammation, atrophy and prostate carcinogenesis. Urol Oncol 2007;25:398–400
- Cohen BL, Gomez P, Omori Y, et al. Cyclooxygenase-2 (COX-2) expression is an independent predictor of prostate cancer recurrence. Int J Cancer 2006;119:1082–7
- Thiel A, Heinonen M, Rintahaka J, et al. Expression of cyclooxygenase-2 is regulated by glycogen synthase kinase-3β in gastric cancer cells. J Biol Chem 2006;281:4564–9
- Yona D, Arber JN. Coxibs and cancer prevention. J Cardiovasc Pharmacol 2006;47:S76–81
- Thun MJ, Henley SJ, Patrono C. Nonsteroidal anti-inflammatory drugs as anticancer agents: mechanistic, pharmacologic, and clinical issues. J Natl Cancer Inst 2002;94:252–66
- Ribatti D, Crivellat E, Roccaro AM, et al. Mast cell contribution to angiogenesis related to tumour progression. Clin Exp Allergy 2004;34:1660–4
- Chichlowski M, Westwood GS, Abraham SN, Hale LP. Role of mast cells in inflammatory bowel disease and inflammation-associated colorectal neoplasia in IL-10-deficient mice. PLoS One 2010;5:e12220–8
- Arumugam T, Ramachandran V, Logsdon CD. Effect of cromolyn on S100P interactions with RAGE and pancreatic cancer growth and invasion in mouse models. J Natl Cancer Inst 2006;98:1806–18
- Arumugam T, Simeone DM, Schmidt AM, Logsdon CD. S100P stimulates cell proliferation and survival via receptor for activated glycation end products (RAGE). J Biol Chem 2004;279:5059–65