
Abstract
Forty anthraquinone derivatives have been downloaded from PubChem database and investigated in a quantitative structure-activity relationships (QSAR) study. The models describing log P and LD50 of this set were built up on the hypermolecule scheme that mimics the investigated receptor space; the models were validated by the leave-one-out procedure, in the external test set and in a new version of prediction by using similarity clusters. Molecular docking approach using Lamarckian Genetic Algorithm was made on this class of anthraquinones with respect to 3Q3B receptor. The best scored molecules in the docking assay were used as leaders in the similarity clustering procedure. It is demonstrated that the LD50 data of this set of anthraquinones are related to the binding energies of anthraquinone ligands to the 3Q3B receptor.
Introduction
Anthraquinones are aromatic compounds usually present as one specific isomer, 9,10-anthraquinone (IUPAC: 9,10-dioxoanthracene). Anthraquinones are found in various organisms, including bacteria, fungi, plants, as well as in some marine animals and terrestrial insectsCitation1–3. In higher plants, anthraquinones serve as secondary metabolites and display numerous biological activitiesCitation4.
The notion of similarity is strongly dependent on the current use to which similarity is addressed. Molecules can be described in various ways: by molecular graphs, by atoms position, by molecular fields, etc. Quantitative similarity measures can be developed for each of the above descriptionsCitation5.
Quantitative Structure-Activity Relationship (QSAR) is a powerful method for the design of bioactive compounds and prediction of their activity or physical-chemical properties. The aim of this work was to determine predictive QSAR modelsCitation6 for log P and LD50 of 40 anthraquinone derivatives downloaded from PubChem Database.
The octanol–water partition coefficient (log P) is related to the hydrophobicity of molecules and their transport to biological receptorsCitation7. LD50 refers to the toxicity of molecules, being the concentration needed to kill 50% of the tested animalsCitation8.
Structural molecular data
A set of 40 anthraquinones were taken from PubChem DatabaseCitation9 (); the set was divided into a training set (25 molecules) and a test set (15 molecules), taken randomly. The property chosen for modeling was log P (calculated, ) and LD50 (on rat, oral route administrated, ).
Table 1. Anthraquinone molecular structures and their log P (taken from PubChem).
Table 2. List of ligands showing their molecular weight and formula, hydrogen bond acceptors, hydrogen bond donors and torsions.
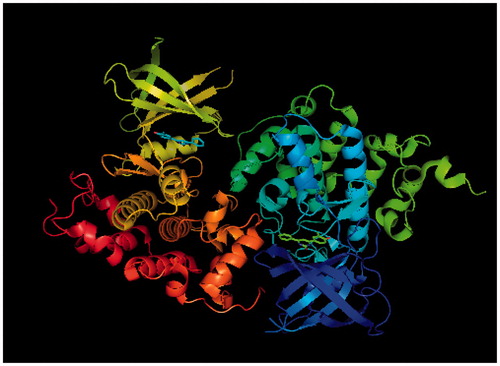
A hypermolecule () that mimics the investigated receptor space was bult up from the common features of the molecules in the dataset. Superposition of actual molecular structures over the hypermolecule was performed by HyperChem 8.0 program (http://www.hyper.com/) in order to minimize the sum of square distances between equivalent atomsCitation10,Citation11. The result of this superposition/mapping was a binary vector that collects the mapping information. Later, values 1 will be changed with the corresponding mass fragments and partial charges, respectively (Section “Results and discussion”). The protein glycogen synthase kinase-3 beta receptor () was downloaded from RCSB protein data bank and bears the PDB code-3Q3BCitation12.
Figure 1. The hypermolecule comprising common features of the dataset.
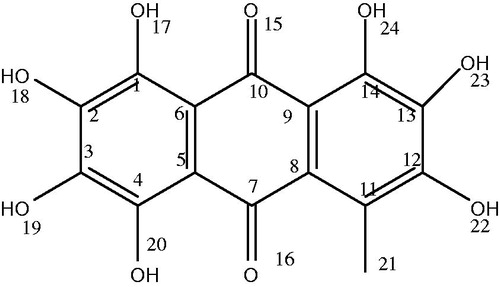
Figure 2. Glycogen synthase kinase-3 beta receptor, PDB Entry ID: 3Q3B, obtained from RCBS Protein data bank.
Docking setup
Anthraquinone derivatives (optimized at Hartree-Fock HF (3-21 g(p)) level of theory) were docked to the target 3Q3B receptor with the protein molecule considered as a rigid body and the ligands being flexible. The Lamarckian genetic algorithm was used to search for the best conformers; it searches for an empirical binding free energy that allows the prediction of binding affinity for docked ligandsCitation13. Grid menu was toggled, after loading protein.pdbqt and the map files were selected directly with setting up the grid points with 40 × 40 × 40 Å3 dimensions, at 0.375 Å cell, centered on (x,y,z) 24.569, −0.448, 21.386; (3Q3B), with 41 non-bonded atoms. The investigated anthraquinone derivatives were loaded and their torsions along the rotatable bonds () were assigned, next their files were saved as ligand.pdbqtCitation14.
Docking results
The ligands docked at Glycogen synthase kinase-3 beta (3Q3B) protein have shown the best fit (Root Mean Square Difference (rmsd) value are calculated relative to the best mode and use only movable heavy atoms)Citation15; docking data refer to the best nine ligand conformersCitation16. The compound #1, 4, 5 and 6 had shown the lowest affinity (−8 kcal/mol) while molecules #7, 10, 16, 19, 37 and 38 the highest affinity (−8.8 kcal/mol), see ; among the ligands with the highest affinity to 3Q3B protein, will be employed in the similarity clustering procedure (Section “Similarity cluster validation”). shows the binding energies of the ligand dockingCitation17.
Figure 3. Binding energy (kcal/mol) for the docked ligands.
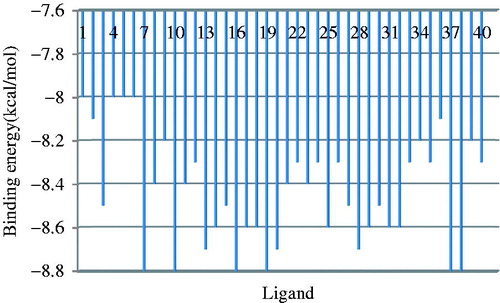
Table 3. Final lamarckian genetic algorithm docked state – binding energy for nine ligand conformations.
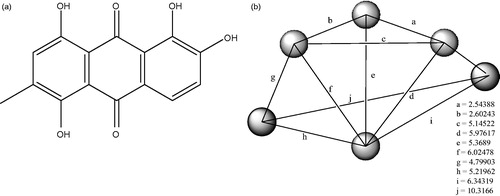
To obtain the pharmacophore for the interaction of anthraquinones with the 3Q3B protein, which could be inferred in their toxicity, the conformers with the highest affinity, as resulted from the docking procedure, have been selected; these are ligands 7, 10, 16, 19, 37 and 38 (binding energy −8.8 kcal/mol). The resulting pharmacophore is shown in and .
Figure 4. (a): Pharmacophore model for the receptor glycogen synthase kinase-3 beta. (b): Selected data on the pharmacophore model of anthraquinone/3Q3B protein interaction.
Computational details
Molecular structures have been optimized at HF (3-21 g(p)) level of theory, in gas phase, by Gaussian 09Citation18. Topological indices have been computed by TOPOCLUJ software; some of them (Sum-descriptor SDk, sum of distances (i.e. the Wiener indexCitation19) Di, sum of genuine distances D3D, HOMO energy, total adjacency Adj and Cluj indices (on detour CfDe and on distance CFDi, respectively)Citation20 are listed in and .
Table 4. LD50, sum descriptor and topological indices for the set of 40 anthraquinone derivatives.
Table 5. Topological indices computed for the anthraquinone in .
The QSAR models fit abilities were assessed by the leave one out analysisCitation21 using a dedicated softwareCitation22,Citation23.
Results and discussion
Two cases are discussed in the Hypermolecule description: (1) mass fragments (log P) and (2) partial charges (as computed by Gaussian at HF level of theory) (for LD50).
Mass fragments description (for log P)
According to the binary vector of ligand superposition over the hypermolecule, the 1-values were changed with the mass number of each vertex, thus resulted in a more specific description of physico-chemical properties of ligandsCitation24.
Data reduction
The descriptors with variance <10% (i.e., the variance of non-zero values) and intercorrelation larger than 0.80 (it means two highly correlated descriptors bring quite the same information on the topology of molecule, one of the two being sufficient) were discarded. Correlation weighing was performed on all the positions of hypermolecule: the correlating coefficients of the statistically significant positions of the hypermolecule were used to multiply the local descriptors, thus resulting new weighted vectors CDij. Next, the new correlating descriptors are summed to give a global descriptor, . This new descriptor is a linear combination of the local correlating descriptors for the significant positions in the hypermolecule (e.g.). It correlates with log P as below:
QSAR models
The models were performed on the training set (the first 25 structures in ) and the best results (in decreasing order of R2) are listed below and in .
Monovariate regression log P = 22.350 + 1.071 × SD
Bivariate regression log P = 22.791 + 1.110 × SD + 0.001 × D3D
Three-variate regression log P = 27.550 + 1.147 × SD−0.293 × Adj + 0.004 × Di
Five-variate regression log P = 41.197 + 1.087 × SD−1.087 × Adj + 0.004 × D3D + 0.1015 × CfDe
Table 6. The best models in describing log P in the training set of anthraquinone in .
Model validation
Leave-one-out
The performances in leave-one-out analysis related to the models listed as best in are shown in . The values of R2–Q2 show a good predictability of models.
Table 7. Leave-one-out analysis for best log P models in .
External validation
The values log P for the test set of anthraquinones were calculated by using equation in , entry 11. Data are listed in and the monovariate correlation: n = 15; R2 = 0.754; s = 0.201; F = 39.749 is plotted in .
Figure 5. The plot log P versus log Pcalc. for the test set (mass fragments, external validation).
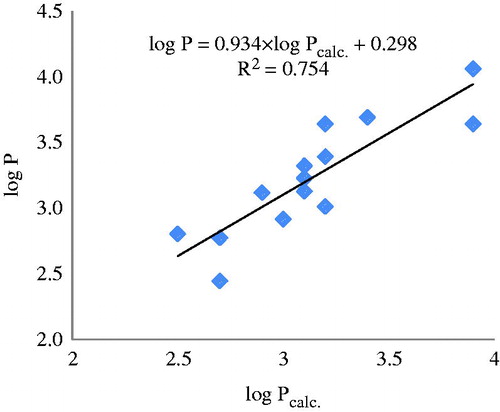
Table 8. Calculated values of log P for the molecules in the test set (mass fragments) .
Similarity cluster validation
Clusters of similarity were performed by using as leaders the 15 molecules in the external set; each leader will have its own cluster, selected by 2D similarity among the 25 structures of the initial learning set. The values log Pcalc. were computed by 15 new equations (the leader being left out) with the same descriptors as in , entry 11. Data are listed in and the monovariate correlation: n = 15; R2 = 0.961; s = 0.080; F = 317.747 is plotted in .
Figure 6. The plot log P versus log Pcalc. by similarity clusters (mass fragments).
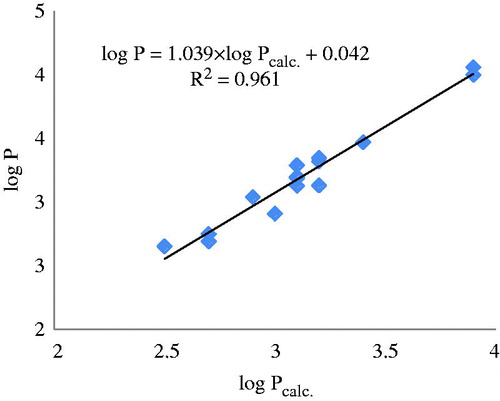
Table 9. Calculated values of log P by similarity clusters, for the molecules in the test set (mass fragments) ().
The prediction of log P is much better done by using the clusters of similarity () that by the classical external validation of the model ().
Partial charges description; LD50
In this section, the weighted vector was completed by weighting the binary vector of ligand superposition over the hypermolecule by partial charges (computed at HF (3−21 g(p)) level of theory) for every molecule.
Data reduction
The procedure in the same as described in the Section “Data reduction”. The new descriptor SDLD50 correlates with LD50 as below:
QSAR models
The models were performed on the training set (17 structures in ) and the best results (in decreasing order of R2) are listed below and in .
Monovariate regression LD50 = 12298.6 + 0.986 × SDLD50
Bivariate regression LD50 = 12286.2 + 0.989 × SDLD50 + 0.059 × D3D
Three-variate regression LD50 = 11832.36 + 1.017 × SDLD50 + 18.889 × CjDe−52.112 × CfDe
Five-variate regression LD50 = 14921.91 + 1.053 × SDLD50−155.286 × C + 190.495 × CjDe−178.9 × CfDe
Table 10. The best models in describing LD50 in the training set of anthraquinone in .
Model validation
Leave-one-out
The performances in leave-one-out analysis related to the models listed as best in are presented in .
Table 11. Leave-one-out analysis for best LD50 models in .
External validation
The values LD50calc. for each of the 12 molecules in the test set were chosen based on the lowest energy docking and computed with the same descriptors as in , entry 10. Data are listed in and the monovariate correlation: n = 12; R2 = 0.904; s = 477.245; F = 95.201 plotted in .
Figure 7. The plot LD50 versus LD50calc. for the test set (partial charges, external validation).
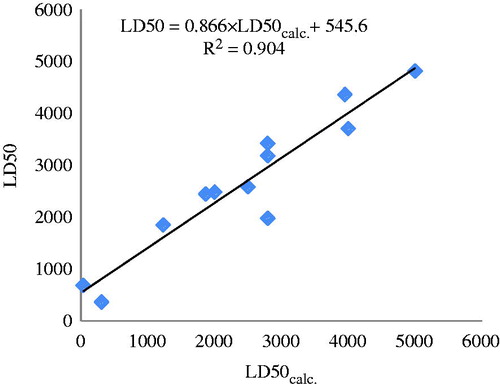
Table 12. Calculated values of LD50 for the molecules in the test set (partial charges).
Similarity cluster validation
The clusters of similarity in this section were performed by using as leaders the 12 molecules best scored in the docking step, in the same manner as in Section “Similarity cluster validation”.
The predicted values LD50 are listed in and the monovariate correlation: n = 12; R2 = 0.959; s = 314.696; F = 231.948 plotted in .
Figure 8. The plot LD50 versus LD50calc. by similarity clusters (partial charges).
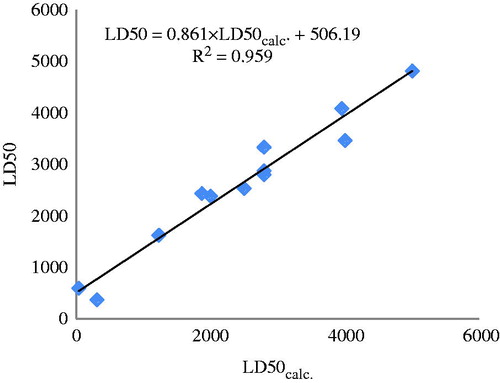
Table 13. Calculated values of LD50 by similarity clusters, for the molecules in the test set (partial charges).
Compare the results in and to see: (i) a rather low prediction (R2 = 0.904) by the external test set and (ii) a better prediction (R2 = 0.959) by the same set predicted by the similarity clusters (approaching to the congeneric status), even the test set has been chosen the one with the lowest docking energies. This result put our approach in a favorable light and demonstrates its utility in QSAR studies.
Conclusions
A set of 40 anthraquinone, downloaded from the PubChem database, was submitted to a QSAR study, the modeled property/activity being log P and LD50. The set was split into a learning set and a test set, used in the model (external) validation. Also, the validation was made by a new version of prediction by using similarity clusters.
Glycogen synthase kinase 3 beta has been investigated for its potential binding affinity with selective anthraquinone derivatives. The docking test of the studied anthraquinones have shown binding energies in the range of −8.8 kcal/mol to −8 kcal/mol. The excellent prediction of LD50 obtained by the clusters built on the basis of docking study (leaders being those molecules with the highest affinity to 3Q3B protein) enabled us to suggest the toxicity of anthraquinones is given (with high probability) by the interaction of these molecules with 3Q3B protein.
Acknowledgements
The authors acknowledge to the referees for the valuable suggestions.
Declaration of interest
This paper is a result of a doctoral research made possible by the financial support of the Sectoral Operational Programme for Human Resources Development 2007–2013, co-financed by the European Social Fund, under the project POSDRU/159/1.5/S/137750 – “Doctoral and postdoctoral programs – support for increasing research competitiveness in the field of exact Sciences”.
References
- Thomson RH. Naturally occurring quinones IV. London: Springer; 1996
- Blum MS, Hilker M. Chemical protection of insect eggs. In: Hilker M, Meiners T, eds. Chemoecology of insect eggs and egg deposition. Berlin, Oxford: Blackwell Publishing; 2002:61–90
- Matasyoh JC, Dittrich B, Schueffler A, Laatsch H. Larvicidal activity of metabolites from the endophytic Podospora sp. against the malaria vector Anopheles gambiae. Parasitol Res 2011;108:561–6
- Izhaki I. Emodin: a secondary metabolite with multiple ecological functions in higher plants. New Phytol 2002;155:205–17
- Dragos D, Heghes A, Medeleanu M, Vlaia V, et al. Topological similarity/dissimilarity indicators: application to cytochrome P450 inhibition by alcohols. TMJ 2004;54:128–34
- Ho DC, Kwang SL, Tae BK, No KT. Quantitative structure-activity relationship (QSAR) study of new fluorovinyloxyacetamides. Bull Korean Chem Soc 2001;22:4
- Meylan WM, Howard PH. Estimating log P with atom/fragments and water solubility with log P. Perspect Drug Discov 2000;19:67–84
- Lyman WJ, Reehl WF, Rosenblatt DH. Handbook of chemical property estimation methods: environmental behaviour of organic compounds. Washington, DC: American Chemical Society; 1990
- Balaban AT, Chiriac A, Motoc I, Simon Z. Steric fit in QSAR, lectures notes in chemistry. Berlin: Springer; 1980
- Duda-Seiman C, Duda-Seiman D, Dragos D, et al. Design of anti HIV ligands by means of Minimal Topological Difference (MTD) method. Int J Mol Sci 2006;7:537–55
- The RCBS Protein data bank. Available from: http://www.rcsb.org/pdb
- Trott O, Olson AJ. AutoDock Vina: improving the speed and accuracy of docking with a new scoring function, efficient optimization, and multithreading. J Comput Chem 2010;31:455–61
- Jubie S, Kalirajan R, Pavankumar Y. Design, synthesis and docking studies of a novel ciprofloxacin analogue as an antimicrobial AGENT. E-J Chem 2012;9:980–7
- Sanner MF. Python: a programming language for software integration and development. J Mol Graph Model 1999;17:57–61
- Dhananjayan K, Kalathil K, Sumathy A, Sivanandy P. A computational study on binding affinity of Bio-flavonoids on the crystal structure of 3-hydroxy-3-methyl-glutaryl-CoA reductase – an insilico molecular docking approach. Der Pharma Chemica 2014;6:378–87
- Nagy Cs.L, Diudea MV. Nano Studio software package. Cluj: Babes-Bolyai University; 2009
- Frisch MJ, Trucks GW, Schlegel HB, et al. Gaussian 09, Revision A.1. Wallingford (CT): Gaussian Inc; 2009
- Wiener H. Structural determination of the paraffin boiling points. J Am Chem Soc 1947;69:17−20
- Ursu O, Diudea MV. TOPOCLUJ software program. Cluj: Babes-Bolyai University; 2005
- Hawkins DM, Basak SC, Mills D. Assessing model fit by cross-validation. J Chem Inf Comp Sci 2003;43:579–86
- Bolboacă SD, Jäntschi L, Diudea MV. Molecular design and QSARs with molecular descriptors family. Curr Comput Aided Drug Des 2013;9:195–205
- Jäntschi L. LOO Analysis (LOO: leave one out), Academic Direct Library of software; 2005. Available from: http://l.academicdirect.org/Chemistry/SARs/MDF_SARs/loo/
- Harsa TE, Harsa AM, Szefler B. QSAR of caffeines by similarity cluster prediction. Cent Eur J Chem 2014;12:365–76
- Harsa AM, Harsa TE, Bolboaca S, Diudea MV. QSAR in flavonoids by similarity cluster prediction. Curr Comput Aided Drug Des 2014;10:115–28