
Abstract
Various electronic nicotine delivery systems (ENDS), of which electronic cigarettes (e-cigs) are the most recognized prototype, have been quickly gaining ground on conventional cigarettes because they are perceived as less harmful. Research assessing the potential effects of ENDS exposure in humans is currently limited and inconclusive. New products are emerging with numerous variations in designs and performance parameters within and across brands. Acknowledging these challenges, we present here a proposed framework for an in vitro systems toxicology assessment of e-liquids and their aerosols, intended to complement the battery of assays for standard toxicity assessments. The proposed framework utilizes high-throughput toxicity assessments of e-liquids and their aerosols, in which the device-to-device variability is minimized, and a systems-level investigation of the cellular mechanisms of toxicity is an integral part. An analytical chemistry investigation is also included as a part of the framework to provide accurate and reliable chemistry data solidifying the toxicological assessment. In its simplest form, the framework comprises of three main layers: (1) high-throughput toxicity screening of e-liquids using primary human cell culture systems; (2) toxicity-related mechanistic assessment of selected e-liquids, and (3) toxicity-related mechanistic assessment of their aerosols using organotypic air–liquid interface airway culture systems. A systems toxicology assessment approach is leveraged to enable in-depth analyses of the toxicity-related cellular mechanisms of e-liquids and their aerosols. We present example use cases to demonstrate the suitability of the framework for a robust in vitro assessment of e-liquids and their aerosols.
Introduction
Smoking cessation remains the most effective approach to minimizing the risk of smoking-related diseases. However, only a small percentage of individuals manage to achieve long-term abstinence without support (Hughes et al., Citation2004). Although nicotine replacement therapies (NRTs) (e.g. patches, gums, and nasal sprays) are often used as smoking cessation aids, they cannot address the sensory and behavioral aspects of the smoking ritual, thus limiting their efficacy (McRobbie et al., Citation2014). Therefore, there is a space for tobacco harm reduction approaches, including the development and use of less risky products than cigarettes. Such nicotine-containing products should be designed to deliver nicotine while significantly reducing or eliminating the toxicants/carcinogens present in cigarette smoke (CS). In the UK alone, it has been proposed that switching 1% of smokers annually from smoking to less harmful nicotine sources could potentially save approximately 60,000 lives in a decade (Fagerström & Bridgman, Citation2014). In this regard, electronic nicotine delivery systems (ENDS) provide an alternative strategy to reduce the risk of smoking-related diseases. The toxicity associated with ENDS is considerably less than cigarettes. As compared with cigarette smokers, ENDS users have a substantially lower exposure to the toxicants and carcinogens present in CS (Polosa et al., Citation2016).
Electronic cigarettes (e-cigs) – the most common type of ENDS – are presented as alternatives to cigarettes (Farsalinos & Le Houezec, Citation2015; Farsalinos & Polosa, Citation2014; Farsalinos et al., Citation2013; McRobbie et al., Citation2014). They comprise a wide variety of electronically powered devices used to heat a solution – often referred to as an e-liquid or e-juice – typically composed of varying flavors, with or without nicotine, diluted in a propylene glycol- and/or vegetable glycerol-based solution (Brown & Cheng, Citation2014). The aerosol, which is generated by heating the e-liquid, is inhaled by the user in a process commonly referred to as “vaping” (Brandon et al., Citation2015). Although ENDS have only been on the market for about a decade, they have rapidly evolved. The first-generation ENDS are disposable or rechargeable. The second-generation products contain tank systems with larger batteries, thus permitting their prolonged use (Brandon et al., Citation2015). Finally, the newer, third-generation devices consist of large-capacity batteries and integrated circuits allowing users to control the power applied to the atomizer; thus, the amount of nicotine delivered in each puff is adjustable (Farsalinos & Polosa, Citation2014).
Controversy and ongoing debate exist around the long-term health effects of e-cigs in humans (Callahan-Lyon, Citation2014), and around their value as less harmful nicotine sources (in the context of tobacco harm reduction) (Orr, Citation2014). The uncertainty around this subject is partly attributed to the absence of clear regulatory requirements for an appropriate scientific assessment of ENDS (Orr, Citation2014). Despite the absence of a standard toxicity assessment of ENDS, literature reports on the health effects of ENDS are increasing. Some studies reported that the toxicity effects of e-liquids were significantly fewer than those of CS extract (Farsalinos et al., Citation2013; Misra et al., Citation2014; Romagna et al., Citation2013), whereas others concluded that the effects were measurable, and thus may still pose adverse health consequences (Lerner et al., Citation2015; Scheffler et al., Citation2015; Shivalingappa et al., Citation2015; Wu et al., Citation2014). Therefore, a coherent approach to assessing the health impact of ENDS and to substantiating their potential for reducing the risk associated with smoking is needed. The U.S. Institute of Medicine has stated that a combination of appropriate in vitro toxicity testing and clinical studies in comparison with a “benchmark product” should be explored (IOM, Citation2001).
However, the toxicological assessment of ENDS and e-liquids faces many challenges. First, the rapid evolution of e-cig devices limits the adequacy of the current toxicity studies; performing assessment studies takes time and thus they are chasing a moving target. Second, the lack of manufacturing standards for e-liquids increases the variability in the composition of a particular mixture (Davis et al., Citation2015; Kim et al., Citation2015). Third, the toxicity contributed by the flavor components is unknown (Tierney et al., Citation2015). Fourth, the humectants – propylene glycol and/or glycerol – may not be safe for inhalation at the concentrations inhaled by e-cig users, although they are typically used for pharmacological applications (Vardavas & Agaku, Citation2015). Moreover, they may be thermally decomposed during aerosolization within the atomizer of e-cig devices, resulting in the formation of toxic by-products (e.g. formaldehyde, acetaldehyde, and acrolein) (Vardavas & Agaku, Citation2015). Finally, the large variability of e-cig products hinders the development of a standard toxicity protocol that would be applicable for most e-cigs.
Aligned with the principles of the Three Rs (Balls, Citation2010) and the 21st Century Toxicology framework, in which animal use should be minimized and mechanistic data should be acquired using relevant in vitro test systems (Berg et al., Citation2011; Rovida et al., Citation2015; Sheldon & Cohen Hubal, Citation2009), in vitro toxicity assessments should be designed to be sensitive enough to detect toxicity effects/mechanisms that reflect potential effects in vivo in humans. In addition, such assessment should be able to derive the potential toxicity of the humectants (propylene glycol and glycerol) and of the flavor ingredients. Here we present a multi-layered approach of in vitro testing of ENDS that may provide the basis for a coherent assessment framework in the context of tobacco harm reduction, and aimed to complement the standard pre-clinical in vitro toxicity assessment.
Assessment approaches
Standard in vitro toxicity assessment: a battery of classical assays
Standard toxicity assessment for e-cigs and e-liquids may follow the standard approach taken for tobacco products, the assessment of which depends on a battery of assays. A battery of assays is needed because no single assay can detect all possible toxicity effects of a given compound (Wan et al., Citation2009). For tobacco products in general, the Cooperation Center for Scientific Research Relative to Tobacco (CORESTA) In Vitro Toxicology Task Force provided in 2002 a recommendation for “a battery of assays” to be used (CORESTA, Citation2004). The recommended battery of assays for the assessment of mutagenicity and genotoxicity includes the Ames assay; mouse lymphoma thymidine kinase assay (MLA); micronucleus (MN) or chromosomal aberrations (CA) assays; and the neural red uptake (NRU) assay for the assessment of cytotoxicity (CORESTA, Citation2004). Moreover, these genotoxicity assays are compliant with the Organization for Economic Co-operation and Development (OECD) and the U.S. Food and Drug Administration (FDA) Guidance for Industry of Pharmaceuticals (FDA, Citation2012). Although a battery of assays can provide complementary data, it is challenging to determine which assays bring the most relevant and useful information (Wan et al., Citation2009). The interpretation of the data obtained from the battery of assays should also be done with caution; for example, to indicate whether a compound is genotoxic when the result from one particular assay within the battery is positive, or when the results from several assays are positive (Wan et al., Citation2009).
The assessment of aerosols can be done by collecting the aerosols using various methods (Wan et al., Citation2009). Although commonly applied for studying CS, a similar approach may be done for e-cig aerosols. Total particulate matter (TPM) can be collected using a Cambridge glass filter pad – by which aerosols are drawn through the glass-fiber filter pad by the smoking machine pump controlling the puffs. TPM often is eluted in dimethyl sulfoxide (DMSO), and stored immediately after preparation at −75 °C (Roemer et al., Citation2002). Prior to use such methods, trapping and elution efficiency need to be addressed. Moreover, the gas-vapor phase (GVP) can be collected by drawing the aerosol after passing through the Cambridge filter in phosphate-buffered saline (PBS), culture media, or acetone, which also includes other aerosol droplets that were not trapped by the filter. Furthermore, aerosol fractions may also be collected as a condensate, typically in a cold trap; aerosol condensate will collect some semi-volatiles but will not contain volatile compounds (Wan et al., Citation2009). It should be acknowledged that TPM and condensate do not encompass all the constituents of whole aerosols because some gases and vapors pass through these collection systems (Wan et al., Citation2009). Cold-trapped condensate has an advantage over filter pad TPM in that both the vapor and particulate phases are collected (Wan et al., Citation2009). An aqueous extract of aerosols may be generated by trapping the aerosols directly (unfiltered) in PBS or culture media (Muller & Gebel, Citation1994; Poussin et al., Citation2015). Although these aerosol fractionations/trapping methods have been proven useful for the assessment of CS fractions, the applicability of such methods for ENDS or e-liquids testing needs to be further evaluated.
One additional challenge in assessing ENDS aerosols or e-liquids using standard in vitro cytotoxicity and mutagenicity assays is the osmolality of the e-liquids or their TPM fraction (because of the high concentration of propylene glycol and glycerol in the e-liquids, their TPM will contain a considerably high concentration of these propylene glycol and glycerol). The osmolarity of the e-liquids often exceeds the normal physiological range (290–310 mOsm/L). For example, a mixture containing 50% PG has a molarity of 6.57 M. Because the number of moles equals to that of osmoles for nonionic compounds, 50% PG has an osmolarity of 6.57 Osm/L would have a 21-fold higher osmolarity than that of the normal physiological range (6570/310 mOsm/L = 21). Thus, a dilution of at least 20 times should be used to avoid confounding effects of the osmolality-driven cytotoxicity and/or genotoxicity; such an approach is aligned with the guidance for in vitro genotoxicity testing (HHS et al., Citation2012).
Systems toxicology assessment: a proposed in vitro assessment framework
Given the rapid increase in the development and use of e-cigs, rapid assessment procedures are required to ensure the knowledge on toxicity is relevant for the most recent technologies (Crotty Alexander et al., Citation2015). Recent advances in high-throughput assays and omics technologies have provided the capability to not only yield substantial data, but also detect cellular and molecular changes at the systems level. Thereby, they broaden the scope from selected exposure-specific toxicity endpoints to an overall assessment of the pathophysiological response. Altogether, a systems toxicology assessment approach will increase the ability to extrapolate in vitro (cell culture) toxicity data to in vivo (human) effects.
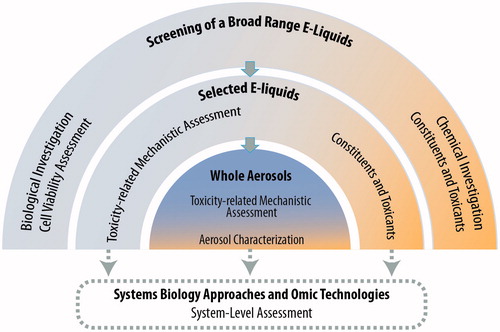
Here we present a multi-layered framework for the assessment of e-liquids to complement the battery of classical assays discussed above. Aligned with the systems toxicology-based approach of exposure described before (Sturla et al., Citation2014), we describe a step-wise systems toxicological assessment of e-liquids and their aerosols (). The framework comprises three main assessment layers: (1) high-throughput toxicity screening of a broad range of e-liquids using primary cell culture systems; (2) toxicity-related mechanistic assessment of a subset of selected e-liquids, and (3) toxicity-related mechanistic assessment of a further selection of the aerosols. A computational systems toxicology-based approach is included as an integral part of the framework to enable in-depth analyses of the toxicity-related cellular mechanisms of e-liquids and their aerosols. Moreover, a complementary analytical chemistry investigation is incorporated to provide relevant chemistry data solidifying the toxicological assessment.
Figure 1. Proposed framework of an in vitro systems toxicological assessment of e-liquids. The framework assessment covers three layers of assessments, integrated into a systems toxicology-based approach. The framework is aimed at enabling a systems-level analysis of the cellular mechanistic toxicity of both e-liquids and their aerosols using relevant biological in vitro test systems. An analytical chemistry investigation is used complementarily to provide accurate and reliable chemistry data solidifying the toxicological assessment.
The first-layer assessment
The first layer of the framework aims to efficiently screen the general toxicity (cell viability) of thousands of e-liquids, independent of the e-cig design characteristics, using relevant in vitro cell cultures as the test systems (i.e. primary cell cultures) – this is different from the standard battery of assays often done using non-human cell lines, such as mouse lymphoma, Chinese hamster lung, or Salmonella typhimurium bacteria. For the proposed toxicological assessment of e-liquids, the airway cell culture is an appropriate test system. They are relevant because respiratory epithelial cells constitute the first biological barrier against airborne toxicants. For a relatively inexpensive rapid screening, two-dimensional (2D) airway cell culture systems (i.e. monolayers of uniform epithelial cells with incomplete differentiation) are appropriate. They are easier to handle, less expensive, and more suitable for large-scale studies than three-dimensional (3D) airway cell culture systems. 3D cells are capable of differentiating into a pseudostratified airway epithelium comprising basal, ciliated, and mucus-producing cells. Primary bronchial epithelial cells have been shown to be useful and relevant 2D cultures for airway pathophysiology toxicity screening (Albino et al., Citation2004; Catallo et al., Citation2001; Gonzalez-Suarez et al., Citation2014, Citation2016; Kogel et al., Citation2015; Tan et al., Citation2012). Additionally, potential effects of e-liquids on cardiovascular disease risk can be assessed using 2D primary vascular endothelial cells.
The first-layer assessment relies on high-throughput and high-content screening strategies, which have been used in modern drug discovery in the biopharma sector. These strategies are now part of the molecular screening initiatives of the United States (U.S.) National Institutes of Health (NIH) Roadmap (Varma et al., Citation2011). The use of high-throughput and high-content screenings has an ultimate goal of rapidly and cost-effectively profiling thousands of compounds. Multiparametric indicators of general toxicity can benefit from real-time cellular analysis (RTCA) and high-content screening (HCS) assays. Recent technologies, such as xCELLigence™ (ACEA Biosciences Ltd., San Diego, CA), enable measurement of cell viability in real time, allowing a simultaneous monitoring of the time-dependent exposure response.
An analytical chemistry investigation within the first layer will provide insights supporting the validity of the biological investigation. This approach is similar to what is implemented for the classical battery of assays required by regulatory authorities. Many analytical techniques are available for the detection of constituents and toxicants in e-liquids and cartridges, such as high-performance liquid chromatography with diode-array detection (HPLC/DAD), liquid chromatography-tandem mass spectrometry (LC-MS/MS), and gas chromatography-mass spectrometry (GC-MS) (Famele et al., Citation2015). Pharmacopeia procedures and methods – protocols available from various regulatory authorities, such as International Organization for Standardization, the U.S. Environmental Protection Agency, and the American Public Health Association – can be useful to characterize the chemical components and identify the presence of toxicants. These toxicants potentially exist as impurities or as byproducts of compound degradation before the aerosolization process (Famele et al., Citation2015).
The second-layer assessment
The second layer of the framework aims to identify the toxicity-related mechanisms, beyond the impact on cell viability following e-liquid exposure, such as the specific cell death-related mechanisms involved and a multitude of pathophysiological mechanisms associated with e-liquids exposure. The information obtained from the first-layer assessment can be leveraged to determine selected e-liquids that should be tested further (i.e. those associated with considerable reductions of cell viability).
Because of the multifaceted properties of HCS assays, the second layer of the assessment can also benefit from HCS platforms. HCS will enable the detection of various properties simultaneously, such as protein phosphorylation, ligand binding to cell surface receptors, molecular uptake and transport, protein expression, cell cycle regulation, activation of enzymes, and cell proliferation (Buchser et al., Citation2004; Gonzalez-Suarez et al., Citation2014; Kogel et al., Citation2015). This HCS capability will enable a parallel assessment of the molecular and phenotypical alterations (Haney et al., Citation2015). Such a platform has been useful for assessing the cellular and molecular changes associated with CS and a potential reduced risk tobacco product aerosol (Gonzalez-Suarez et al., Citation2016).
The HCS approach is more often applied to studies using 2D cell culture systems, although it is increasingly explored for 3D cultures (Chen et al., Citation2014; Sirenko et al., Citation2015). 3D culture systems will present some limitations for imaging-based HCS: they limit the scalability of the study because they are relatively more costly and can be difficult to culture and maintain. In addition, their 3D structure limits the imaging capability, thus affecting the sensitivity of the measurement. Therefore, primary 2D culture systems (discussed above) will be appropriate as a test system for the second-layer assessment.
The third-layer assessment
The third layer of the framework aims to evaluate the toxicity-related mechanisms of the aerosols generated from selected e-liquids. For assessing whole aerosols, 3D airway cell culture systems are appropriate and superior to the 2D culture systems. 3D airway cell culture systems are cultured at the air-liquid interface (Constant et al., Citation2014), allowing an aerosol exposure at the cultures’ apical side, thereby mimicking the actual “vaping” situation. The models exhibit characteristics of a pseudostratified epithelium and contain goblet cells secreting mucus, columnar ciliated cells, and basal cells, similar to the in vivo epithelial tissues (Constant et al., Citation2014; Iskandar et al., Citation2015; Mathis et al., Citation2013; Talikka et al., Citation2014); this provides a more physiologically relevant test system. Human 3D airway epithelial models are commercially available and ready to use (e.g. the EpiAirway™ models of MatTek Corporation, Ashland, MA or the MucilAir™ model of Epithelix Sàrl, Geneva, Switzerland).
3D airway cell culture systems will allow an evaluation of the complex spatial morphology of the airway epithelium. Histological analyses can be done by obtaining standard hematoxylin and eosin (H&E) and alcian blue staining from the tissue sections. Moreover, the proportions of various cell types can be analyzed using immunohistochemistry assays (Talikka et al., Citation2014). In the case of 3D bronchial or nasal cultures – which contain functional ciliated cells – measurement of cilia beating frequency (Iskandar et al., Citation2015) and assessment of mucociliary clearance can be done (Seagrave et al., Citation2012). Smoking has been recognized to impair cilia beating frequency and coordination, as well as mucociliary clearance (Leopold et al., Citation2009). Furthermore, cytotoxicity-related endpoints in 3D culture systems can be measured using well-known standard cellular assays, such as the lactate dehydrogenase (LDH) and adenylate kinase (AK) assays (Iskandar et al., Citation2015; Talikka et al., Citation2014). Additional endpoints can be derived by measuring the concentrations of various pro-inflammatory mediators (e.g. cytokines, chemokines, and growth factors) that are secreted into the basolateral media of the culture systems following exposure (Iskandar et al., Citation2015; Mathis et al., Citation2013; Talikka et al., Citation2014). Profiling these mediators may identify the toxicity-related mechanisms associated with the exposure. Airway epithelial cells respond to stimuli by generating various mediators despite having been classically considered a physical barrier between the environment and the host organism (Proud & Leigh, Citation2011). In addition, the induction of xenobiotic-metabolizing enzymes such as cytochrome P450 (CYP) 1A1 and CYP1B1 following exposure to polycyclic aromatic hydrocarbons (PAHs) and nitrosamines (found in CS), can be measured easily by adding luminescence-labeled substrates to the culture medium (Iskandar et al., Citation2015).
The approach within the third-layer assessment is aimed at minimizing the effects of device-to-device variability; therefore, specific aerosol generation devices can be used. Various aerosol generation devices are commercially available (illustrated in and listed in ). The characteristics of the generated aerosol, i.e. particle size distribution and composition, vary depending on the device, its geometry, and its operating conditions. These differences in aerosol characteristics may result in different deposition of the aerosol in the test systems, thus leading to different toxicity profiles. Therefore, a characterization of the aerosol should be done as part of the assessment. Reports on the chemical characterization of e-cig aerosols are increasing. Most studies aim to identify not only known toxicants commonly present in CS (e.g. tobacco-specific nitrosamines and nicotine-related chemicals) but also carbonyls, volatile organic compounds, metals, and minerals (e.g. silicate) (Flora et al., Citation2016). A recent study investigated the impact of the battery output voltage on the generation of potentially harmful chemicals in the aerosols, including carbonyls (Kosmider et al., Citation2014). In addition to the chemical characterization, the droplet size distribution and the GVP and particulate phase ratios should be assessed.
Figure 2. Commercially available aerosol generation devices. Aerosols from various e-liquids can be generated using many commercially available devices: A Condensation Monodisperse Aerosol Generator; B, Collison nebulizer; C, Vitrocell spiking system; D, Smoking machines, where e-cig devices can be “vaped”.
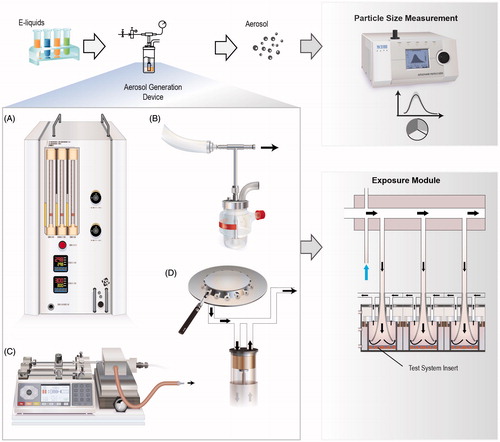
Table 1. Aerosol generation and particle measurement devices suitable for e-liquids assessment.
Systems biology and omics technologies
Under the scope of the second and third layers of the assessment, the HCS-based analyses of toxicity-related mechanisms can be complemented with a systems biology approach using omics technologies. The system-level data obtained using omics technologies will improve the robustness of the toxicity assessment; an investigation of molecular changes at the system-level would lead to a more accurate prediction of toxicity of e-liquids and their aerosols with unknown toxic mechanisms. A series of omics-based assays can potentially be leveraged to increase the robustness of the toxicity data, including genome-wide assessments of mRNA expression (transcriptomics), microRNA (miRNA), protein expression (proteomics), epigenetic changes (epigenomics), and small metabolites (metabolomics/lipidomics). Over the past two decades, technical capabilities to generate large amounts of omics data have advanced tremendously. With the advancement of computational methods and mechanistic representation of biology (i.e. causal biological network models), the community is advancing in evaluating, quantifying and visualizing the exposure induced perturbations measured through the multi-modality of omics technologies and molecular measurements (Hoeng et al., Citation2014; Martin et al., Citation2014).
In this work, we present example applications of the framework where a network-based systems biology approach was leveraged to interpret transcriptomic data for assessing the impact of e-liquids and their aerosols. The network perturbation amplitude (NPA) approach is a methodology for quantifying exposure-induced perturbations based on transcriptomics measurements (Martin et al., Citation2012, Citation2014; Thomson et al., Citation2013). The NPA methodology has been useful for evaluating the biological impact of CS and for conducting comparative assessments: the impact of potential reduced risk tobacco products and CS (Gonzalez-Suarez et al., Citation2014, Citation2016; Iskandar et al., Citation2015; Kogel et al., Citation2015; Schlage et al., Citation2014). The NPA approach uses prior biological knowledge organized in a collection of causal network models that have been made available on the Causal Biological Network database (Boué et al., Citation2015). Other tools for the biological interpretation of transcriptomic data are available, including (but not limited to) the Molecular Signatures Database/Gene Set Enrichment Analysis (MSigDB/GSEA) (Subramanian et al., Citation2005), ConsensusPathDB (http://cpdb.molgen.mpg.de/), and Ingenuity Pathway Analysis (http://www.ingenuity.com/products/ipa). Observations and findings obtained from the systems biology assessment approach can be used for hypothesis generation, leading to follow-up experiments.
Perspectives
Variability of e-cig devices and user puffing topography
E-cig devices vary considerably in their heating elements. Moreover, the operating power of some devices can be modified by the users (Talih et al., Citation2015). The electrical power input, which is directly correlated with the square of the voltage and inversely correlated with the heater resistance, affects the temperature at which the aerosol is produced (Talih et al., Citation2015). These factors influence the delivery of nicotine and generation of toxic byproducts (e.g. carbonyls, aldehydes) (Costigan & Meredith, Citation2015; Talih et al., Citation2015). Recent attention has been brought to the phenomenon of “dry puff” – the overheating of the heating coil when the e-liquid level is low, which is strongly influenced by the device characteristics – associated with the generation of harmful toxicants (Farsalinos et al., Citation2015). This factor further adds to the challenges of assessing the toxicity of e-cigs. Although the present framework presented here aimed at minimizing the variability due to e-cig devices used in the assessment, future studies can be done by leveraging the framework to investigate the toxicity effects of the device-specific characteristics.
In addition, puffing topography (the puff volume, puff velocity, and inter-puff interval) affects the emission of the aerosol, thus potentially influencing their toxicity (Talih et al., Citation2015). The puff topography of e-cigs varies greatly among users; experienced e-cig users appear to take a longer puff (an average of 4 s) compared with tobacco smoking (2 s) (Behar et al., Citation2015; Talih et al., Citation2015). Data on e-cig topography could provide insight not only into the puffing behavior, but also into the intake of nicotine and other compounds (Behar et al., Citation2015). Although the topography of cigarette smoking is well documented, little is known about the puff topography of “vapers” (Behar et al., Citation2015).
An extension of the third-layer assessment should be tested in future work to address the effects of the heating power (temperature) and vaping topography profiles on aerosol toxicity (), for example, assessing temperature-dependent response in a biological test system in parallel with aerosol characterization. Alternatively, the actual e-cig devices can be mounted on to a smoking machine with a programmable dual syringe pump (PDSP) (presented as the example use case for the extension of the third-layer assessment), where various “vaping” topographies can be simulated.
Figure 3. Three layers of the in vitro systems toxicology assessment framework of e-liquids. The framework is aimed at complementing the battery of classical assays for toxicity assessment of tobacco products. Extensions of the framework can be made to address specific scientific questions, such as an evaluation of the effects of heating power or puff topography for specific e-cig devices, or to specifically assess the effect of flavor compounds and identify the acceptable compounds by incorporating a “flavor toolbox” of assessment. Dosimetry can be further used to support the necessary context for estimating the human exposure dose.
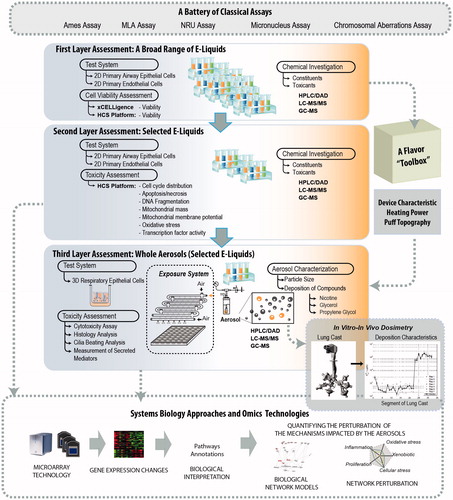
Flavor ingredients
E-cig manufacturers have relied on flavor ingredients with generally recognized as safe (GRAS) status. The GRAS status is conferred by an exemption in the U.S. Food, Drug and Cosmetic Act that is designated for these types of ingredients added to food, and do not currently require premarket approval by the U.S. FDA. Thus, the GRAS status is not relevant for inhaled flavors (e.g. in ENDS) (Tierney et al., Citation2015). Despite their GRAS status, the toxicity associated with the inhalation of these flavor ingredients is unknown (Tierney et al., Citation2015). To date, only a few compounds have been evaluated in the context of inhalation toxicology. Some of the flavor ingredients have actually been shown to be toxic to the respiratory system; for example, diacetyl – which is commonly added to popcorn and margarine to impart the buttery flavor – was found to cause airway damage (i.e. obliterative bronchiolitis) in rats (Hubbs et al., Citation2002) and humans (Kikawa et al., Citation1991) after a prolonged inhalation. The artificial flavoring acetylpropionyl was linked to lung epithelial damage following a 6-h exposure inhalation in rats (Hubbs et al., Citation2012). These studies indicate that the potential toxicity of flavor ingredients should be carefully evaluated; e.g. of each flavor as compared with its base solution (each flavor in comparison with the unflavored e-liquid). An extension of the framework could be made, in which a “flavor toolbox” could be dedicated to specifically assess the effect of flavor ingredients and identify the acceptable ones (). The strategies for toxicity assessment of flavor ingredients in particular are not discussed in the present work; nevertheless, such strategies may leverage the first layer of the framework, coupled with a toxicity assessment of the aerosols of interest. This should be explored in future studies.
Uncertainty of in vitro toxicity assessment: dosimetry
Inhalation remains the primary exposure route for e-cig aerosols, during which they travel through different regions of the respiratory tract. The deposition of aerosol compounds in the human airways is largely influenced by the flow of the aerosols and their particle size. In contrast, an in vitro assessment of aerosol impact is frequently done using a relevant biological test systems subjected to a direct exposure (Comouth et al., Citation2013; Paur et al., Citation2011; Tippe et al., Citation2002). Such an exposure setup relies on an artificial exposure system, for example, the Borgwaldt exposure systems (Borgwaldt KC, Hamburg, Germany), Vitrocell systems (Vitrocell® Systems, Waldkirch, Germany), and Cultex® exposure module (Cultex® Laboratories GmbH, Hannover, Germany) (Thorne & Adamson, Citation2013). In these systems, the biological test systems are placed within a climatic chamber during the exposure. In these chambers, the geometry of the systems and the flow conditions are different from the human airways.
Aligned with the Three Rs strategies (Balls, Citation2010), an in vitro assessment framework should aim at obtaining a considerable level of accuracy in predicting the likelihood of adverse effects that may occur in humans from similar exposure conditions. Therefore, a dosimetry evaluation should be incorporated as a part of the assessment framework. Dosimetry assessment will provide the necessary context for estimating the human exposure doses. Initial efforts have augmented our understanding of aerosol deposition in the human lung, such as an evaluation of particle deposition as a function of the airway generation (Manigrasso et al., Citation2015), and a determination and quantification of the deposition of aerosol particles (of a monodisperse glycerol and multicomponent e-cig aerosols) in the human upper airway using an in vitro lung cast model (Nordlund et al., Citation2015). Nevertheless, in vitro–in vivo dosimetry remains a challenging task. Although an extrapolation of in vivo doses per unit of alveolar surface area seems to be reasonable, such extrapolation should carefully consider the temporal effect of the exposure on the compound depositions in vivo (Oberdörster, Citation2012). Integrating dosimetry into the current toxicity assessment framework could support a better prediction of in vivo toxicity.
Toxicity assessment: regulatory context
Currently, regulatory authorities do not provide any regulation on the manufacturing side to ensure the quality and integrity of the e-liquids (batch-to-batch consistency). Therefore, consistency between the ingredients reported on the label and those actually present in the e-liquid remains in some cases an issue. Demands have been made to increase the transparency in reporting the ingredients present in e-liquids and to standardize the manufacturing of these products (Farsalinos et al., Citation2015; Zhu et al., Citation2014). In this regard, the evaluation of the toxic effects of fresh e-liquid versus aging e-liquid should be explored. Proposed legislation would give the FDA jurisdiction in the U.S. to regulate the manufacture and sale of e-cigs (Harrell et al., Citation2014). A few recommendations for key policy changes, including allowing the FDA to implement its authority to regulate not only “all ENDS that meet the statutory definition of tobacco products”, but also their components, have been made by the American Association for Cancer Research (AACR) and the American Society of Clinical Oncology (ASCO) (Harrell et al., Citation2014). In such context, an extension of our proposed framework could be done to address these issues by bridging of the first and third layer, whereby the stability of the aerosols is subjected to chemical analysis. The chemical analysis can derive the relationship between the chemical content of the e-liquids and the chemical constituents in the aerosols.
For cigarette smoking, standard puffing regimens and smoking protocols are available from various entities, such as the U.S. Federal Trade Commission (FTC), the International Organization for Standardization (ISO), the Cooperation Center for Scientific Research relative to Tobacco (CORESTA), the Massachusetts Department of Public Health (MDPH), and Health Canada (HC) (Wan et al., Citation2009). The World Health Study Group on Tobacco Product Regulation recommends using both ISO and HC machine-smoking methods to cover the scenarios that are expected to generate a broad range of toxicants (WHO, Citation2004). Similar initiatives on the standard puffing and smoking protocols should be developed for e-cigs for a more consistent testing across laboratories and studies. Recently, only CORESTA E-Cigarette Task Force has proposed a recommended e-cig vaping protocol (CORESTA, Citation2015a,Citationb). In addition, it was suggested that in the absence of a specific regulation, the characterization of the harmful and potentially harmful constituents (HPHCs) – a list of HPHCs is provided by the U.S. FDA for currently regulated tobacco products – should be applied to e-liquids and their aerosols (Flora et al., Citation2016). Such requirement should be clearly defined by the regulatory authorities.
With the increasing number of toxicity studies on the health effects of e-cigs, a clear consensus should be reached on the use of specific reference aerosols (as a positive control benchmark) to enable relevant comparisons between studies. This aspect would be aligned with the U.S. Institute of Medicine (IOM) science-based regulatory framework, in which appropriate toxicological testing in a pre-clinical laboratory setting to support risk-reduction claims should be compared with a “benchmark product” (IOM, Citation2001). In the following use case example, nebulized smoke-bubbled PBS (sbPBS) was used as the positive control against nebulized test aerosols, and the mainstream smoke from 3R4F reference cigarette was used as a comparison against a representative aerosol from an ENDS prototype. Scheffler and colleagues used mainstream CS as the positive control to evaluate the toxicity of e-cig aerosols (Scheffler et al., Citation2015). Werley and colleagues compared tobacco extract aerosols to those from aerosol generated from nicotine solutions (Werley et al., Citation2014). A careful consideration of appropriate controls (and standardized controls) should be given for the assessment of e-liquids and their aerosols. Nevertheless, it remains difficult to make a fair comparison between aerosols generated from e-cigs and smoke from cigarettes because the puffing regimens are considerably different.
Applications of the three-layer assessment
A use case example of the assessment of test mixtures and their nebulized aerosols
We present here an example where the proposed framework was applied to assess two different mixtures, with compounds frequently used as base solutions of commercially available e-liquids: (1) propylene glycol and glycerol (PG.G) and (2) propylene glycol and glycerol with nicotine (PG.G/Nic). The first two layers of the framework were applied using primary normal human bronchial epithelial (NHBE) cells that were directly incubated with culture media containing various concentrations of the two test mixtures. The third layer of the framework was conducted using a human 3D organotypic bronchial epithelial culture system exposed directly at the apical side to the whole aerosols of the two test mixtures using the Vitrocell exposure system.
Application of the first layer of assessment
Within the first layer, our primary goal was to determine the impact of e-liquids on general cytotoxicity (cell viability) (). We show here an assessment of PG.G and PG.G/Nic mixtures using 2D primary NHBE cells. Both xCELLigence™ and HCS platforms were used to measure the number of living cells after an incubation with media containing various concentrations of e-liquids. The xCELLigence™ system conducts a real-time cell analysis (RTCA) of cultures grown in E-Plates – culture plates lined with gold microelectrodes at their base, allowing a measurement of impedance between the electrical circuits – to indicate the number of viable cells (Ke et al., Citation2011). In addition, we used HCS assays (in this study, HCS refers to microscopy-based assays using Thermo Arrayscan VTI) to measure not only viable cells, but also apoptotic and necrotic cells.
Figure 4. First-layer assessment of cell viability. A, Composition of the test mixtures. B, The endpoint measured within the first layer of assessment. C, Cell index and D, cell count to measure cell viability following incubation with PG.G and PG.G/Nic mixtures in NHBE cells. The area under the curve was plotted (for each technical replicates) following normalization to vehicle control and positive control as 0 and 100% cell index, respectively. Values of the cell index and cell count were plotted and fitted using a four-parameter Hill equation. [†] indicates the EC50 values. Values that are not automatically included in curve fitting computations by the software are shown in gray.
![Figure 4. First-layer assessment of cell viability. A, Composition of the test mixtures. B, The endpoint measured within the first layer of assessment. C, Cell index and D, cell count to measure cell viability following incubation with PG.G and PG.G/Nic mixtures in NHBE cells. The area under the curve was plotted (for each technical replicates) following normalization to vehicle control and positive control as 0 and 100% cell index, respectively. Values of the cell index and cell count were plotted and fitted using a four-parameter Hill equation. [†] indicates the EC50 values. Values that are not automatically included in curve fitting computations by the software are shown in gray.](/cms/asset/8d21eedc-fe67-4340-ad02-7b6b7a8a5ee2/itxm_a_1170251_f0004_c.jpg)
Here we show the viability of NHBE cells following a 24-h incubation with media containing the following concentrations of PG.G or PG.G/Nic (): 0.125, 0.25, 0.50, 1.00, 2.00, and 4.00% (v/v). This experiment aimed to identify the lethal doses of the mixtures that cause a 50% decrease in cell viability (EC50) in NHBE cells. PG.G and PG.G/Nic in this experiment had EC50 values of approximately 1.5 and 2.5% (equivalent to about 0.15 and 0.3 on the logarithmic x-axis, respectively, ). The EC50 value of the PG.G/Nic mixture (2.5 mM) was lower than the nicotine solution alone (5 mM) (Supplementary Figure S1), suggesting that the nicotine solution alone did not contribute to the slight decrease in viability of the cells treated with PG.G/Nic as compared with PG.G.
In addition, such assessment can be done to evaluate the toxicity associated with a flavor ingredient (or flavor-mixture). shows the application of the first-layer assessment where two different flavor-mixtures of unknown toxicity were tested relative to their corresponding base solutions using NHBE cells. The results show that flavor-mixture 1 resulted in left shift of the cell viability curve (), suggesting that the flavor-mixture 1 increased the toxicity of its base solution. On the other hand, flavor-mixture 2 did not result in a shift of the cell viability curve relative to the base solution (). This type of assessment could be used to prioritize certain mixture to be assessed using the subsequent layer of framework assessment.
Figure 5. Leveraging the first-layer assessment to evaluate the impact of flavors on cell viability. A, Composition of the test mixtures. The impact of each flavor-mixture was assessed relative to its corresponding base solutions. B, The endpoint measured within the first layer of assessment. C and D, Cell index measurement to evaluate cell viability following a 24-h incubation with the flavor mixtures 1 and 2, respectively in NHBE cells. The area under the curve was plotted (for each technical replicates, N = 3) following normalization to vehicle control and positive control as 0 and 100% cell index, respectively. Values of the cell index and cell count were plotted and fitted using a four-parameter Hill equation. [†] indicates the EC50 values.
![Figure 5. Leveraging the first-layer assessment to evaluate the impact of flavors on cell viability. A, Composition of the test mixtures. The impact of each flavor-mixture was assessed relative to its corresponding base solutions. B, The endpoint measured within the first layer of assessment. C and D, Cell index measurement to evaluate cell viability following a 24-h incubation with the flavor mixtures 1 and 2, respectively in NHBE cells. The area under the curve was plotted (for each technical replicates, N = 3) following normalization to vehicle control and positive control as 0 and 100% cell index, respectively. Values of the cell index and cell count were plotted and fitted using a four-parameter Hill equation. [†] indicates the EC50 values.](/cms/asset/36794896-a5e4-45b2-bda2-786ba162ec8e/itxm_a_1170251_f0005_c.jpg)
Application of the second layer of assessment
The second layer of the assessment aims to investigate in-depth cellular changes associated with the cytotoxicity of e-liquids in NHBE cells using HCS assays (). The information obtained in the first-layer assessment, in which cytotoxicity was observed in NHBE cells following incubation with the test mixtures at concentrations higher than 2%, can be further delineated using additional HCS assays.
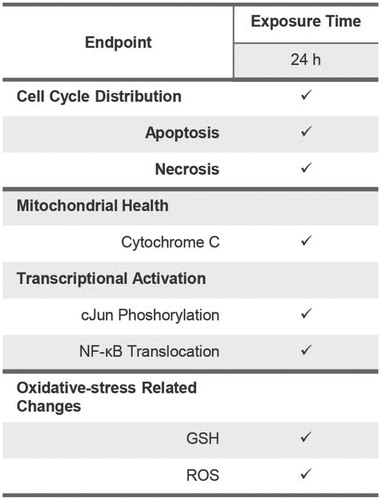
Figure 6. Endpoints measured within the second-layer assessment of cell viability. Abbreviations: GSH: glutathione; ROS: reactive oxygen species.
We first assessed the distribution of cell cycle phases in NHBE cells following incubation with the test mixtures using the HCS platform. The cell cycle is tightly regulated, and the loss of cell cycle control would indicate a perturbation of normal cellular machinery that contributes to eventual cell death (Wan et al., Citation2009). Our results demonstrated a reduced proportion of cells in the S-phase following incubation with the highest concentration of PG.G/Nic (), suggesting that the increase in apoptosis was accompanied by a decrease in cell proliferation. Moreover, HCS analysis was used to measure the proportion of apoptotic and necrotic cells (tested using the HCS platform). The analysis confirmed that apoptosis-dependent cellular death (but not necrosis) occurred in NHBE cells following incubation with 4% of the PG.G/Nic mixture ().
Figure 7. HCS-based analysis of cell cycle distribution. A, Relative proportion of cells for each phase of the cell cycle was then plotted. B, Apoptotic cells were measured based on the active caspase 3/7 positive-stained cells and C, necrotic cells were measured based on TO-PRO-caspase 3-positive stained cells using the HCS platform.
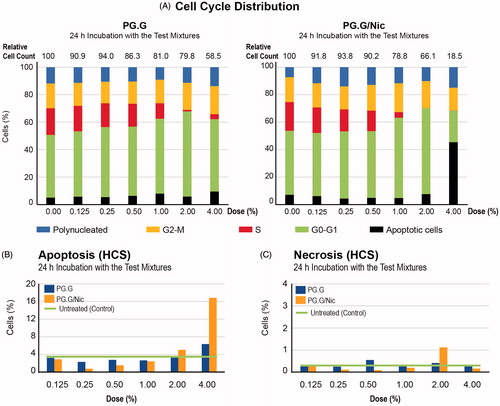
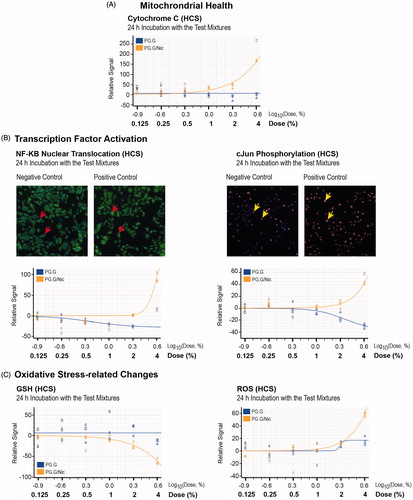
Furthermore, show the effects of the test mixtures on mitochondrial health, transcriptional factor activities, as well as oxidative stress-related changes. These data suggest that the occurrence of apoptosis following incubation with the 4% PG.G/Nic mixture was associated with greater release of cytochrome c, increased levels of phosphorylation of cJun and translocation of nuclear factor (NF)-κB, as well as reduced glutathione (GSH) and elevated reactive oxygen species (ROS) levels.
Figure 8. Toxicity-related mechanisms assessment of liquid mixtures in NHBE cells. A, Mitochondrial health; B, transcription factor activation, C, oxidative stress-related changes were measured in NHBE cells incubated for 24 h with PG.G or PG.G/Nic mixtures using HCS assays. The area under the curve was plotted after normalization against the vehicle control (no detected signal). Values that are not automatically included in curve fitting computations by the software are shown in gray. Abbreviations: GSH: glutathione NF-κB: nuclear factor kappa B; ROS: reactive oxygen species.
Application of the third layer of assessment
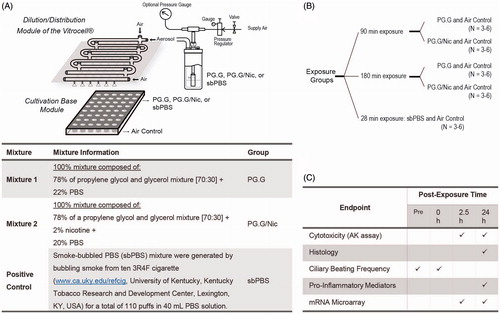
The third layer of the assessment aims to evaluate the biological impact of the whole aerosol generated from a selection of e-liquids on a human 3D bronchial epithelial tissue culture model (a single donor was used in this present work). The aerosols were generated using a nebulizer – the Collison nebulizer – connected to a Vitrocell exposure system (). A continuous flow of the aerosol was generated from the mixture of PG.G or PG.G/Nic and used to expose the 3D cultures for 90 and 180 min (). As a positive control, we exposed the 3D cultures to a nebulized sbPBS for 28 min. The sbPBS was collected by drawing the reference 3R4F cigarette into PBS, a method frequently used to test the effects of aqueous CS extract (Poussin et al., Citation2015).
Figure 9. Experimental design to test the nebulized aerosols generated from the various test mixtures. A, An illustration of the generation of aerosols from the various test items using the Collison nebulizer and of the exposure set-up using the Vitrocell exposure system. The 3D bronchial epithelial cultures (reconstituted from one donor) were exposed to three different aerosols generated by nebulizing PG.G, PG.G/Nic, or sbPBS mixtures. B, The experimental groups. C, Various endpoints measured within the third-layer assessment. Abbreviations: AK: adenylate kinase; Nic: nicotine; PBS: phosphate-buffered saline; PG.G: propylene glycol and glycerol; PG.G/Nic: propylene glycol, glycerol, and nicotine; sbPBS: smoke-bubbled PBS.
The effects of the whole aerosols were first qualitatively assessed by observing the H&E-stained sections of the cultures harvested one day after the exposure experiment. The histological sections of the cultures demonstrated no substantial impact of the test aerosols; a representative image of the H&E-stained culture sections is given in .
Figure 10. Cytotoxicity assessment of the whole aerosols in a 3D bronchial culture model. A, Representative images of the H&E-stained bronchial culture sections. Duration of the exposure was specified on the top of the images. B, Normalized cytotoxicity levels were evaluated by measuring adenylate kinase (AK) activity in the basolateral media after 90- and 180-min exposures. The AK levels (y-axis) were calculated (N = 5–6) relative to the Triton-X-treated cultures (100% as the positive control, N = 6).
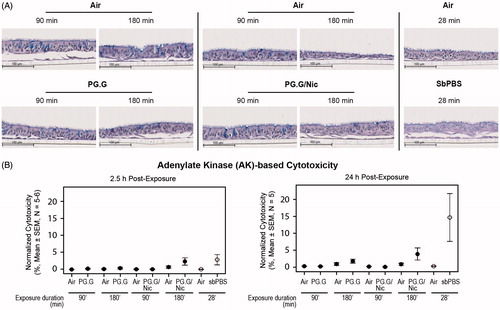
The cytotoxicity associated with the test aerosols was quantitatively assessed by measuring the levels of adenylate kinase (AK) released from the 3D cultures into the basolateral media, at 2.5-h and 24-h post-exposure. We observed negligible alterations in cytotoxicity levels (); in general, cytotoxicity levels were greater following a longer exposure, irrespective of the mixture types. As expected, the positive control (sbPBS aerosol) was linked to the highest cytotoxicity levels.
Another toxicity-related effect of the test aerosols was assessed by measuring the frequency of cilia beating in the 3D cultures. Mucociliary clearance () refers to the clearance of inhaled particles by propelling a mucus gel layer using synchronized cilia movements resulting in a regular beat frequency of the cilia (Tilley et al., Citation2015). Smoking has been shown to impair cilia beating frequency and coordination, as well as mucociliary clearance (Leopold et al., Citation2009). When measured in in vitro models, exposure to CS or CS extract reduced ciliary beating frequency (Tilley et al., Citation2015).
Figure 11. Cilia beating alterations following whole aerosol exposures in a 3D bronchial culture model. A, An illustration of mucociliary clearance and ciliary beating movement. B, Levels of ciliary beating frequency, and C, Ciliary beating power (normalized to the baseline pre-exposure) measured after a 90-min exposure and 180-min exposure to the test aerosols. The 3D bronchial cultures were reconstituted from a single donor as described in the materials and methods.
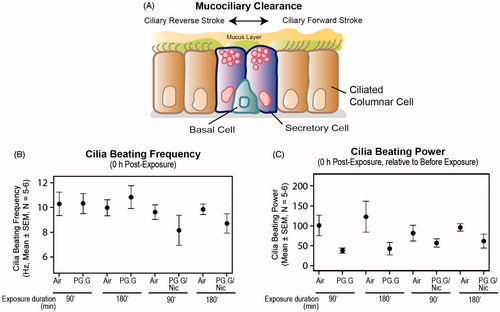
Here we show that immediately after exposure to the test aerosols for 180 min, negligible alterations of the frequency were observed, compared with air-exposed controls (). The cilia beating power (i.e. the Fast Fourier Transformation (FFT) power reflecting the overall cilia beat activity of the culture insert) was altered comparably following exposure to both mixtures, irrespective of the duration of the exposure ().
We also analyzed the profiles of pro-inflammatory mediators (cytokines, chemokines, and growth factors) secreted into the basolateral media of the tissue cultures 24 h post-exposure. Airway inflammation is closely linked to CS exposure; CS affects the immune system and impairs normal inflammatory responses (Stampfli & Anderson, Citation2009). Airway epithelial cells are capable of responding to a variety of stimuli by generating various mediators (Proud & Leigh, Citation2011). In this study, the concentrations of some mediators were measured using a Luminex-based technology. Our data demonstrated increased levels of mediators in a duration-dependent manner following the exposure: The longer the exposure, the greater the increase in mediator levels (). The alterations of the mediator levels upon PG.G or PG.G/Nic aerosols (vs. air control) were minimal as compared with those upon CS (vs. air control) (Supplementary Figure S3).
Figure 12. Profiles of secreted mediators following exposure. Concentrations of various mediators were measured in the basolateral media of the cultures at 24-h post-exposure using a Luminex-based technology. Abbreviations: CSF: colony-stimulating factor; CXCL1: chemokine (C-X-C motif) ligand 1; G-CSF: granulocyte colony-stimulating factor; IL: interleukin; MMP: matrix metalloproteinase TIMP1: tissue inhibitor of metalloproteinase 1.
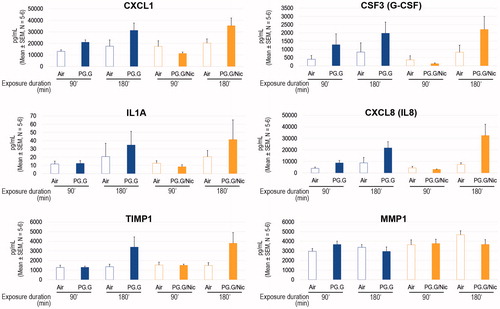
Such a profile can help to identify the possible mechanisms of tissue responses to stressors. For example, our results showed elevated levels of granulocyte colony-stimulating factor (G-CSF), chemokine (C-X-C motif) ligand (CXCL1), and interleukin (IL)-8 following exposure to the test aerosols. These mediators have been shown to be elevated in primary human bronchial epithelial cells following a stimulation with IL-17 (Jones & Chan, Citation2002). Therefore, one could hypothesize that a long exposure to PG.G or PG.G/Nic aerosols may elicit an IL-17-dependent signaling cascade in lung epithelial cells. Future studies should be undertaken to test this hypothesis.
An integral part of the proposed framework is the use of omics technologies and systems biology approaches. Because previous studies have reported the link between osmotic stress and both glycerol and propylene glycol (Katkov et al., Citation1998; Mortimer et al., Citation2013; Schwartz et al., Citation2009), we demonstrate here the application of a network-based analysis to assess the impact of the test aerosols on osmotic stress.
The biological impact of the aerosols on osmotic stress can be inferred from the transcriptome profiles and a network model of “osmotic stress” (the network model can be viewed at http://causalbionet.com) (). The network model is relevant for lung biology and is encoded using Biological Expression Language (BEL) (Boué et al., Citation2015). The impact of exposure on the network is quantified using the NPA algorithm described in a previous publication (Martin et al., Citation2014).
Figure 13. Systems toxicological assessment using biological network models. A, An illustration of the derivation of network perturbation amplitude (NPA) using causal network models and transcriptome data to assess the impact of exposure relative to controls. The NPA methodology has been described previously (Martin et al., Citation2014). B, Exposure-induced perturbation of osmotic stress network model. Each node contains the information pertaining to the levels of perturbation associated with the test aerosols. Insets, perturbations of hyperosmotic response (coded in BEL language as “bp(GOBP:hyperosmotic response), the kinase activity of ataxia-telangiectasia mutated (ATM) (coded as kin(p(HGNC:ATM)), and the nuclear factor (NF)-κB complex (coded as “complex(SCOMP:Nfkb Complex)”) are shown.
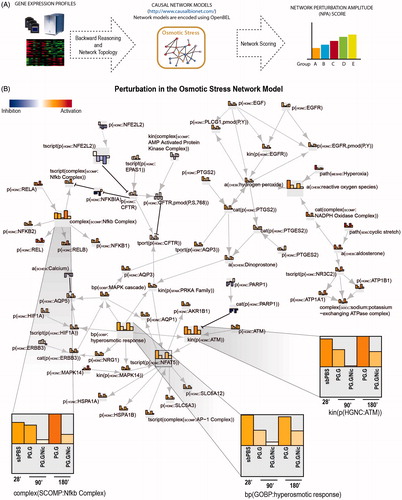
The perturbation of the network model can be used to obtain a more in-depth analysis at the molecular level. The degree of impact of the test aerosols on each of the nodes is represented as bars: The taller the bar, the greater the aerosol impact (). The perturbations of the nodes in a network model can be used to support a hypothesis generation or to serve as a starting point for additional experiments. For example, suggests that activation of NF-κB pathway or ataxia-telangiectasia mutated (ATM)-dependent pathway could be associated with PG.G or PG.G/Nic aerosol exposure. Therefore, additional experiments to validate the observation (e.g. Western blot, qPCR) could be done in future studies.
The characteristics of aerosols are dependent on the aerosol generation device. Moreover, the particle size and flow of the aerosol, as well as the surrounding temperature, influence the deposition of aerosols in the test system, thereby influencing the toxicity outcomes. A characterization of the test aerosol should therefore be done as part of the assessment. For the present example, we show here the distribution of particle size in the test aerosol generated by nebulizing a PG.G/Nic mixture using a Collison nebulizer (). Depending on the device, the characteristics of the generated aerosol (e.g. droplet size distribution and composition) may be different. In this experiment, we observed that the nebulized PG.G/Nic had a bimodal distribution with the highest peak at an aerodynamic diameter of 0.6 μm and the second highest peak for 3 μm droplet-diameter (). The error bars show the standard deviation among the three replicate nebulization runs, suggesting a low variability across the different runs. The results suggest that the nebulized aerosols were stable and resulting in a stable aerosol size distribution during the nebulization experiments.
Figure 14. Particle size distribution of the aerosols and depositions in the Vitrocell base module. A, The droplet size distribution of the aerosol generated using the Collison nebulizer (N = 3). Error bars indicate the standard error of the mean. B, Concentrations of PG, G, and Nic in the PBS-filled inserts placed in the Vitrocell base module after exposure to the test aerosols for 30, 60, 90, or 180 min (upper panels). The proportion of PG, G, and Nic in the PBS-filled inserts after they were exposed to the test aerosols for the various exposure durations (lower panel). Abbreviations: G: glycerol; Nic: nicotine; PG: propylene glycol.
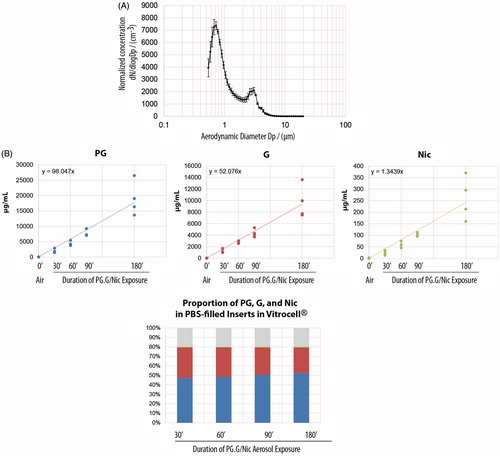
Moreover, the deposition of the main components (i.e. propylene glycol, glycerol, and nicotine) in PBS-filled inserts placed within the Vitrocell base module were also measured (). We show that the proportion of the mixture collected in the PBS-filled inserts was consistent with the original liquid mixture, after various durations of exposure (, lower panel).
An example of the third-layer assessment of ENDS aerosol following CORESTA guidelines
We present here an example where the biological impact of an aerosol generated from an ENDS prototype was compared with smoke generated from the reference cigarette 3R4F on a human 3D bronchial epithelial tissue culture model. Considering the lack of a standard vaping protocol for e-cigs, we followed the recommended e-cig vaping protocol of the CORESTA E-Cigarette Task Force: 55 mL volume taken over 3 s every 30 s using a square profile shape (CORESTA, Citation2015a). As a benchmark comparison, the HC smoking protocol (Health Canada, Citation1999) was performed for 3R4F cigarette ().
Figure 15. Experimental design to test ENDS aerosol as compared to 3R4F smoke. A, An illustration of the generation of aerosol using a smoking machine and of the exposure set-up using the Vitrocell exposure system. The CORESTA recommendation of E-cig smoking protocol was used to generate ENDS aerosol; whereas Health Canada smoking protocol was used to generate 3R4F smoke. B, the experimental groups. The 3D bronchial epithelial cultures were exposed to aerosols from a representative e-cig and smoke from 3R4F at the comparable nicotine concentration in the aerosol/smoke. C, Various endpoints measured following exposure. Abbreviations: AK: adenylate kinase; ENDS: electronic nicotine delivery systems.
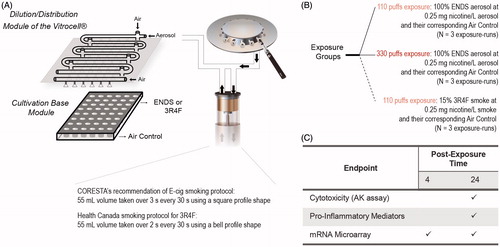
Although the vaping/smoking protocols are not identical, to facilitate a fair comparison, we administered an identical nicotine concentration in the aerosols of the ENDS prototype and in the 3R4F smoke: 0.25 mg nicotine/L. This nicotine concentration was equal to an undiluted aerosol of the ENDS prototype (100%) or to 15% 3R4F smoke. The 3D bronchial cultures were exposed to the ENDS prototype aerosol for 110- and 330 puffs, or to 110 puffs of 15% 3R4F smoke (). Within an exposure run, an air-exposed control was included.
The cytotoxicity associated with the ENDS prototype aerosol and 3R4F smoke was quantitatively assessed by measuring the levels of AK released from the 3D cultures into the basolateral media, at 24-h post-exposure. We observed minimal alterations in cytotoxicity levels following the 110 puffs of 100% ENDS aerosol compared with 15% 3R4F smoke, at the comparable total nicotine concentrations (). Greater variability of the cytotoxicity levels were observed in the cultures exposed to 330 puffs of 100% ENDS (N = 3).
Figure 16. Cytotoxicity and secretion of mediators following 100% ENDS aerosol exposure as compared with 3R4F smoke in a 3D bronchial culture model. A, normalized cytotoxicity levels were evaluated by measuring adenylate kinase (AK) activity in the basolateral media after the cultures were exposed to e-cig aerosol and 3R4F smoke. Triton-X treated cultures were considered as 100% cytotoxicity. B, Fold changes of various mediators were measured in the basolateral media of the cultures at 24 h post-exposure using a Luminex-based technology. Abbreviations: CCL: chemokine C-C Motif Ligand; CSF: colony-stimulating factor; G-CSF: granulocyte colony-stimulating factor; GM-CSF: granulocyte–macrophage colony-stimulating factor; IL: interleukin; IP-10; interferon gamma-induced protein 10; MCP: monocyte chemoattractant protein; MIP3a: macrophage inflammatory protein; MMP: matrix metalloproteinase; Rantes: regulated on activation, normal T-cell expressed and secreted; sICAM1: soluble intercellular adhesion molecule-1; TIMP1: tissue inhibitor of metalloproteinase; TNFA: tumor necrosis factor alpha; TSLP: thymic stromal lymphopoietin; VEGFA: vascular endothelial growth factor.
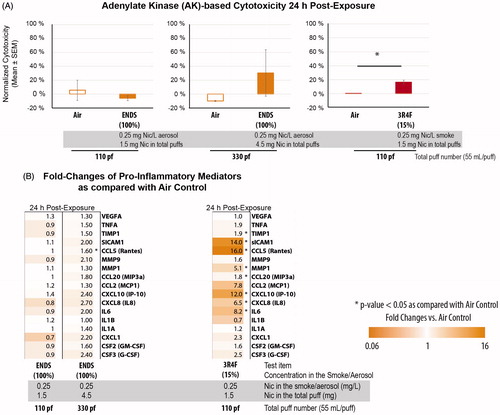
We compared the levels of secreted pro-inflammatory mediators following the exposure to the aerosol of an ENDS prototype and smoke from the 3R4F cigarette. At the comparable nicotine level in the aerosol/smoke, greater elevation in secreted pro-inflammatory mediators was observed in 15% 3R4F-exposed samples than in the ENDS prototype-exposed samples for most of the mediators (). The levels of soluble intercellular adhesion molecule (sICAM)-1, chemokine C-C Motif Ligand (CCL)-5 (a.k.a. Rantes), and CXCL10 (interferon gamma-induced protein (IP)-10) were greatly induced in the cultures exposed to 15% 3R4F. Elevated levels of Rantes expression have been reported in the sputum of chronic obstructive pulmonary disease (COPD) patients as compared with nonsmokers (Costa et al., Citation2008), in patients with chronic rhinosinusitis characterized by persistent mucosal inflammation, following a stimulation with CS extract plus double-stranded RNA (Yamin et al., Citation2008), and in the bronchial mucosa severe COPD patients (both in smokers or nonsmokers) (Di Stefano et al., Citation2009). Furthermore, sICAM1, which has been suggested as a marker for the severity of airway inflammation (Bijanzadeh et al., Citation2009), had been reported to be increased in the primary explant cultures of human bronchial epithelial cells from smokers with COPD (Rusznak et al., Citation2000). In addition, the concentrations of CXCL10 were significantly higher in the sputum of COPD patients when compared with nonsmokers (Costa et al., Citation2008).
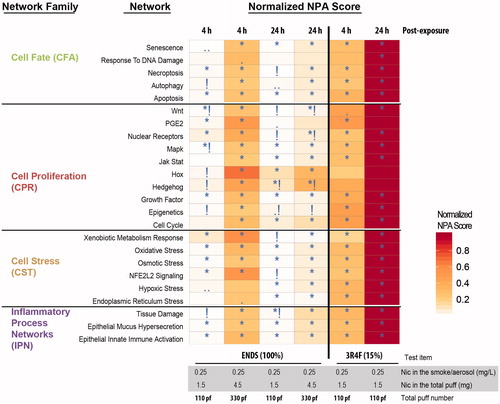
Similar to the assessment of the test PG.G and PG.G/Nic aerosols, we infer the biological impact of the ENDS aerosol and 3R4F smoke from transcriptome profiles using a network-based analysis. Here, a collection of network models were used to assess various mechanisms relevant for human lung biology (the network models can be viewed at http://causalbionet.com).
Perturbation of the networks was assessed at two different post-exposure time points: 4 h and 24 h. The scores of the network perturbations for each of the exposure conditions relative to their corresponding air control are displayed as a heatmap (). In general, for the 110-puffs duration, 15% 3R4F smoke resulted in the greatest perturbation for all networks, and 100% ENDS aerosol was linked to minimal perturbations. The longer exposure duration (330 puffs) of ENDS aerosol resulted in a higher network perturbation, which was still lower than that for 110 puffs of 15% 3R4F smoke.
Figure 17. Systems toxicological assessment of 100% ENDS aerosol and 15% 3R4F smoke using biological network models. Heatmap showing network models that were significantly impacted in at least one contrast (exposed versus air-control). A network is significantly perturbed (*) if the NPA score remains significant after accounting for the experimental variation and if the companion statistics O and K are significant, details of the NPA algorithm was described previously (Martin et al., Citation2014). The symbol (•) indicates p values of O and K between 0.05 and 0.75; (••) indicates p values of O and K between 0.075 and 0.100; and (!) indicates non significance with respect to the experimental variation.
Materials and methods for the use-case
Test items
Mixtures
Two different stock mixtures were prepared to represent e-liquids:
A propylene glycol and glycerol mixture composed of a 78% solution of propylene glycol:glycerol (70:30) and 22% PBS, referred to as “PG.G” mixture; and
A propylene glycol, glycerol, and nicotine mixture, composed of a 78% solution of propylene glycol:glycerol (70:30); 20% PBS; and 2% nicotine, referred to as “PG.G/Nic” mixture.
Propylene glycol (Cat #82280), glycerol (Cat #G9012), and nicotine (Cat #3876-100) were purchased from Sigma-Aldrich, St. Louis, MO.
Test systems
2D culture system
Primary NHBE cells (from 60-year-old Caucasian male) were purchased from Lonza (Basel, Switzerland). The cells were maintained in a humidified incubator at 37 °C and 5% CO2. The cells were cultured in bronchial epithelial cell medium (Bullet Kit CC 3170, Lonza) according to the manufacturer’s recommendations.
3D culture system
Organotypic human bronchial epithelial tissue culture model MucilAirTM was purchased from Epithelix Sarl, Geneva, Switzerland. The cells were cultured at the air-liquid interface in 24-well plates with Transwell® inserts (6.5 mm diameter, 0.4 μm pore size, cat #3413, Corning Incorporated, Tewksbury, MA). The bronchial epithelial cells used to generate the models were isolated from one donor (non-smoker) who underwent surgical lobectomy. The MucilAir™ models were maintained at 37 °C in MucilAir™ culture medium with medium renewal every 48 h according to the supplier’s instructions.
Aerosol generation
Aerosols were generated from the mixtures described above using the 1-jet Collison nebulizer (BGI, Inc., Waltham, MA). During the exposure experiment, the MucilAir™ culture model grown on inserts was placed in the cultivation base module of the Vitrocell system. Three exposure runs were conducted to assess the effects of the two mixtures for 90 and 180 min. In addition, a nebulized aqueous CS extract (smoke-bubbled PBS [sbPBS]) was used as the positive control. The sbPBS mixture was generated by bubbling smoke from 10 3R4F cigarettes (www.ca.uky.edu/refcig, University of Kentucky, Kentucky Tobacco Research and Development Center, Lexington, KY) for a total of 110 puffs in 40 mL PBS solution. Each exposure run included an air control to address confounding factors because of the variability across exposure runs.
A test aerosol of a representative e-cig was generated following the vaping protocol recommended by the CORESTA E-Cigarette Task Force: 55 mL volume taken over 3 s every 30 s using a square profile shape (CORESTA, Citation2015a). The reference cigarette 3R4F (University of Kentucky, KY, www.ca.uky.edu/refcig) was smoked according to the Health Canada smoking regimen parameters of 55 mL volume taken over 2 s every 30 s using a bell profile shape (Health Canada, Citation1999).
Endpoint measurements
xCELLigence
Cell viability, measured as the change in cell index over time, was monitored and recorded throughout the duration of the experiment using xCELLigence™, a multielectrode array-based real-time cellular analysis (RTCA) (ACEA Biosciences Inc., San Diego, CA). NHBE cells were seeded into E-Plate View 96-well tissue culture plates (ACEA Biosciences) in 100 μL of culture medium. The cultures were maintained at 37 °C and 5% CO2. Cells were then exposed (in triplicate) to different concentrations of test mixtures for an additional 24 h. A positive control (carbonyl cyanide m-chlorophenyl hydrazine) was included in each experiment.
HCS assays
The following parameters were measured using HCS-based assays: Cell number, apoptosis (caspase 3/7 activity and cytochrome c release), necrosis (cellular membrane permeability), mitochondrial mass, NF-κB nuclear translocation, cJun phosphorylation, GSH content, ROS formation, and cell cycle distribution. All endpoints were measured, in a dose-dependent manner, after 4 h or 24 h of exposure (as indicated). In parallel, appropriate positive controls were used for each assay, as previously described (Gonzalez-Suarez et al., Citation2014, Citation2016; Marescotti et al., Citation2015).
AK assay
The adenylate kinase (AK)-based cytotoxicity assay was carried out in organotypic tissue cultures. AK activity was measured from the basolateral medium of the tissue cultures, using a ToxiLight™ bioassay kit (Lonza). AK values were normalized using the mean of the positive control (Triton X-100-treated tissue inserts) and negative control (PBS-treated or untreated tissue inserts). Triton X-100 (at 1% final concentration) was added to the basolateral side, to induce a complete lysis of the cells (=100% cytotoxicity).
Histology processing of 3D cultures
Tissue inserts were washed three times with PBS and fixed in freshly prepared 4% paraformaldehyde (PFA). Two sections (per culture inset) were embedded into a paraffin block, sectioned, and stained with hematoxylin (Merck Millipore, Billerica, MA) and eosin (Sigma-Aldrich, St. Louis, MO) (H&E), and alcian blue (Sigma-Aldrich), as described in previous publications (Iskandar et al., Citation2015).
Cilia beating frequency measurement in 3D cultures
Measurement of ciliary beating frequency was conducted using CiliaFA (Smith et al., Citation2012), according to the software instructions, for 512 frames per microscopic field. Two microscopic fields were recorded from each tissue culture insert.
Luminex-based measurement of mediators secreted from 3D cultures
Profiling of secreted pro-inflammatory mediators was carried out by collecting 200 μL of basolateral medium from 3D-organotypic tissue cultures as previously reported (Iskandar et al., Citation2015; Martin et al., Citation2014), using Luminex® xMAP® technology (Luminex, Austin, TX) and the commercially available assay panels (EMD Millipore Corp., Schwalbach, Germany).
mRNA microarray
Total RNA was isolated after washing the 3D cultures twice with cold (4 °C) PBS on both the basal and apical sides, as described in previous publications (Iskandar et al., Citation2015; Martin et al., Citation2014). Affymetrix-3′ IVT-array-Cartridge-Hybridization (IVT Plus) was used for the hybridization on GeneChip® Human Genome U133 Plus 2.0 Array.
Processing and quality control (QC) of raw CEL files of the mRNA microarray
The raw CEL files were background-corrected, normalized, and summarized using frozen-robust microarray analysis (fRMA) (McCall et al., Citation2010). Background correction and quantile normalization were used to generate microarray expression values from all arrays passing quality control checks; QC was performed using the custom CDF environment HGU133Plus2_Hs_ENTREZG v16.0 (Dai et al., Citation2005). For various experimental factors (e.g. dose and post-exposure time-points), a model for estimating the treatment effect was fitted with Limma (Smyth, Citation2004), by including the covariate exposure run as a blocking variable to account for insert-pairing (exposed versus air-exposed control) during one exposure experiment. The p values for each computed effect were adjusted across genes using the Benjamini–Hochberg false discovery rate (FDR). Differentially expressed genes (DEGs) were defined as the set of genes whose FDR was <0.05.
Network perturbation amplitude analysis
The collection of causal biological networks used in the study was the human network suite CBN v1.3 (Boué et al., Citation2015). The NPA methodology aims to contextualize high dimensional transcriptomics data by combining gene expression (log2) fold-changes into fewer differential node values; the NPA approach was used to quantify the exposure-induced perturbation and described in greater detail previously (Martin et al., Citation2014).
Droplet size distribution measurement
The droplet size distribution exiting the nebulization (identical flow rates used in the exposure experiment was applied) was measured using TSI 3321 Aerodynamic Particle Sizer® (APS) spectrometer from TSI, Inc. (Shoreview, MN). The droplet size distribution was measured during three independent nebulization runs and recorded every second during 90 s for each run. The average normalized distribution was calculated. Finally, the average normalized droplet size distribution over the three replicate runs were calculated and plotted along with their standard deviation to infer the variability of the aerosol generation across the different exposure runs.
Nicotine, propylene glycol, and glycerol measurement in PBS-exposed samples
Deposition efficiency of nicotine, propylene glycol, and glycerol were tested in PBS-exposed samples. Briefly, 100 μL of PBS were placed into steel inserts of the Vitrocell exposure module and exposed to the nebulized test PG.G/Nic aerosols using the Vitrocell system. The concentrations of propylene glycol and glycerol were measured using gas chromatography/mass spectrometry (GC/MS); nicotine concentrations were measured using liquid chromatography (LC)-MS/MS.
Conclusion
The toxicological assessment of ENDS and e-liquids remains challenging in the absence of regulatory requirements. The pre-clinical safety toxicology data is used to substantiate the safe use of e-cigs in a clinical setting, and validate health claims for ENDS. Today, published data are limited to a small number of in vitro and even fewer in vivo studies. Along with the Three Rs principles (Balls, Citation2010) and the 21st Century Toxicology framework (Berg et al., Citation2011; Rovida et al., Citation2015; Sheldon & Cohen Hubal, Citation2009), our proposed framework emphasizes in vitro toxicity testing using relevant test systems, such as primary human cell cultures and 3D airway culture systems. The proposed framework combines and integrates several emerging technologies for a systems toxicology assessment of e-liquids and their aerosols, aimed to complement the battery of assays for standard toxicity assessments (). Therefore, the presented framework is also aligned with the Safety Evaluation Ultimately Replacing Animal Testing (SEURAT)-1 program, in which in vitro mechanism-based toxicity testing strategy is integrated into modern safety assessment approaches (Gocht et al., Citation2015). To provide accurate and reliable chemistry data solidifying the toxicological assessment, the framework incorporates analytical chemistry investigations (a similar approach to the classical standard battery of assays for conventional CS toxicity testing). Moreover, depending on the specific purpose of the assessment, specific adverse outcome pathways (AOPs) can be defined and adapted for the layered framework assessment, thereby specific assays will be defined to address and evaluate specific effects of test mixtures (e-liquids) on the specific key events or intermediate steps associated with a defined AOP. In other words, the framework should be adapted and made fit-for-purpose for evaluating the AOP of interest. The goal of this proposed framework is to foster understanding and to encourage future developments of robust in vitro toxicity assessments of e-liquids and their aerosols. The examples reported here illustrate the suitability of the framework for assessing e-liquids and their aerosols; future studies should be conducted to allow a rigorous impact assessment of propylene glycol, glycerol, nicotine, and flavor ingredients that fit for the purpose of substantiating the safe use of e-cigs in a clinical setting.
Funding information
This work was funded by Philip Morris Product SA (a member of Philip Morris International Group of Companies).
Supplementary Figures
Download PDF (500 KB)Acknowledgements
The authors thank Dr. Walter Schlage for the critical review of the manuscript. The authors also thank the following individuals for contributing their technical expertise: Laura Ortega Torres and Stephanie Johne (the handling and the measurements of cytotoxicity, CYP activity, and cilia beating frequency in 3D culture systems); Alexandra Laurent (the measurement using xCELLigence); Keyur Trivedi and Abdelkader Benyagoub (the histological processing); Celine Merg (the Luminex-based measurement); and Karine Baumer, Remi Dulize, and Dariusz Peric (the microarray experiment), as well as Dr. Markus Nordlund and Dr. Sandro Steiner (the assessment of droplet size distribution of the aerosols). Finally, the authors thank Samantha Elmhurst for illustrating aerosol generation devices, particle size measurement devices, and other laboratory equipment.
Disclosure statement
PMI is developing products with the potential to reduce individual risk and population harm in comparison to smoking combustible cigarettes. This study/research involves PMI investigational products and was conducted by PMI employees/consultants with PMI funding. The authors had full access to all study/research data and ensure their integrity as well as the accuracy of the data analysis.
Related Research Data
References
- Albino AP, Huang X, Jorgensen E, et al. (2004). Induction of H2AX phosphorylation in pulmonary cells by tobacco smoke: a new assay for carcinogens. Cell Cycle 3:1062–8.
- Balls M. (2010). ATLA (Alternatives to Laboratory Animals): past, present and future. Altern Lab Anim 38:437–41.
- Behar RZ, Hua M, Talbot P. (2015). Puffing topography and nicotine intake of electronic cigarette users. PLoS One 10:e0117222.
- Berg N, De Wever B, Fuchs HW, et al. (2011). Toxicology in the 21st century-working our way towards a visionary reality. Toxicol In Vitro 25:874–81.
- Bijanzadeh M, Ramachandra NB, Mahesh PA, et al. (2009). Soluble intercellular adhesion molecule-1 and E-selectin in patients with asthma exacerbation. Lung 187:315–20.
- Boué S, Talikka M, Westra JW, et al. (2015). Causal biological network database: a comprehensive platform of causal biological network models focused on the pulmonary and vascular systems. Database 2015.
- Brandon TH, Goniewicz ML, Hanna NH, et al. (2015). Electronic nicotine delivery systems: a policy statement from the American Association for Cancer Research and the American Society of Clinical Oncology. J Clin Oncol 33:952–63.
- Brown CJ, Cheng JM. (2014). Electronic cigarettes: product characterisation and design considerations. Tob Control 23:ii4–10.
- Buchser W, Collins M, Garyantes T, et al. (2004). Assay development guidelines for image-based high content screening, high content analysis and high content imaging. 2012 Oct 1 [Updated 2014 Sep 22]. In Sittampalam GS, Coussens NP, Nelson H, et al., eds. Assay guidance manual [Internet]. Bethesda (MD): Eli Lilly & Company and the National Center for Advancing Translational Sciences. Available from: https://www.ncbi.nlm.nih.gov/books/NBK100913/.
- Callahan-Lyon P. (2014). Electronic cigarettes: human health effects. Tob Control 23:ii36–40.
- Catallo WJ, Kennedy CH, Henk W, et al. (2001). Combustion products of 1,3-butadiene are cytotoxic and genotoxic to human bronchial epithelial cells. Environ Health Perspect 109:965–71.
- Chen W, Wong C, Vosburgh E, et al. (2014). High-throughput image analysis of tumor spheroids: a user-friendly software application to measure the size of spheroids automatically and accurately. J Vis Exp 89:e51639, doi:10.3791/51639.
- Comouth A, Saathoff H, Naumann K-H, et al. (2013). Modelling and measurement of particle deposition for cell exposure at the air–liquid interface. J Aerosol Sci 63:103–14.
- Constant S, Wiszniewski L, Huang S. (2014). The use of in vitro 3D cell models of human airway epithelia (MucilAirTM) in inhalation toxicity. In Haycock J, Whluwalia A, Wilkinson M, eds. Cellular in vitro testing: methods and protocols. London: CRC Press, 15–33.
- CORESTA. (2004). The CORESTA E-Cigarette Task Force. The rationale and strategy for conducting in vitro toxicology testing of tobacco smoke. Available from: http://www.coresta.org/Reports/IVT_TF_Rationale-IVT-Testing-Tob.-Smoke_Report_Jun04.pdf.
- CORESTA. (2015a). The CORESTA E-Cigarette Task Force. Electronic cigarette aerosol parameters study. Available from: http://www.coresta.org/Reports/ECIG-CTR_ECigAerosolParameters-2014Study_March2015.pdf.
- CORESTA. (2015b). CORESTA recommended method No 81. Routine analytical machine for e-cigarette aerosol generation and collection – devinitions and standard conditions. Available from: http://www.coresta.org/Recommended_Methods/CRM_81.pdf.
- Costa C, Rufino R, Traves SL, et al. (2008). CXCR3 and CCR5 chemokines in induced sputum from patients with COPD. Chest 133:26–33.
- Costigan S, Meredith C. (2015). An approach to ingredient screening and toxicological risk assessment of flavours in e-liquids. Regul Toxicol Pharmacol 72:361–9.
- Crotty Alexander L, Fuster M, Montgrain P, et al. (2015). The need for more e-cigarette data: a call to action. Am J Resp Crit Care Med 192:275–6.
- Dai M, Wang P, Boyd AD, et al. (2005). Evolving gene/transcript definitions significantly alter the interpretation of GeneChip data. Nucleic Acids Res 33:e175.
- Davis B, Dang M, Kim J, et al. (2015). Nicotine concentrations in electronic cigarette refill and do-it-yourself fluids. Nicotine Tob Res 17:134–41.
- Di Stefano A, Caramori G, Gnemmi I, et al. (2009). Association of increased CCL5 and CXCL7 chemokine expression with neutrophil activation in severe stable COPD. Thorax 64:968–75.
- Fagerström KO, Bridgman K. (2014). Tobacco harm reduction: the need for new products that can compete with cigarettes. Addict Behav 39:507–11.
- Famele M, Ferranti C, Abenavoli C, et al. (2015). The chemical components of electronic cigarette cartridges and refill fluids: review of analytical methods. Nicotine Tob Res 17:271–9.
- Farsalinos KE, Le Houezec J. (2015). Regulation in the face of uncertainty: the evidence on electronic nicotine delivery systems (e-cigarettes). Risk Manag Healthc Policy 8:157–67.
- Farsalinos KE, Polosa R. (2014). Safety evaluation and risk assessment of electronic cigarettes as tobacco cigarette substitutes: a systematic review. Ther Adv Drug Saf 5:67–86.
- Farsalinos KE, Romagna G, Allifranchini E, et al. (2013). Comparison of the cytotoxic potential of cigarette smoke and electronic cigarette vapour extract on cultured myocardial cells. Int J Environ Res Public Health 10:5146–62.
- Farsalinos KE, Voudris V, Poulas K. (2015). E-cigarettes generate high levels of aldehydes only in ‘dry puff’ conditions. Addiction 110:1352–6.
- FDA. (2012). Guidance for industry S2(R1) genotoxicity testing and data interpretation for pharmaceuticals intended for human use. Available from: http://www.fda.gov/downloads/Drugs/…/Guidances/ucm074931.pdf.
- Flora JW, Meruva N, Huang CB, et al. (2016). Characterization of potential impurities and degradation products in electronic cigarette formulations and aerosols. Regul Toxicol Pharmacol 74:1–11.
- Gocht T, Berggren E, Ahr HJ, et al. (2015). The SEURAT-1 approach towards animal free human safety assessment. Altex 32:9–24.
- Gonzalez-Suarez I, Martin F, Marescotti D, et al. (2016). In vitro systems toxicology assessment of a candidate modified risk tobacco product shows reduced toxicity compared to that of a conventional cigarette. Chem Res Toxicol 29:3–18.
- Gonzalez-Suarez I, Sewer A, Walker P, et al. (2014). Systems biology approach for evaluating the biological impact of environmental toxicants in vitro. Chem Res Toxicol 27:367–76.
- Haney SA, Bowman D, Chakravarty A, et al. (2015). An introduction to high content screening: imaging technology, assay development, and data analysis in biology and drug discovery. Wiley. Available from: http://www.books24x7.com/marc.asp?bookid=80823.
- Harrell PT, Simmons VN, Correa JB, et al. (2014). Electronic nicotine delivery systems (“e-cigarettes”): review of safety and smoking cessation efficacy. Otolaryngol Head Neck Surg 151:381–93.
- Health Canada. (1999). Determination of tar, water, nicotine and carbon monoxide in mainstream tobacco smoke. Health Canada Test Method T-11.
- HHS, FDA, CDER, et al. (2012). U.S. Department of Health and Human Services (HHS), Food and Drug Administration (FDA), Center for Drug Evaluation and Research (CDER), and Center for Biologics Evaluation and Research (CBER). Guidance for industry. S2(R1) genotoxicity testing and data interpretation for pharmaceuticals intended for human use. Available from: http://www.fda.gov/downloads/Drugs/…/Guidances/ucm074931.pdf.
- Hoeng J, Talikka M, Martin F, et al. (2014). Case study: the role of mechanistic network models in systems toxicology. Drug Discov Today 19:183–92.
- Hubbs AF, Battelli LA, Goldsmith WT, et al. (2002). Necrosis of nasal and airway epithelium in rats inhaling vapors of artificial butter flavoring. Toxicol Appl Pharmacol 185:128–35.
- Hubbs AF, Cumpston AM, Goldsmith WT, et al. (2012). Respiratory and olfactory cytotoxicity of inhaled 2,3-pentanedione in Sprague-Dawley rats. Am J Pathol 181:829–44.
- Hughes JR, Keely J, Naud S. (2004). Shape of the relapse curve and long-term abstinence among untreated smokers. Addiction 99:29–38.
- IOM. (2001). Institute of Medicine (US) Committee to assess the science base for tobacco harm reduction. In Stratton K, Shetty P, Wallace R, et al., eds. Clearing the smoke: assessing the science base for tobacco harm reduction. Washington (DC): National Academies Press (US); 2001. 7, Implementation of a Science-Based Policy of Harm Reduction. Available from: http://www.ncbi.nlm.nih.gov/books/NBK222381/.
- Iskandar AR, Xiang Y, Frentzel S, et al. (2015). Impact assessment of cigarette smoke exposure on organotypic bronchial epithelial tissue cultures: a comparison of mono-culture and coculture model containing fibroblasts. Toxicol Sci 147:207–21.
- Jones CE, Chan K. (2002). Interleukin-17 stimulates the expression of interleukin-8, growth-related oncogene-alpha, and granulocyte-colony-stimulating factor by human airway epithelial cells. Am J Respir Cell Mol Biol 26:748–53.
- Katkov II, Katkova N, Critser JK, et al. (1998). Mouse spermatozoa in high concentrations of glycerol: chemical toxicity vs osmotic shock at normal and reduced oxygen concentrations. Cryobiology 37:325–38.
- Ke N, Wang X, Xu X, et al. (2011). The xCELLigence system for real-time and label-free monitoring of cell viability. Methods Mol Biol 740:33–43.
- Kikawa Y, Hosoi S, Inoue Y, et al. (1991). Exercise-induced urinary excretion of leukotriene E4 in children with atopic asthma. Pediatr Res 29:455–9.
- Kim S, Goniewicz ML, Yu S, et al. (2015). Variations in label information and nicotine levels in electronic cigarette refill liquids in South Korea: regulation challenges. Int J Environ Res Public Health 12:4859–68.
- Kogel U, Gonzalez Suarez I, Xiang Y, et al. (2015). Biological impact of cigarette smoke compared to an aerosol produced from a prototypic modified risk tobacco product on normal human bronchial epithelial cells. Toxicol in Vitro 29:2102–15.
- Kosmider L, Sobczak A, Fik M, et al. (2014). Carbonyl compounds in electronic cigarette vapors—effects of nicotine solvent and battery output voltage. Nicotine Tob Res 16:1319–26.
- Leopold PL, O’Mahony MJ, Lian XJ, et al. (2009). Smoking is associated with shortened airway cilia. PLoS One 4:e8157.
- Lerner CA, Sundar IK, Yao H, et al. (2015). Vapors produced by electronic cigarettes and e-juices with flavorings induce toxicity, oxidative stress, and inflammatory response in lung epithelial cells and in mouse lung. PLoS One 10:e0116732.
- Manigrasso M, Buonanno G, Fuoco FC, et al. (2015). Aerosol deposition doses in the human respiratory tree of electronic cigarette smokers. Environ Pollut 196:257–67.
- Marescotti D, Gonzalez Suarez I, Acali S, et al. (2015). High content screening analysis to evaluate the toxicological effects of harmful and potentially harmful constituents (HPHC). J Vis Exp.
- Martin F, Sewer A, Talikka M, et al. (2014). Quantification of biological network perturbations for mechanistic insight and diagnostics using two-layer causal models. BMC Bioinformatics 15:238.
- Martin F, Thomson TM, Sewer A, et al. (2012). Assessment of network perturbation amplitudes by applying high-throughput data to causal biological networks. BMC Syst Biol 6:54.
- Mathis C, Poussin C, Weisensee D, et al. (2013). Human bronchial epithelial cells exposed in vitro to cigarette smoke at the air-liquid interface resemble bronchial epithelium from human smokers. Am J Physiol Lung Cell Mol Physiol 304:L489–503.
- McCall MN, Bolstad BM, Irizarry RA. (2010). Frozen robust multiarray analysis (fRMA). Biostatistics 11:242–53.
- McRobbie H, Bullen C, Hartmann-Boyce J, et al. (2014). Electronic cigarettes for smoking cessation and reduction. Cochrane Database Syst Rev 12:CD010216.
- Misra M, Leverette RD, Cooper BT, et al. (2014). Comparative in vitro toxicity profile of electronic and tobacco cigarettes, smokeless tobacco and nicotine replacement therapy products: e-liquids, extracts and collected aerosols. Int J Environ Res Public Health 11:11325–47.
- Mortimer D, Barratt CLR, Björndahl L, et al. (2013). What should it take to describe a substance or product as ‘sperm-safe’. Hum Reprod Update 19:i1–i45.
- Muller T, Gebel S. (1994). Heme oxygenase expression in Swiss 3T3 cells following exposure to aqueous cigarette smoke fractions. Carcinogenesis 15:67–72.
- Nordlund M, Belka M, Kuczaj AK, et al. (2015). Aerosol particle deposition measurements in a realistic cast of the human respiratory system. Aerosol Sci Technol (Submitted, under review).
- Oberdörster G. (2012). Nanotoxicology: in vitro–in vivo dosimetry. Environ Health Perspect 120:a13.
- Orr MS. (2014). Electronic cigarettes in the USA: a summary of available toxicology data and suggestions for the future. Tob Control 23:ii18–22.
- Paur H-R, Cassee FR, Teeguarden J, et al. (2011). In-vitro cell exposure studies for the assessment of nanoparticle toxicity in the lung—a dialog between aerosol science and biology. J Aerosol Sci 42:668–92.
- Polosa R, Campagna D, Sands MF. (2016). Counseling patients with asthma and allergy about electronic cigarettes: an evidence-based approach. Ann Allergy Asthma Immunol 116:106–11.
- Poussin C, Laurent A, Peitsch MC, et al. (2015). Systems biology reveals cigarette smoke-induced concentration-dependent direct and indirect mechanisms that promote monocyte-endothelial cell adhesion. Toxicol Sci 147:370–85.
- Proud D, Leigh R. (2011). Epithelial cells and airway diseases. Immunol Rev 242:186–204.
- Roemer E, Tewes FJ, Meisgen TJ, et al. (2002). Evaluation of the potential effects of ingredients added to cigarettes. Part 3: in vitro genotoxicity and cytotoxicity. Food Chem Toxicol 40:105–11.
- Romagna G, Allifranchini E, Bocchietto E, et al. (2013). Cytotoxicity evaluation of electronic cigarette vapor extract on cultured mammalian fibroblasts (ClearStream-LIFE): comparison with tobacco cigarette smoke extract. Inhal Toxicol 25:354–61.
- Rovida C, Asakura S, Daneshian M, et al. (2015). Toxicity testing in the 21st century beyond environmental chemicals. Altex 32:171–81.
- Rusznak C, Mills PR, Devalia JL, et al. (2000). Effect of cigarette smoke on the permeability and IL-1beta and sICAM-1 release from cultured human bronchial epithelial cells of never-smokers, smokers, and patients with chronic obstructive pulmonary disease. Am J Respir Cell Mol Biol 23:530–6.
- Scheffler S, Dieken H, Krischenowski O, et al. (2015). Evaluation of e-cigarette liquid vapor and mainstream cigarette smoke after direct exposure of primary human bronchial epithelial cells. Int J Environ Res Public Health 12:3915–25.
- Schlage WK, Iskandar AR, Kostadinova R, et al. (2014). In vitro systems toxicology approach to investigate the effects of repeated cigarette smoke exposure on human buccal and gingival organotypic epithelial tissue cultures. Toxicol Mech Meth 24:470–87.
- Schwartz L, Guais A, Pooya M, et al. (2009). Is inflammation a consequence of extracellular hyperosmolarity? J Inflamm 6:21.
- Seagrave J, Albrecht H, Hill D, et al. (2012). Effects of guaifenesin, N-acetylcysteine, and ambroxol on MUC5AC and mucociliary transport in primary differentiated human tracheal-bronchial cells. Resp Res 13:98
- Sheldon LS, Cohen Hubal EA. (2009). Exposure as part of a systems approach for assessing risk. Environ Health Perspect 117:119–1194.
- Shivalingappa PC, Hole R, Westphal CV, et al. (2015). Airway exposure to e-cigarette vapors impairs autophagy and induces aggresome formation. Antioxid Redox Signal.
- Sirenko O, Mitlo T, Hesley J, et al. (2015). High-content assays for characterizing the viability and morphology of 3D cancer spheroid cultures. Assay Drug Dev Technol 13:402–14.
- Smith C, Djakow J, Free R, et al. (2012). ciliaFA: a research tool for automated, high-throughput measurement of ciliary beat frequency using freely available software. Cilia 1:14.
- Smyth GK. (2004). Linear models and empirical bayes methods for assessing differential expression in microarray experiments. Stat Appl Genet Mol Biol 3:Article 3.
- Stampfli MR, Anderson GP. (2009). How cigarette smoke skews immune responses to promote infection, lung disease and cancer. Nat Rev Immunol 9:377–84.
- Sturla SJ, Boobis AR, FitzGerald RE, et al. (2014). Systems toxicology: from basic research to risk assessment. Chem Res Toxicol 27:314–29.
- Subramanian A, Tamayo P, Mootha VK, et al. (2005). Gene set enrichment analysis: a knowledge-based approach for interpreting genome-wide expression profiles. Proc Natl Acad Sci USA 102:15545–50.
- Talih S, Balhas Z, Eissenberg T, et al. (2015). Effects of user puff topography, device voltage, and liquid nicotine concentration on electronic cigarette nicotine yield: measurements and model predictions. Nicotine Tob Res 17:150–7.
- Talikka M, Kostadinova R, Xiang Y, et al. (2014). The response of human nasal and bronchial organotypic tissue cultures to repeated whole cigarette smoke exposure. Int J Toxicol 33:506–17.
- Tan XL, Marquardt G, Massimi AB, et al. (2012). High-throughput library screening identifies two novel NQO1 inducers in human lung cells. Am J Respir Cell Mol Biol 46:365–71.
- Thomson TM, Sewer A, Martin F, et al. (2013). Quantitative assessment of biological impact using transcriptomic data and mechanistic network models. Toxicol Appl Pharmacol 272:863–78.
- Thorne D, Adamson J. (2013). A review of in vitro cigarette smoke exposure systems. Exp Toxicol Pathol 65:1183–93.
- Tierney PA, Karpinski CD, Brown JE, et al. (2015). Flavour chemicals in electronic cigarette fluids. Tob Control. doi:10.1136/tobaccocontrol-2014-052175.
- Tilley AE, Walters MS, Shaykhiev R, et al. (2015). Cilia dysfunction in lung disease. Annu Rev Physiol 77:379–406.
- Tippe A, Heinzmann U, Roth C. (2002). Deposition of fine and ultrafine aerosol particles during exposure at the air/cell interface. J Aerosol Sci 33:207–18.
- Vardavas CI, Agaku IT. (2015). Electronic cigarettes: the issues behind the moral quandary. In Loddenkemper R, Kreuter M, eds. The tobacco epidemic. Progress in respiratory research. 2nd ed. Basel: Karger Medical and Scientific Publishers vol. 42, 258–67.
- Varma H, Lo DC, Stockwell BR. (2011). High-throughput and high-content screening for Huntington’s disease therapeutics. In Lo DC, Hughes RE, eds. Neurobiology of Huntingon’s disease: applications to drug discovery. Boca Raton (FL): CRC Press/Taylor & Francis, 121–45.
- Wan J, Johnson M, Schilz J, et al. (2009). Evaluation of in vitro assays for assessing the toxicity of cigarette smoke and smokeless tobacco. Cancer Epidemiol Biomarkers Prev 18:3263–304.
- Werley MS, Jerome AM, Oldham MJ. (2014). Toxicological evaluation of aerosols of a tobacco extract formulation and nicotine formulation in acute and short-term inhalation studies. Inhal Toxicol 26:207–21.
- WHO. (2004). Study Group on Tobacco Product Regulation. Recommendation 1: guiding principles for the development of tobacco product research and testing capacity and proposed protocols for the initiation of tobacco product testing. Available from: http://www.who.int/fctc/guidelines/ArtElevenWHOFour.pdf.
- Wu Q, Jiang D, Minor M, et al. (2014). Electronic cigarette liquid increases inflammation and virus infection in primary human airway epithelial cells. PLoS One 9:e108342.
- Yamin M, Holbrook EH, Gray ST, et al. (2008). Cigarette smoke combined with Toll-like receptor 3 signaling triggers exaggerated epithelial regulated upon activation, normal T-cell expressed and secreted/CCL5 expression in chronic rhinosinusitis. J Allergy Clin Immunol 122:1145–53.
- Zhu SH, Sun JY, Bonnevie E, et al. (2014). Four hundred and sixty brands of e-cigarettes and counting: implications for product regulation. Tob Control 23:iii3–9.