ABSTRACT
Chronic obstructive pulmonary disease (COPD) is a prevalent pulmonary disease characterized by a progressive decline in lung function. The identification of biomarkers capable of predicting the rate of lung function decline or capable of giving an early read on drug efficacy in clinical trials would be very useful. The aim of this study was to identify plasma biomarkers capable of accurately distinguishing patients with COPD from healthy controls. Eighty-nine plasma markers in 40 COPD patients and 20 healthy smoker controls were analyzed. The COPD patients were divided into two subgroups, rapid and slow decliners based on their rate of lung function decline measured over 15 years. Univariate analysis revealed that 25 plasma markers were statistically different between rapid decliners and controls, 4 markers were different between slow decliners and controls, and 10 markers were different between rapid and slow decliners (p < 0.05). Multivariate analysis led to the identification of groups of plasma markers capable of distinguishing rapid decliners from controls (signature 1), slow decliners from controls (signature 2) and rapid from slow decliners (signature 3) with over 90%% classification accuracy. Importantly, signature 1 was shown to be longitudinally stable using plasma samples taken a year later from a subset of patients. This study describes a novel set of plasma markers differentiating slow from rapid decline of lung function in COPD. If validated in distinct and larger cohorts, the signatures identified will have important implications in both disease diagnosis, as well as the clinical evaluation of new therapies.
INTRODUCTION
Chronic obstructive pulmonary disease (COPD) is defined by a progressive and irreversible airflow limitation caused by an abnormal inflammatory reaction to the inhalation of particles such as cigarette smoke (for a review see (Citation1)). It is currently the fourth leading cause of death in the United States (Citation2). The disease is defined by the FEV1/FVC ratio (forced expiratory volume in 1 second, FEV1; forced vital capacity, FVC) and is marked by a progressive decline in the FEV1 (Citation3). In normal non-smokers and some smokers, a slow but progressive decline in FEV1 is observed (≤ 20 ml/year). In about 15%% of smokers, lung function declines more rapidly than normal leading to an accelerated limitation in physical performance (poor exercise tolerance) and dyspnea (Citation3). The rate of decline between COPD patients varies greatly.
Because COPD progresses slowly over decades with significant limitations in lung function appearing at a relatively late stage of the disease, biomarkers capable of 1) assisting in early diagnosis of COPD, 2) predicting the rate of lung function decline and 3) monitoring drug efficacy in a timely manner in clinical trials would be of great value. COPD biomarkers detectable in plasma would be preferable since blood is more easily obtained and more reliable than lung secretions contained in bronchoalveolar lavage or induced sputum. Interestingly, there is growing evidence that both local and systemic inflammation is present in COPD (reviewed by (Citation4)). It is yet unclear whether COPD is a general defect in the regulation of inflammation that manifests in the lung irritated by smoke or if it is an uncontrolled inflammatory process that specifically takes place in the lung with systemic overflow. In either case, peripheral blood might represent a convenient and rich source of information on COPD progression.
The goal of this study was to evaluate if there is a single marker or a group of markers (signature) in the blood capable of distinguishing COPD patients from healthy smokers and differentiating COPD patients according to their rate of decline in lung function (slow versus rapid decliners). For this we analyzed 89 plasma markers in a well characterized cohort of COPD patients with detailed information on the rate of lung function decline accumulated over a period of 15 years. Although the analysis of individual plasma markers showed only small but significant differences between slow decliners, rapid decliners and healthy smoker controls, multivariate analysis revealed group of biomarkers capable of accurately distinguishing these 3 groups.
MATERIALS AND METHODS
Study subjects
Blood was collected from 40 COPD patients and 20 healthy controls. COPD patients and healthy controls were either current or ex-smokers. Note however that the smoking status was not a significant covariate when comparing the biomarkers from COPD groups to the healthy controls. The COPD patients were initially recruited in 1987-88 as part of the NIH funded National Lung Health Study 1 (LHS1), a 5-year longitudinal study of pulmonary function (Citation5). Patients recruited were 35–59 years old current smokers with FEV1 ranging between 50%% and 90%% of predicted, an FEV1/forced vital capacity (FVC) less than 0.7 and presenting the characteristic respiratory symptoms of COPD. Spirometry was performed every year for 5 years during LHS1.
Patients returned for study in LHS3 between the years of 1998 and 2002. At that time, follow-up spirometric testing was done. A third spirometry was obtained when the subjects were re-recruited for further COPD studies at the University of Utah between the years of 2003 and 2005. Importantly, patients were not experiencing an exacerbation at the time of spirometry. Based on the 15-years longitudinal information on lung function, COPD patients were distributed in two distinct groups: 26 rapid decliners (losing on average 40 ml FEV1 or more per year) and 14 slow decliners (losing on average less than 40 ml FEV1 per year). All COPD patients had no other major illness and were not using corticosteroids throughout the study. Healthy smoker/ex-smoker controls were recruited throughout the study and were matched by sex, age and ethnicity.
Blood collection and analysis
At the time that the patients returned for study between 2002 and 2005, plasma samples were obtained. Blood was collected in sodium citrate tubes and centrifuged at 1500 g for 15 minutes at 2–6°C. The top-most plasma portion was removed and recentrifuged under the same conditions. The resultant plasma sample was stored at -80°C until analysis at Rules-Based Medicine (Austin, TX) in their Human Antigen MAP platform. This platform was selected because to our knowledge it is the largest panel of plasma markers available.
Univariate analysis of individual markers
The significance of each marker between each group was assessed using Wilcoxon rank sum test. Exact False Positive Rate (FPR; p-value) was determined using the Shift algorithm (Citation6). In addition, the strength of the significance of each marker was further assessed using the more stringent False Discovery Rate (FDR; q-value) using the method proposed by Benjamini and Hockberg (Citation7). All analyses were carried out using R, version 2.4 (R: A Language and Environment for Statistical Computing, R Development Core Team, R Foundation for Statistical Computing, Vienna, Austria, 2005, ISBN 3-900051-07-0).
Multivariate analysis for the identification of signatures
Multi-analyte panels (signatures) that provide a good separation between two groups were determined using a forward selection procedure with Linear Discriminant analysis (Citation8). The predictive performance of these signatures was determined from the aggregate of 50 replications of 5-fold cross-validation. This entailed dividing up the data randomly into five subgroups, leaving each group out at a time, building a model on the remaining four subgroups, using this model to predict the disease status of each subject in the subgroup that was left out, and then aggregating the predictions of all the subgroups that were left out. This was repeated 50 times to generate an estimate of the overall accuracy along with the sensitivity and specificity of the signatures. These analyses were also carried out using R, version 2.4.
RESULTS
Study population
The clinical characteristics of the COPD patients and controls are reported in . The COPD sub-group of rapid decliners is defined by those who lost 40 ml or more of FEV1 on average per year over the last 15 years. This is double or more the normal decline of 20 ml FEV1 reported for healthy smokers and non-smokers (Citation3). In the case of the slow decliners, this annual loss of FEV1 on average was less than 40 ml. Patients and controls were of similar age and gender distribution. At the time of blood collection, rapid decliners collectively had 64.0 ± 11.4%% of the predicted normal FEV1 after losing on average 20.2 ± 9.0%% FEV1 over the last 15 years. Slow decliners collectively had 72.3 ± 14.6%% of the predicted normal FEV1 after losing on average only 2.4 ± 7.4%% FEV1 over the last 15 years.
Table 1. Baseline clinical characterisitics of COPD patients and controls
Univariate analysis
We first compared the average (median) between COPD rapid decliners and controls for each one of the 89 plasma markers. Many small but significant (p < 0.05) differences were observed between these two groups (). In terms of volcanic fold change, the strongest differences were seen with interleukin-4 (IL-4, 4.2-fold increase in rapid decliners), eotaxin (2.6-fold increase), interleukin-7 (IL-7, 2.2-fold increase) and haptoglobin (2.0-fold increase). A positive volcanic fold-change value represents an increase over healthy control, and a negative value represents decrease. The statistically most significant differences were observed for IL-4, monocyte chemoattractant protein (MCP-1), vascular cell adhesion molecule-1 (VCAM-1) and eotaxin with p-value (false positive rates) less than 0.1%% and q-value (false discovery rate) less than 1%% ( and ).
Figure 1. Examples of plasma markers present at significantly different levels between COPD rapid decliners and COPD slow decliners and/or healthy controls. Each point represents a unique subject. The top and bottom of the box in the box-plots represent the 75th (Q3) and 25th (Q1) percentiles respectively, and the line in the middle represents the median (Q2). The line from the top of the box extend out to the Q3 ++ 1.5**(Q3-Q1), and the line from the bottom of the box extend out to Q1 – 1.5**(Q3-Q1).
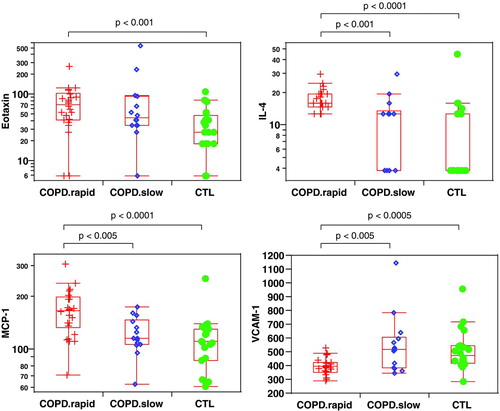
Table 2. Differences in plasma markers between COPD rapid decliners and healthy controls
In contrast, univariate comparison of slow decliners to controls revealed fewer and less significant differences (). Only 4 markers had a p-value below 0.05 and in all four cases the false discovery rate was substantially elevated (>50%%).
Table 3. Differences in plasma markers between COPD slow decliners and healthy controls
Finally, some interesting differences were seen when comparing slow and rapid decliners (). IL-4, IL-5, MCP-1, macrophage-derived chemokine (MDC) and tissue factor (TF) were present at significantly higher levels in rapid decliners compared to slow decliners (p < 0.05). Cancer antigen 19.9, immunoglobulin type A (IgA), insulin, macrophage inflammatory protein 1 alpha (MIP-1α) and VCAM-1 were present at significantly lower levels in rapid decliners compared to slow decliners (p < 0.05). Among these markers, IL-4, MCP-1 and VCAM-1 are more robust with the estimated false discovery rate < 10%% (i.e., q < 0.1).
Table 4. Differences in plasma markers between COPD rapid and slow decliners
Multivariate analysis
Since none of the plasma markers were capable on their own of adequately distinguishing COPD patients from controls, we performed a multivariate analysis of the data using the Linear Discriminate Analysis method (LDA). This method identified a group of plasma markers (signature 1) capable of distinguishing COPD rapid decliners from healthy controls ().
Figure 2. Multivariate analysis comparing COPD rapid decliners and healthy controls. This output from a linear discriminant analysis (LDA) is a two-dimensional representation using principal components of a six-marker signature for separating COPD rapid decliners from healthy control. LDA measures the distance from each point in the data set to each group's multivariate mean and classifies the point to the closest group. The distance measure used is the Mahalanobis distance, which takes into account the variance and covariance between the variables. Each multivariate mean is a labeled circle. The size of the circle corresponds to a 95%% confidence limit for the mean. Groups that are significantly different tend to have non-intersecting circles. Similar graphs are provided in and for the signatures that separate the COPD slow decliners from healthy control and the COPD rapid decliners from COPD slow decliners, respectively.
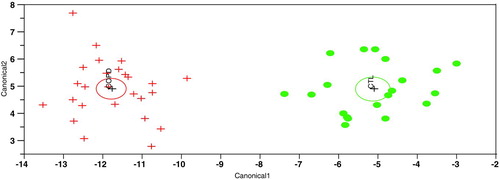
Signature 1 is composed of the following 6 markers: apolipoprotein H, CD40, haptoglobin, IL-8, MCP-1 and tumor necrosis factor receptor II (TNFRII). Univariate analysis of these markers revealed significant differences (p < 0.05, ) except for CD40 (1.15-fold, p < 0.5). Fifty replicates of 5-fold cross-validation revealed that signature 1 can correctly identify that a plasma sample is from a COPD rapid decliner in 93%% of the cases (sensitivity) and that a plasma sample is from a healthy subject in 86%% of the cases (specificity) for an overall accuracy to distinguish the two groups of 90%%. We next wanted to verify the longitudinal stability of signature 1. Blood samples from 9 of the 26 COPD rapid decliners and 5 of the 20 healthy controls were collected approximately 1 year after the initial samples used to identify signature 1. In the samples collected 1 year later, this signature correctly identified all 9 COPD rapid decliners and 4 out of 5 healthy controls for an overall accuracy of 93%% ().
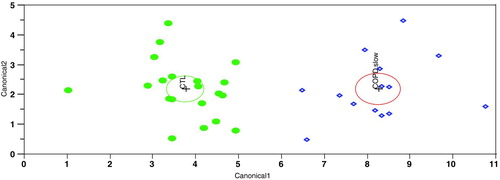
Using the LDA method, we also identified a second group of plasma markers (signature 2) capable of accurately distinguishing COPD slow decliners from healthy controls (). Signature 2 is composed of the following 10 markers: apolipoprotein CIII, CD40, granulocyte-macrophage colony stimulating factor (GM-CSF), haptoglobin, IgA, MIP-1α, Tissue factor (TF) and tumor necrosis factor-alpha (TNF-α). Fifty replicates of 5-fold cross-validation revealed that signature 2 has 91%% sensitivity and 96%% specificity for an overall accuracy of distinguishing slow decliners from controls of 94%% ().
Table 5. Summary of signatures identified in multivariate analysis
Figure 3. Multivariate analysis comparing COPD slow decliners and healthy controls.
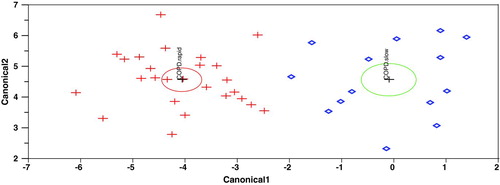
Finally, we identified a third group of plasma markers (signature 3) capable of accurately distinguishing COPD rapid from slow decliners (). Signature 3 is composed of the following 9 markers: alpha-1 antitrypsin, C-reactive protein (CRP), fibrinogen, GM-CSF, IL-4, MDC, Tissue Factor (TF), TNFRII and VCAM-1. Fifty replicates of 5-fold cross-validation revealed that signature 3 can correctly identify that a plasma sample is from a COPD rapid decliner in 95%% of the case and that a plasma sample is from a COPD slow decliner in 86%% of the case for an overall accuracy of distinguishing the two groups of 92%% ().
Figure 4. Multivariate analysis comparing COPD rapid and slow decliners.
DISCUSSION
In this study, we identified plasma proteins whose levels are statistically different in patients with COPD compared to healthy controls. Out of the 89 plasma markers evaluated, 25 were statistically different between rapid decliners and controls (p < 0.05), while only 4 markers were different between slow decliners and controls (p < 0.05). These univariate analyses revealed that there are actually more statistically significant differences between rapid and slow decliners (Citation10 markers with p < 0.05) than there are between slow decliners and controls (only 4 markers with p < 0.05). To our knowledge this is the first study providing such an extensive serological differentiation between slow and rapid manifestations of this disease.
Some of the markers showing differences between rapid decliners and controls have been previously reported to be modulated in the blood of non-exacerbated COPD patients such as α1-antitrypsin (Citation9), eotaxin (Citation9, 10), fibrinogen (Citation11), IL-4 (Citation12), IL-8, MCP-1 and VEGF (Citation13). Out of the 25 markers significantly modulated in rapid decliners compared to controls, only two of them are decreased in rapid decliners: soluble TNFRII and the soluble form of VCAM-1. Interestingly, these are both anti-inflammatory proteins. sTNFRII traps the pro-inflammatory protein TNF-α (Citation14), while sVCAM-1 interferes with the adhesion of VCAM-1-bearing leukocytes to endothelial cells expressing the VCAM-1 ligand, α4β1 integrin (Citation15).
In the panel of markers significantly increased in the rapid decliners over controls, it is interesting to note the presence of chemoattractants such as GM-CSF, IL-8 and MCP-1, known to modulate the activity of neutrophils and macrophages, two cell types implicated in COPD (Citation16). It is even more interesting to note in that list the presence of several mediators associated to Th2/Tc2 phenotype such as IL-4, IL-5, IL-10, IL-13 and eotaxin. This is in agreement with a recent study reporting that T-lymphocytes present in the lung of COPD patients produce significantly more IL-4, IL-10 and IL-13 than T-lymphocytes from healthy smokers (Citation17). This observation supports the previously stated hypothesis suggesting an overlap between asthma and COPD in more severe form of the diseases (Citation18).
COPD, like many other chronic diseases, is a highly heterogeneous disease with phenotypic expressions influenced by genetic and environmental factors. This leads to the expected intra-group variability observed for each plasma markers when performing univariate analysis. Similar variability after univariate analysis of markers in serum from COPD and controls was recently described by another group (Citation13). In this context, each individual plasma marker has limited potential to accurately distinguish samples from healthy individuals and patients with either slow or rapid forms of COPD. The ability of a combination of multiple markers to distinguish these samples was explored. Multivariate analysis led to the identification of a 6-marker signature capable of distinguishing rapid decliners from healthy controls with 90%% accuracy.
Importantly, similar accuracy was obtained with these same 6 markers when analyzing samples obtained from the same cohort approximately 1 year later, suggesting that the signature is longitudinally stable and thus of potential clinical utility. The signature is composed of chemoattractants for neutrophils and monocytes such as IL-8 and MCP-1 with putative roles in the inflammation that characterizes COPD (Citation16), the circulating soluble form of a surface glycoprotein named CD40 previously reported to be elevated in patients with chronic renal failure (Citation19), chronic liver disease (Citation20), Alzheimer's disease (Citation21) and systemic sclerosis (Citation22), haptoglobin, an acute phase protein with antioxidant and anti-inflammatory properties (Citation23), the anti-inflammatory sTNFRII and apolipoprotein H, a plasma glycoprotein implicated in a variety of physiological pathways including blood coagulation, haemostasis and the production of anti-phospholipid antibodies (Citation24).
sCD40 and haptoglobin are also part of a group of 8 plasma markers capable of distinguishing slow decliners from controls with 94%% accuracy. This signature also includes 3 other cytokines/chemokines: GM-CSF, a regulator of neutrophil survival and activity found at elevated levels in bronchoalveolar fluid from stable and exacerbated COPD patients (Citation25), MIP1-α, a chemoattractant for neutrophils and monocytes (Citation16), and TNF-α, a cytokine implicated in COPD (Citation16) and found at higher levels in the blood of stable COPD patients (Citation11). The slow decliners signature is completed by apolipoprotein CIII, a modulator of lipoprotein metabolism (Citation26), IgA, a subtype of circulating immunoglobulin that has been previously associated with anti-phospholipid antibodies (Citation27) and soluble tissue factor (sTF), a coagulating factor that has been found to be elevated in patients with anti-phospholipid syndrome characterized by the presence of anti-phospholipid antibodies and thromboembolic complications (Citation28). In light of the presence of IgA and sTF in the slow decliners’ signature, it would be interesting to determine if their expression correlates with the presence of circulating anti-phospholipid antibodies in a subset of COPD patients. Interestingly, a link between COPD and autoimmunity has previously been proposed (Citation28).
The rapid versus slow signature is composed of 9 plasma markers. Three of those markers, α1-antitrypsin, CRP and fibrinogen have been extensively reported to be modulated in COPD patients (Citation11,Citation29). Three other markers are cytokines/chemokines: GM-CSF, IL-4 and MDC. GM-CSF is also included in the slow signature and has been discussed above. IL-4 is the most significantly increased marker in rapid decliners compared to slow decliners and controls in the univariate analysis. MDC (CCL22) has been shown to be up-regulated by IL-4 and plays an important role in the recruitment of Th2 cells to inflammatory sites (Citation11,Citation30). The signature is completed with sTF, sTNFRII and sVCAM-1 described here.
Attempts to identify a single signature that distinguishes controls, slow and rapid decliners did not yield accuracies above 82%%. The need for distinct signatures to accurately distinguish rapid or slow decliners from controls and the fact that a signature can be found that accurately distinguishes rapid from slow decliners suggests the existence of fundamental, but complex, biochemical differences linked to the rate of lung function decline in COPD.
CONCLUSIONS
This study describes a novel set of plasma markers differentiating slow from rapid declining form of COPD. It will be crucial to validate these observations in distinct and larger cohorts. If validated, these signatures would represent useful tools to help in the diagnosis of this disease. They would also be useful in predicting the rate of lung function. These signatures may also prove useful as early biomarkers of drug efficacy and for patient recruitment in clinical trial.
Declaration of interests
The authors have no conflicts of interest to disclose. The authors alone are responsible for the content and writing of the paper.
ACKNOWLEDGMENTS
The authors would like to acknowledge the invaluable contributions made by Michael S. Paul, Ph.D. and Alex Lindell from LineaGen, Inc., 423 Wakara Way, Suite 200, Salt Lake City, Utah, 84108 to this study. This work was also supported in part by a grant from the National Institutes of Health, NIDA/NHLBI P01-HL72903. Informed consent from subjects was obtained under the University of IRB protocol ##8969.
REFERENCES
- Fabbri LM, Luppi F, Beghe B, Rabe KF. Update in chronic obstructive pulmonary disease. Am J Respir Crit Care Med 2006;173:1056–1065.
- Heffner JE. Chronic obstructive pulmonary disease: on an exponential curve of progress. Respir Care 2002;47:586–607.
- Rennard SI. COPD: overview of definitions, epidemiology, and factors influencing its development. Chest 1998;113:235S–241S.
- Wouters EF. Local and systemic inflammation in chronic obstructive pulmonary disease. Proc Am Thorac Soc 2005;2:26–33.
- Owens GR. Public screening for lung disease: experience with the NIH Lung Health Study. Am J Med 1991;91:37S–40S.
- Streitberg B, Rohmel J. Exact distributions for permutations and rank tests: an introduction to some recently published algorithms. Statistical Software Newsletter 1986;12:10–17.
- Benjamini Y, Hockberg Y. The adaptive control of the false discovery rate in multiple hypotheses testing with independent statistics. J Behav Educ Statist 2000;25:60–83.
- Venables WN, Ripley BD. Modern Applied Statisitics, Fourth Edition. Springer, New York.
- Aldonyte R, Eriksson S, Piitulainen E, Wallmark A, Janciauskiene S. Analysis of systemic biomarkers in COPD patients. COPD 2004;1:155–164.
- Jahnz-Rozyk K, Chcialowski A, Pirozynska E, Rogalewska A. Expression of adhesion molecules LFA-1 (CD11a and ICAM-1 (CD54) on lymphocytes and chemokines IL-8 and MCP-1 concentrations in bronchoalveolar lavage of patients with asthma or chronic obstructive pulmonary disease. Pol Merkur Lekarski 2000;9:649–652.
- Gan WQ, Man SF, Senthilselvan A, Sin DD. Association between chronic obstructive pulmonary disease and systemic inflammation: a systematic review and a meta-analysis. Thorax 2004;59:574–580.
- Zhang N, Xu Y, Zhang Z, Liu J, Fang H, Ni W. Effects of theophylline on plasma levels of interleukin-4, cyclic nucleotides and pulmonary functions in patients with chronic obstructive pulmonary disease. J Tongji Med Univ 1999;19:15–19.
- Pinto-Plata V, Toso J, Lee K, Parks D, Bilello J, Mullerova H, De Souza MM, Vessey R, Celli B. Profiling Serum Biomarkers in Patients with COPD: Associations with Clinical Parameters. Thorax 2007;62:595–601.
- Carpentier I, Coornaert B, Beyaert R. Function and regulation of tumor necrosis factor type 2. Curr Med Chem 2004;11:2205–2212.
- Foster CA. VCAM-1/alpha 4-integrin adhesion pathway: therapeutic target for allergic inflammatory disorders. J Allergy Clin Immunol 1996;98:S270–S277.
- Barnes PJ. Mediators of chronic obstructive pulmonary disease. Pharmacol Rev 2004;56:515–548.
- Barcelo B, Pons J, Fuster A, Sauleda J, Noguera A, Ferrer JM, Agusti AG. Intracellular cytokine profile of T lymphocytes in patients with chronic obstructive pulmonary disease. Clin Exp Immunol 2006;145:474–479.
- Jeffery PK. Lymphocytes, chronic bronchitis and chronic obstructive pulmonary disease. Novartis Foundation Symposium 2001;234:149–168.
- Schwabe RF, Engelmann H, Hess S, Fricke H. Soluble CD40 in the serum of healthy donors, patients with chronic renal failure, haemodialysis and chronic ambulatory peritoneal dialysis (CAPD) patients. Clin Exp Immunol 1999;117:153–158.
- Schmilovitz-Weiss H, Belinki A, Pappo O, Sulkes J, Melzer E, Kaganovski E, et al. Role of circulating soluble CD40 as an apoptotic marker in liver disease. Apoptosis 2004;9:205–210.
- Mocali A, Cedrola S, Della MN, Bontempelli M, Mitidieri VA, Bavazzano A, Comolli R, Paoletti F, La Porta CA. Increased plasma levels of soluble CD40, together with the decrease of TGF beta 1, as possible differential markers of Alzheimer disease. Exp Gerontol 2004;39:1555–1561.
- Komura K, Fujimoto M, Matsushita T, Yanaba K, Kodera M, Kawasuji A, Hasegawa M, Takehara K, Sato S. Increased serum soluble CD40 levels in patients with systemic sclerosis. J Rheumatol 2007;34:353–358.
- Zvi B, Levy AP. Haptoglobin phenotypes, which one is better and when?? Clin Lab 2006;52:29–35.
- McNeil HP, Simpson RJ, Chesterman CN, Krilis SA. Anti-phospholipid antibodies are directed against a complex antigen that includes a lipid-binding inhibitor of coagulation: beta 2-glycoprotein I (apolipoprotein H). Proc Natl Acad Sci USA 1990;87:4120–4124.
- Balbi B, Bason C, Balleari E, Fiasella F, Pesci A, Ghio R, Fabiano S. Increased bronchoalveolar granulocytes and granulocyte/macrophage colony-stimulating factor during exacerbations of chronic bronchitis. Eur Respir J 1997;10:846–850.
- Shachter NS. Apolipoproteins C-I and C-III as important modulators of lipoprotein metabolism. Curr Opin Lipidol 2001;12:297–304.
- Staub HL, Franck M, Ranzolin A, Norman GL, Iverson GM, von Muhlen CA. IgA antibodies to beta2-glycoprotein I and atherosclerosis. Autoimmun Rev 2006 ;6:104–106.
- Cosio BG, Agusti A. Autoimmunity in chronic obstructive pulmonary disease (COPD). Arch Bronconeumol 2005;41:10–14.
- Ranes J, Stoller JK. A review of alpha-1 antitrypsin deficiency. Semin Respir Crit Care Med 2005;26:154–166.
- Yamashita U, Kuroda E. Regulation of macrophage-derived chemokine (MDC, CCL22) production. Crit Rev Immunol 2002;22:105–114.