Abstract
The aim of this study is to evaluate the relationship between lung function and kurtosis or skewness of lung density histograms on computed tomography (CT) in smokers. Forty-six smokers (age range 46−81 years), enrolled in the Lung Tissue Research Consortium, underwent pulmonary function tests (PFT) and chest CT at full inspiration and full expiration. On both inspiratory and expiratory scans, kurtosis and skewness of the density histograms were automatically measured by open-source software. Correlations between CT measurements and lung function were evaluated by the linear regression analysis. Although no significant correlations were found between inspiratory kurtosis or skewness and PFT results, expiratory kurtosis significantly correlated with the following: the percentage of predicted value of forced expiratory volume in the first second (FEV1), the ratio of FEV1 to forced vital capacity (FVC), and the ratio of residual volume (RV) to total lung capacity (TLC) (FEV1%predicted, R = −0.581, p < 0.001; FEV1/FVC, R = −0.612, p < 0.001; RV/TLC, R = 0.613, p < 0.001, respectively). Similarly, expiratory skewness showed significant correlations with PFT results (FEV1%predicted, R = −0.584, p < 0.001; FEV1/FVC, R = −0.619, p < 0.001; RV/TLC, R = 0.585, p < 0.001, respectively). Also, the expiratory/inspiratory (E/I) ratios of kurtosis and skewness significantly correlated with FEV1%predicted (p < 0.001), FEV1/FVC (p < 0.001), RV/TLC (p < 0.001), and the percentage of predicted value of diffusing capacity for carbon monoxide (kurtosis E/I ratio, p = 0.001; skewness E/I ratio, p = 0.03, respectively). We conclude therefore that expiratory values and the E/I ratios of kurtosis and skewness of CT densitometry reflect airflow limitation and air-trapping. Higher kurtosis or skewness on expiratory CT scan indicates more severe conditions in smokers.
INTRODUCTION
Kurtosis and skewness, which represent the distortion or disparity deviation of a histogram when compared with a normal distribution, have been previously studied in pulmonary diseases using lung density histograms obtained by computed tomography (CT). Almost all published information on kurtosis or skewness of CT densitometry in the lung has focused on interstitial lung disease (ILD), where lower kurtosis and skewness are observed in patients with more progressed disease (fibrosis) and more compromised lung function (Citation1–7).
Studies on kurtosis and skewness of the density histogram in subjects with chronic obstructive pulmonary disease (COPD) are much more limited (Citation8, 9). Although several quantitative CT indices, including the percentage of low attenuation area (LAA%) and mean lung density (MLD), are obtained from the CT density histogram and have proven to be significantly associated with lung function (Citation10–18), it remains unclear if kurtosis and skewness of the same density histogram correlate with lung function in individuals with COPD. Furthermore, no previous paper has shown kurtosis and skewness on both inspiratory and expiratory CT scans.
Recently, Matsuoka and colleagues reported that lower kurtosis and skewness of CT densitometry correlate with greater hypoxemia in patients with pulmonary embolism (PE) (Citation19). In both ILD and PE, lower kurtosis and skewness, which suggest heterogeneity of the lung density on CT scans, indicate deteriorated lung function. On the other hand, although no published information is available on quantitative assessment of densitometric heterogeneity in COPD patients, it has been acknowledged that expiratory CT scans of normal subjects often demonstrate inhomogeneous lung density, in particular in the gravity-dependent areas (Citation20). Based upon these observations, it would be of interest to examine whether objective measurements of kurtosis and skewness of the CT lung histogram, which imply heterogeneity of the lung field, are positively or negatively related to airflow limitation or air-trapping in smokers, including COPD subjects. Thus, the aim of this study is to evaluate the relationships between pulmonary function tests (PFT) and kurtosis or skewness of CT densitometry in smokers.
MATERIALS AND METHODS
This study was approved by the Institutional Review Board at our institution. The manuscript was reviewed and approved according to the procedures outlined by the Lung Tissue Research Consortium. Further information on the Consortium is available on the website [www.ltrcpublic.com]. The subjects’ data utilized in this study were previously analyzed with a different objective for other research (Citation21).
Subjects
CT scans and clinical information for 184 subjects were collected from March 2005 to February 2008, and were provided for this study by the Consortium. All subjects gave written informed consent. Exclusion criteria included the following: (i) usage of CT scanners made by different manufacturers (n = 64), (ii) CT scans with contrast medium or different slice thickness (n = 29), (iii) different tube current or voltage (n = 12), (iv) no available expiratory CT scan (n = 11), (v) no history of cigarette smoking (n = 1), (vi) previous history of lung resection (n = 3), (vii) presence of pneumothorax, lobar atelectasis, large bullae (>3 cm in diameter), severe fibrosis, or a mass (>3 cm in diameter) (n = 18). According to these criteria, a total of 46 smokers (20 females and 26 males; age range 46−81 years) were eventually selected and analyzed in this study. All subjects were current or former smokers (mean pack-years, 50.8 ± 38.4; current smokers, n = 4; former smokers, n = 42; respectively). summarizes the characteristics of the subjects.
Table 1 Clinical characteristics of 46 subjects
Pulmonary function tests
All 46 subjects performed pre-bronchodilator spirometry, including forced expiratory volume in the first second (FEV1) and forced vital capacity (FVC), according to American Thoracic Society standards as described previously (Citation22). Diffusing capacity for carbon monoxide (DLco) was measured by the single breath method. These values were expressed as the percentages of predicted values. Residual volume (RV) and total lung capacity (TLC) were measured by plethysmography (Citation23). summarizes the PFT results.
Except for 6 subjects who did not show any COPD symptoms or abnormal results at pre-bronchodilator spirometry, 40 subjects who were clinically diagnosed with COPD underwent post-bronchodilator spirometry. According to the Global Initiative for Chronic Obstructive Lung Disease (GOLD) staging (Citation24), 46 subjects were eventually classified as follows: smokers with normal lung function, n = 6; GOLD stage 1, n = 7; stage 2, n = 19; stage 3, n = 9; and stage 4, n = 5. Due to the small number of subjects, they were eventually categorized into three groups in advance to statistical analyses (Normal, stage 1 or 2, and stage 3 or 4).
Thin-section CT
All subjects were scanned with 16-detector CT (LightSpeed 16 or LightSpeed Pro16, GE Medical Systems, Milwaukee, WI, USA) at full inspiration and full expiration, without receiving a contrast medium. Prior to CT scanning, subjects were coached to hold their breath at full inspiration and full expiration. According to the scanning protocol of the Consortium, images were obtained using 140 kV and 300 mA. The scanning field of view (FOV) ranged from 28 to 44 cm, which was based upon the subject's body habitus. Exposure time was 0.53 s and the matrix size was 512 × 512 pixels. Images were reconstructed with a 1.25 mm-slice thickness (with 0.625 mm-overlapping), using the “Bone” algorithm.
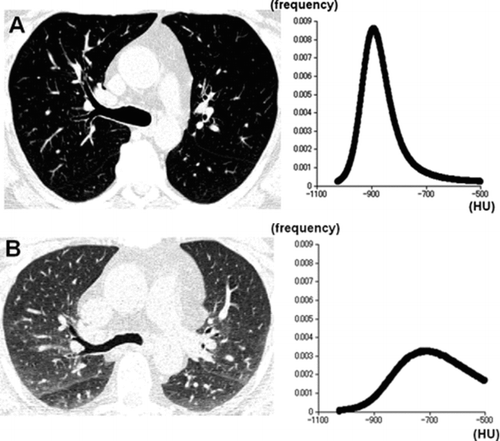
Figure 1 A 60-year-old male smoker with normal lung function (FEV1%predicted = 86%). Inspiratory (A) and expiratory (B) CT images and the density histograms are demonstrated. On the expiratory CT image (B), lung density increased particularly in dorsal parts of the bilateral lungs, resulting in heterogeneous lung density. Although inspiratory kurtosis and skewness are measured as 8.6 and 2.1, expiratory kurtosis and skewness decrease to 2.6 and 0.3. Note that the density histograms are obtained from all axial CT images that include the lung parenchyma, and not by a single image.
Measurements of CT indices
The analysis for kurtosis, skewness, and other CT indices was performed using free open-source software (Airway Inspector, Brigham and Women's Hospital, Boston, MA, USA) [www.airwayinspector.org], as described previously (Citation21, Citation25, Citation26). The software automatically measured kurtosis, skewness, LAA% [< −950 Hounsfield unit (HU)], and MLD. In brief, the software (i) segmented the lung parenchyma (−1024 to −500 HU) from the chest wall and the hilum, (ii) created a density histogram for the entire lung parenchyma, and (iii) measured kurtosis and skewness of the histogram. The trachea and the major bronchi were not included in the measured lung parenchyma. Our previous study already reported LAA% and MLD measures of the 46 subjects analyzed in this study (Citation21).
Kurtosis, which demonstrates how sharply peaked a histogram is, is given by the following equation:
where ni is the number of pixels at lung attenuation value xi, x is the mean value of lung attenuation, s is the standard deviation (SD), and N is the total number of pixels.
Skewness, indicating the degree of asymmetry of a histogram, is given by the following equation:
Using these equations, a normal distribution has a kurtosis of three and a skewness of zero. The expiratory/inspiratory (E/I) ratios of kurtosis and skewness were calculated.
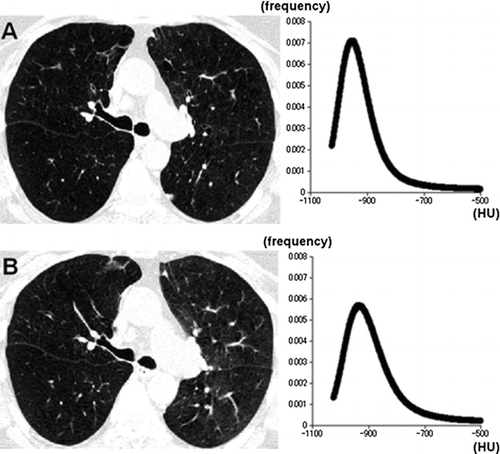
Figure 2 A 62-year-old man with chronic obstructive pulmonary disease (GOLD stage 4, FEV1%predicted = 21%). CT images and the density histograms at full inspiration (A) and expiration (B) are demonstrated. The changes in kurtosis and skewness are relatively small, suggesting more homogeneous lung density on the expiratory image (inspiratory scan, kurtosis = 10.6, skewness = 2.4; expiratory scan, kurtosis = 7.5, skewness = 1.9, respectively).
and show examples of the analysis performed by the software.
Table 2 CT measurements and correlations with lung function
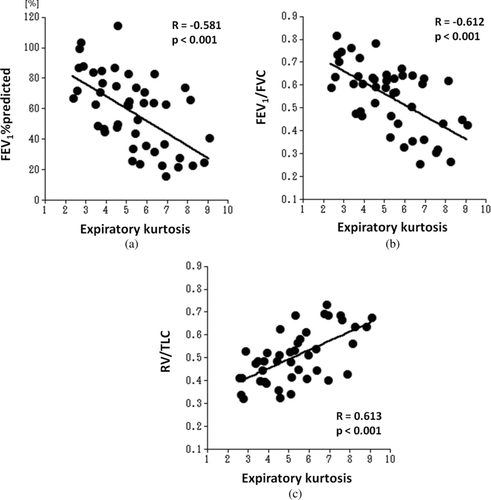
Figure 3 Correlations between expiratory kurtosis and lung function. Significant correlations (p < 0.001) are observed between expiratory kurtosis and pulmonary function tests (FEV1%predicted, R = −0.581; FEV1/FVC, R = −0.612; RV/TLC, R = 0.613, respectively).
Statistical analysis
All statistical analyses were performed using JMP 7.0 software (SAS Institute, Cary, NC, USA). Data were expressed as mean ± SD. The linear regression analysis was used to estimate the relationships between CT measures and PFT values, including pre-bronchodilator FEV1%predicted, pre-bronchodilator FEV1/FVC, RV/TLC, and DLco%predicted. The significance of the differences in expiratory CT values between GOLD- based subject groups was evaluated by one-way analysis of variance (ANOVA), followed by the Bonferroni test for individual comparisons. P values less than 0.05 were considered statistically significant.
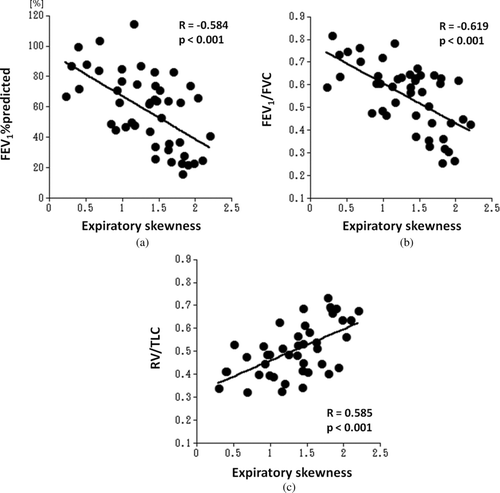
Figure 4 Correlations between expiratory skewness and lung function. Similar to expiratory kurtosis, expiratory skewness shows significant correlations (p < 0.001) with pulmonary functions tests (FEV1%predicted, R = −0.584; FEV1/FVC, R = −0.619; RV/TLC, R = 0.585, respectively).
RESULTS
CT measurements and correlations with lung function
demonstrates CT measurements and their correlations with PFT values. The mean kurtosis decreased from 7.9 ± 2.2 at inspiration to 5.2 ± 1.8 at expiration. Also, the mean skewness decreased from inspiration to expiration (1.9 ± 0.4 at inspiration and 1.3 ± 0.5 at end-expiration).
Although inspiratory kurtosis or skewness did not show significant correlations with FEV1%predicted, FEV1/FVC, RV/TLC, or DLco%predicted, expiratory kurtosis demonstrated significant correlations (p < 0.001) with FEV1%predicted, FEV1/FVC, and RV/TLC (; FEV1%predicted, R = −0.581; FEV1/FVC, R = −0.612; RV/TLC, R = 0.613, respectively). Similarly, expiratory skewness showed significant correlations (p < 0.001) with PFT results (; FEV1%predicted, R = −0.584; FEV1/FVC, R = −0.619; RV/TLC, R = 0.585, respectively). No significant correlations were found between expiratory kurtosis or expiratory skewness and DLco% predicted.
Further, the E/I ratios of kurtosis and skewness demonstrated significant correlations with FEV1%predicted, FEV1/FVC, RV/TLC, and DLco%predicted (, kurtosis E/I ratio, FEV1%predicted, R = −0.546, p < 0.001; FEV1/FVC, R = −0.572, p < 0.001; RV/TLC, R = 0.556, p < 0.001; DLco%predicted, R = −0.469, p = 0.001; skewness E/I ratio, FEV1%predicted, R = −0.585, p < 0.001; FEV1/FVC, R = −0.612, p < 0.001; RV/TLC, R = 0.580, p < 0.001; DLco%predicted, R = −0.328, p = 0.03, respectively).
Expiratory kurtosis or skewness and the GOLD stages
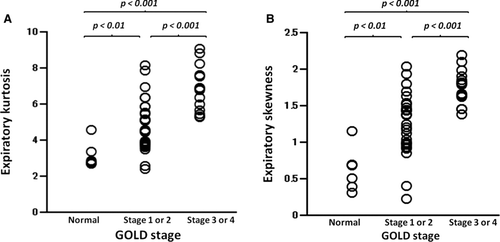
After it was confirmed by ANOVA that at least a significant difference was included in each multiple comparison model (p < 0.001), the differences in expiratory kurtosis and skewness among all pairs were evaluated. Significant differences in expiratory kurtosis or skewness were observed among all combinations; the group with severe COPD showed higher expiratory kurtosis or skewness ().
Figure 5 Expiratory kurtosis or skewness in the subject groups according to the Global Initiative for Chronic Obstructive Lung Disease (GOLD) staging. Significant differences in expiratory kurtosis (A) and skewness (B) are observed in all pairs of subject groups. P values are obtained using the Bonferroni test.
DISCUSSION
In the current study, we found that expiratory kurtosis and skewness of CT density histograms correlate with lung function in smokers. Higher kurtosis and skewness on expiratory scans, which suggest a higher peakedness and more right-skewed distribution of the density histogram, indicate more severe expiratory airflow limitation and air-trapping in smokers.
In COPD, multiple papers have described that several indices, such as LAA% and MLD obtained from the same histogram, can predict lung function (Citation10–18). However, except for a texture-based adaptive multiple feature method (AMFM) (Citation8, 9), no published information is available on kurtosis or skewness of CT densitometry in subjects with COPD. In the current study, we first reported that kurtosis and skewness decrease on expiratory scans, particularly in smokers with normal lung function or mild COPD subjects. In severe COPD subjects, in contrast, kurtosis and skewness remain high on expiratory scans.
These differences lead to significant correlations between expiratory kurtosis or skewness and PFT values, including FEV1%predicted, FEV1/FVC, and RV/TLC. Compared with our previous study analyzing the same 46 subjects using LAA% and MLD (Citation21), the correlations of expiratory kurtosis or skewness with FEV1%predicted or FEV1/FVC are comparable to those of LAA% or MLD. Further, expiratory kurtosis shows higher correlation coefficient with RV/TLC than LAA% and MLD. We believe, therefore, that kurtosis and skewness of the density histogram can be additional CT parameters in analyzing expiratory CT scans in subjects with COPD.
Although it remains difficult to speculate on the exact reasons for the decreases in kurtosis and skewness by expiration, the following explanations are plausible. The decrease in skewness can be partially explained by the increase in MLD, which is directly correlated with decrease in lung volume on expiratory scans (Citation21). As MLD increases with expiration, the right-skewed distribution (large skewness) shifts to higher lung densities, resulting in a decrease in skewness. The decrease in kurtosis, however, is more difficult to explain. In subjects with normal lung function, as is shown in , the height of the peak (frequency of the most frequent CT value) of the density histogram tends to decrease significantly on expiratory CT scans. A possible explanation for the phenomenon would be the increased heterogeneity of the lung density.
As is illustrated in , on expiratory scans, inhomogeneous, patchy increases in CT density can occur in healthy subjects, particularly in the dorsal (gravity-dependent) lung field. This phenomenon, which has been reported as airtrapping-like appearances in asymptomatic healthy subjects (Citation20), would contribute to the widening of the distribution, which may result in the decrease of kurtosis. To reiterate, it would be predicted that the distribution of air or collapsibility of the pulmonary structures are more heterogeneous and would be influenced by gravity-dependence in the well-exhaled lung, resulting in inhomogeneous CT density of the lungs on expiratory scans in normal subjects. In this situation, the peak of CT density histogram does not move parallel to the right nor maintain its height from inspiratory to expiratory scans. Statistically, however, a distribution with broad edges does not always demonstrate higher kurtosis, and therefore these explanations are speculative.
Measuring kurtosis and skewness of CT density histograms has been mainly the subject for detailed study in ILD (Citation1–7). In these studies, lower kurtosis and skewness is found in those subjects with the greatest functional impairment. Although the direct relationship between the degree of fibrosis in the lung and decrease in kurtosis or skewness of CT density histograms has not been pathologically investigated, it is generally accepted that decreases in kurtosis or skewness reflect fibrotic changes in the lung caused by ILD (Citation1–6, Citation27). Decreases in kurtosis or skewness have also been reported in patients with PE and cystic fibrosis (Citation19, Citation28), where lower kurtosis or skewness is correlated with severe hypoxemia in PE and with severe airflow limitation in cystic fibrosis. In contrast to these diseases, our observations indicate that lower values of kurtosis or skewness on expiratory scans reflect better lung function in subjects with COPD, which would be of interest for future studies of density histograms in various pulmonary diseases.
Although measurements of kurtosis and skewness did not show a clear correlative advantage to more standard densitometric measures of emphysema when predicting lung function, we think that these measures may be applied to future CT studies for other pulmonary disorders. For example, it has been acknowledged that partial air-trapping (mosaic pattern) is frequently observed on CT scans in subjects with bronchiolitis obliterans (BO) after stem cell transplantation, and visual scores of air-trapping correlate with lung function (Citation29–32). It would be of interest whether those air-trapping scores are expressed by kurtosis or skewness of the density histogram.
We recognize some important limitations in this study. First, the number of the subjects in the current study was relatively small. Compared with previous studies (Citation11, Citation14), the 46 subjects analyzed in this study demonstrated higher correlation coefficients between several CT indices and airflow obstruction (Citation21). Considering the fact that airflow obstruction is also caused by airway abnormalities, the small number of subjects might have amplified those observations.
Second, on the CT densitometry, the lower threshold of −500HU for determining the lung parenchyma needs further evaluation. Although several previous papers have used the same threshold both for inspiratory and expiratory CT scans in COPD (Citation11, Citation16, Citation17), a higher threshold has also been recommended for expiratory scans (Citation10). Although we think the changes in the upper threshold would limit the study to a minor degree, future investigation is needed to determine an optimal upper threshold of the CT densitometry.
Third, measurements of kurtosis and skewness did not show a clear correlative advantage to more standard densitometric measures when predicting lung function (Citation21). Currently, measurements of kurtosis and skewness seem to act simply as additive values in CT studies for COPD. However, to evaluate inhomogeneous “mosaic” patterns in various lung diseases, we believe that measurements of kurtosis and skewness on density histograms have potential for future CT studies.
Fourth, according to the scanning protocol determined by the Lung Tissue Research Consortium, a relatively high dose of radiation and a sharp reconstruction kernel were used in this study. Since it has been acknowledged that radiation dosage does not influence kurtosis or skewness measures severely (Citation7), it is recommended to apply a low-dose technique to future studies for CT-based lung analyses.
Fifth, since six smokers with normal lung function did not undergo post-bronchodilator spirometry, we utilized the data of pre-bronchodilator spirometry for assessing airflow limitation. Because the GOLD staging is based on post-bronchodilator spirometry, it is recommended to evaluate the correlations of kurtosis or skewness with results of post-bronchodilator spirometry for future COPD studies.
Sixth, ILD sometimes coexists with emphysema in COPD subjects, known as smoking related ILD. Although we excluded severe fibrosis subjects from this study, it can be predicted that slight fibrosis such as smoking-related ILD would have coexisted in the subjects we analyzed, resulting in amplified lower kurtosis or skewness.
In summary, we first reported that expiratory kurtosis and skewness of CT densitometry correlate airflow limitation and air-trapping in COPD. Furthermore, the E/I ratios of kurtosis and skewness are also correlated with lung function. Although it has been reported that lower kurtosis or skewness indicates deteriorated lung function in ILD or PE, higher kurtosis or skewness on expiratory CT scan suggests more severe airflow limitation and air-trapping in COPD.
REFERENCES
- Hartley PG, Galvin JR, Hunninghake GW, Merchant JA, Yagla SJ, Speakman SB, Schwartz DA. High-resolution CT-derived measures of lung density are valid indexes of interstitial lung disease. J Appl Physiol 1994; 76:271–277.
- Best AC, Lynch AM, Bozic CM, Miller D, Grunwald GK, Lynch DA. Quantitative CT indexes in idiopathic pulmonary fibrosis: relationship with physiologic impairment. Radiology 2003; 228:407–414.
- Best AC, Meng J, Lynch AM, Bozic CM, Miller D, Grunwald GK, Lynch DA. Idiopathic pulmonary fibrosis: physiologic tests, quantitative CT indexes, and CT visual scores as predictors of mortality. Radiology 2008;246:935–940.
- Orlandi I, Camiciottoli G, Diciotti S, Bartolucci M, Cavigli E, Nacci F, Matucci-Cerinic M, Villari N, Mascalchi M. Thin-section and low-dose volumetric computed tomographic densitometry of the lung in systemic sclerosis. J Comput Assist Tomogr 2006; 30:823–827.
- Camiciottoli G, Orlandi I, Bartolucci M, Meoni E, Nacci F, Diciotti S, Barcaroli C, Conforti ML, Pistolesi M, Matucci-Cerinic M, Mascalchi M. Lung CT densitometry in systemic sclerosis. Chest 2007; 131:672–681.
- Koyama H, Ohno Y, Yamazaki Y, Nogami M, Kusaka A, Murase K, Sugimura K. Quantitatively assessed CT imaging measures of pulmonary interstitial pneumonia: effects of reconstruction algorithms on histogram parameters. Eur J Radiol 2010; 74:142–146.
- Sverzellati N, Zompatori M, De Luca G, Chetta A, Bnà C, Ormitti F, Cobelli R. Evaluation of quantitative CT indexes in idiopathic interstitial pneumonitis using a low-dose technique. Eur J Radiol 2005; 56:370–375.
- Uppaluri R, Mitsa T, Sonka M, Hoffman EA, McLennan G. Quantification of pulmonary emphysema from lung computer tomography images. Am J Respir Crit Care Med 1997; 156:248–254.
- Xu Y, Sonka M, McLennan G, Guo J, Hoffman EA. MDCT-based 3D texture classification of emphysema and early smoking related lung pathologies. IEEE Trans Med Imaging 2006; 25:464–475.
- Kauczor HU, Heussel CP, Fischer B, Klamm R, Mildenberger P, Thelen M. Assessment of lung volumes using helical CT at inspiration and expiration: comparison with pulmonary function tests. Am J Roentgenol 1998; 171:1091–1095.
- Akira M, Toyokawa K, Inoue Y, Arai T. Quantitative CT in chronic obstructive pulmonary disease: inspiratory and expiratory assessment. Am J Roentgenol 2009; 192:267–272.
- Lee YK, Oh YM, Lee JH, Kim EK, Lee JH, Kim N, Seo JB, Lee SD, KOLD Study Group. Quantitative assessment of emphysema, air trapping, and airway thickening on computed tomography. Lung 2008; 186:157–165.
- O'Donnell RA, Peebles C, Ward JA, Daraker A, Angco G, Broberg P, Pierrou S, Lund J, Holgate ST, Davies DE, Delany DJ, Wilson SJ, Djukanovic R. Relationship between peripheral airway dysfunction, airflow obstruction, and neutrophilic inflammation in COPD. Thorax 2004; 59:837–842.
- Kauczor HU, Hast J, Heussel CP, Schlegel J, Mildenberger P, Thelen M. CT attenuation of HRCT scans obtained at full inspiratory and expiratory position: comparison with pulmonary function tests. Eur Radiol 2002; 12:2757–2763.
- Mergo PJ, Williams WF, Gonzalez-Rothi R, Gibson R, Ros PR, Staab EV, Helmberger T. Three-dimensional volumetric assessment of abnormally low attenuation of the lung from routine helical CT: inspiratory and expiratory quantification. Am J Roentgenol 1998; 170:1355–1360.
- Matsuoka S, Kurihara Y, Yagihashi K, Hoshino M, Watanabe N, Nakajima Y. Quantitative assessment of air trapping in chronic obstructive pulmonary disease using inspiratory and expiratory volumetric MDCT. Am J Roentgenol 2008; 190:762–769.
- Matsuoka S, Kurihara Y, Yagihashi K, Nakajima Y. Quantitative assessment of peripheral airway obstruction on paired expiratory/inspiratory thin-section computed tomography in chronic obstructive pulmonary disease with emphysema. J Comput Assist Tomogr 2007; 31:384–389.
- Heussel CP, Herth FJ, Kappes J, Hantusch R, Hartlieb S, Weinheimer O, Kauczor HU, Eberhardt R. Fully automatic quantitative assessment of emphysema in computed tomography: comparison with pulmonary function testing and normal values. Eur Radiol 2009; 19:2391–2402.
- Matsuoka S, Kurihara Y, Yagihashi K, Niimi H, Nakajima Y. Quantification of thin-section CT lung attenuation in acute pulmonary embolism: correlations with arterial blood gas levels and CT angiography. Am J Roentgenol 2006; 186:1272–1279.
- Tanaka N, Matsumoto T, Miura G, Emoto T, Matsunaga N, Ueda K, Lynch DA. Air trapping at CT: high prevalence in asymptomatic subjects with normal lung function. Radiology 2003; 227:776–785.
- Yamashiro T, Matsuoka S, Bartholmai BJ, San Jose Estepar R, Ross JC, Diaz A, Murayama S, Silverman EK, Hatabu H, Washko GR. Collapsibility of lung volume by paired inspiratory and expiratory CT scans: correlations with lung function and mean lung density. Acad Radiol 2010; 17:489–495.
- Miller MR, Hankinson J, Brusasco V, Burgos F, Casaburi R, Coates A, Crapo R, Enright P, Van Der Grinten CP, Gustafsson P, Jensen R, Johnson DC, MacIntyre N, McKay R, Navajas D, Pedersen OF, Pellegrino R, Viegi G, Wanger J. ATS/ERS task force: standardisation of spirometry. Eur Respir J 2005; 26:319–338.
- Stocks, Quanjer PH. Reference values for residual volume, functional residual capacity and total lung capacity: ATS workshop on lung volume measurements / official statement of the European Respiratory Society. Eur Respir J 1995; 8:492–506.
- Rabe KF, Hurd S, Anzueto A, Barnes PJ, Buist SA, Calverley P, Fukuchi Y, Jenkins C, Rodriguez-Roisin R, van Weel C, Zielinski J. Global strategy for the diagnosis, management, and prevention of chronic obstructive pulmonary disease: GOLD executive summary. Am J Respir Crit Care Med 2007; 176:532–555.
- Dransfield MT, Washko GR, Foreman MG, Estepar RS, Reilly JJ, Bailey WC. Gender differences in the severity of CT emphysema in COPD. Chest 2007; 132:464–470.
- Washko GR, Dransfield MT, San Jose Estepar R, Diaz A, Matsuoka S, Yamashiro T, Hatabu H, Silverman EK, Bailey WC, Reilly JJ. Airway wall attenuation: a biomarker of airway disease in subjects with COPD. J Appl Phisiol 2009; 107:185–191.
- Do KH, Lee JS, Colby TV, Kitaichi M, Kim DS. Nonspecific interstitial pneumonia versus usual interstitial pneumonia: differences in the density histogram of high-resolution CT. J Comput Assist Tomogr 2005; 29:544–548.
- Bayat S, Carette MF, Degrugilliers L, Delavernhe I, Romeo B, Le Blanche A. High resolution CT in children with cystic fibrosis: correlation between lung attenuation, radiological score and respiratory function. Am J Respir Crit Care Med 2009 [Abstract]; 179:A5587.
- Sargent MA, Cairns RA, Murdoch MJ, Nadel HR, Wensley D, Schultz KR. Obstructive lung disease in children after allogenic bone marrow transplantation: evaluation with high-resolution CT. Am J Roentgenol 1995; 164:693–696.
- Ooi GC, Peh WC, Ip M. High-resolution computed tomography of bronchiolitis obliterans syndrome after bone marrow transplantation. Respiration 1998; 65:187–191.
- Jung JI, Jung WS, Hahn ST, Min CK, Kim CC, Park SH. Bronchiolitis obliterans after allogenic bone marrow transplantation: HRCT findings. Kor J Radiol 2004; 5:107–113.
- Gunn ML, Godwin JD, Kanne JP, Flowers ME, Chien JW. High-resolution CT findings of bronchiolitis obliterans syndrome after hematopoietic stem cell transplantation. J Thorac Imaging 2008; 23:244–250.