Abstract
The purposes of this study were: to describe chest CT findings in normal non-smoking controls and cigarette smokers with and without COPD; to compare the prevalence of CT abnormalities with severity of COPD; and to evaluate concordance between visual and quantitative chest CT (QCT) scoring. Methods: Volumetric inspiratory and expiratory CT scans of 294 subjects, including normal non-smokers, smokers without COPD, and smokers with GOLD Stage I-IV COPD, were scored at a multi-reader workshop using a standardized worksheet. There were 58 observers (33 pulmonologists, 25 radiologists); each scan was scored by 9–11 observers. Interobserver agreement was calculated using kappa statistic. Median score of visual observations was compared with QCT measurements. Results: Interobserver agreement was moderate for the presence or absence of emphysema and for the presence of panlobular emphysema; fair for the presence of centrilobular, paraseptal, and bullous emphysema subtypes and for the presence of bronchial wall thickening; and poor for gas trapping, centrilobular nodularity, mosaic attenuation, and bronchial dilation. Agreement was similar for radiologists and pulmonologists. The prevalence on CT readings of most abnormalities (e.g. emphysema, bronchial wall thickening, mosaic attenuation, expiratory gas trapping) increased significantly with greater COPD severity, while the prevalence of centrilobular nodularity decreased. Concordances between visual scoring and quantitative scoring of emphysema, gas trapping and airway wall thickening were 75%, 87% and 65%, respectively. Conclusions: Despite substantial inter-observer variation, visual assessment of chest CT scans in cigarette smokers provides information regarding lung disease severity; visual scoring may be complementary to quantitative evaluation.
Keywords: :
Introduction
COPD is a major public health problem in the United States and world-wide. One of the major limitations to controlling this disease and developing better therapies is that it is a syndrome made up of multiple different subtypes, which have different phenotypic expression and likely varying pathogenic mechanisms. The differences among this cluster of diseases have often been obscured by the fact that they are characterized by the shared feature of chronic airflow obstruction. Morphologic components of COPD include abnormalities of the trachea and main bronchi, inflammation of segmental and subsegmental bronchi, inflammation and obstruction of small airways, and pulmonary parenchymal destruction (Citation1).
CT imaging of the chest can be used to describe different structural expressions of COPD that have strong links to specific genetics (e.g., basal predominant panlobular emphysema in alpha-1 antitrypsin deficiency) and to different broad pathogenetic sequences (such as: large airway disease, small airway disease, gas trapping and unique patterns of emphysema). Although the structural components of COPD are amenable to quantitative analysis (Citation2) (Citation3) (Citation4), visual assessment of the pattern of emphysema and of airways disease, as well as of large airway abnormalities may provide additional important structural information that is not readily assessed by current quantitative methods.
Several ongoing studies are evaluating the genetic underpinnings of COPD with the use of CT to characterize the presence and extent of emphysema and large and small airways abnormalities (Citation5) (Citation6). Quantitative analysis has been used to provide a general measure of disease extent. However, there is also a need for better characterization of COPD in these studies, which requires a more qualitative approach and which necessitates the development of a standardized, widely accepted approach to visually evaluate, and quantify the components of COPD. Previous papers have suggested that there is some discordance between measurements derived from quantitative CT and qualitative visual scoring (Citation7). However, the extent of discordance has not been systematically explored.
Visual assessment of radiologic images is a subjective process. Effective development and dissemination of a visual scoring system requires a hands-on approach, where each participant can interact independently with the images. We convened a qualitative image scoring workshop, with experts from both pulmonary and radiology backgrounds to refine our understanding of chest CT abnormalities in COPD. We hypothesized that the visual CT features of COPD, including centrilobular and panlobular emphysema, airway wall thickening, and centrilobular nodules, would increase with increasing severity of COPD. The purpose of this paper is to describe the qualitative and quantitative findings in normal subjects, and in smokers with and without COPD.
Methods
The workshop occurred over 4 days in February 2010 at the American College of Radiology Education Center in Reston, VA, which contains 59 workstations with full PACS functionality and high resolution monitors. Fifty eight physicians (33 pulmonologists and 25 radiologists) accepted invitations to attend the workshop. A standardized electronic scoresheet recorded the presence or absence of airway wall thickening, cylindric bronchial dilation, varicose or cystic bronchiectasis, centrilobular nodules, mosaic attenuation, expiratory gas trapping, tracheomalacia, bronchomalacia, saber-sheath trachea, intratracheal mucoid material, tracheobronchial outpouching, reticular abnormality, and honeycombing.
Standard definitions for these entities were provided from the Fleischner Society Glossary of terms for thoracic imaging (Citation8). Illustrations of all findings on the standardized scoresheet were presented in the form of a slide presentation, and subsequently supplied to each participant's workstation for reference during the scoring of cases. For bronchial wall thickening, tracheobronchial outpouching, and saber-sheath trachea, where a definition was not available from the Fleischner Society glossary, the entities were illustrated in the slide set. Checkboxes were provided to record equivocal and focal findings. For scoring of emphysema, the lungs were divided into three zones (upper zone above the carina, mid zone between carina and inferior pulmonary veins, lower zone below the inferior pulmonary veins), with right and left lung being considered together. The scoresheet recorded the extent of emphysema in upper, mid and lower zones, according to a 6-point scale, (absent, < 5%, 5–25%, 25–50%, 50–75%, and > 75%). The predominant pattern of emphysema in each lung zone (centrilobular or panlobular) was also recorded.
The image sets reviewed were obtained from 50 individuals in each of the following eight categories—normal non-smoking controls, smokers without evidence of COPD by GOLD (Citation9) criteria, smokers with COPD (50 each from each GOLD stages 1, 2, 3, and 4), smokers with reduced FEV1 but normal FEV1/FVC, and subjects with alpha-1 anti-trypsin deficiency. This paper will focus on the results from normal non-smoking controls, smokers without COPD, and smokers with COPD. Because of data transfer issues, the final dataset described in this paper included 49 subjects from the normal non-smokers, smokers without COPD, and GOLD 2 groups, 50 subjects with GOLD 1 and GOLD 4 COPD, and 47 subjects with GOLD 3 COPD, resulting in a total study population of 294 subjects.
The normal non-smoking controls were defined as individuals who had never smoked, had no history of respiratory illness, and had normal spirometric evaluation. The readers were blinded to the clinical category of the subject. The demographics of the individuals included in the study are shown in . All of the scans were obtained from the multi-center COPDGene study, and were acquired at full inspiration and end-tidal expiration using a standard protocol (Citation6). Contiguous or overlapping axial sub-millimeter reconstructed slices were loaded on the PACS server at the Education Center. Image review was performed on the PACS workstations at standard window settings (Window level -700, window width 1500). The workstations permitted reconstruction of multiplanar images as needed.
Table 1. Demographics of workshop subjects
All scans were reviewed for acceptable quality prior to the workshop. The 393 scans studied in the workshop (which also included subjects with alpha-1 antitrypsin deficiency and those with reduced FEV1 and normal FEV1/FVC) were divided into 5 folders of 78 or 79 scans, each of which contained approximately 10 randomly selected scans from each of the above 8 categories. Each folder was read by a group of 9–11 workshop participants, who were chest radiologists and pulmonologists. To avoid bias based on clinical background, readers were randomly assigned to reading groups, with a system that ensured that the numbers of pulmonologists and radiologists were approximately equal across each reading group. Readers were expected to read all scans in their folder during the workshop. Readers were informed that normal subjects were included, but not specifically informed what the distribution of cases was.
At the workshop, prior to the start of scoring, the participating physicians underwent a training session, with detailed review of the training set of images. As further training, they scored twenty CT image sets, which were subsequently reviewed and discussed by the entire participating group. Once this process was completed, the true assignments were issued to the readers.
Quantitative CT image analysis
Image analysis on all CT exams was performed using Pulmonary Workstation Plus software (VIDA Diagnostics, Inc., Coralville, IA). Automated segmentation of the right and left lungs from the chest wall and mediastinum was performed. The virtual airway tree was generated using an automated region-growing technique and detailed airway analysis to the subsegmental bronchi in six selected airway paths (RB1, RB4, RB10, LB1, LB4 & LB10) was performed. The wall area% (bronchial wall area as percentage of total bronchial area) was calculated for segmental and subsegmental bronchi. For each patient,% emphysema was defined as% lung voxels less than or equal to -950 Hounsfield units (HU) on inspiratory CT, and% gas trapping was defined as% lung voxels less than or equal to -856 HU on expiratory CT. In the 49 normal subjects, the 90th percentile for wall area%,% emphysema, and% gas trapping were identified.
Statistical methods
Basic descriptive data (median, range) were tabulated for each question on the scoresheet and the Weighted Kappa, z-scores and standard deviations were calculated to determine agreement for each of the variables examined. Kappa agreement scores were assessed using the following agreement levels, 0–0.2: poor, 0.21–0.4: fair, 0.41–0.6: moderate, 0.61–0.80: substantial, 0.81–1.0: almost perfect (Citation10). Chi-square test was used to evaluate the difference in prevalence of findings across disease groups. Calculations were done using SAS 9.2 and JMP 8.0.1 (SAS Institute, Inc. Cary, NC). Descriptive data come from PROC MEANS, plots from PROC UNIVARIATE, and the agreement coefficient for the macro MAGREE. This information is available as a total for all reviewers and separately for each reviewer's professional group.
Linear mixed models within medical specialty, and also within review group, were constructed to examine the effect of medical specialty and review group on agreement for scoring of specific items.
The median observer score for the presence or absence of each visually scored variable was used as the estimate of consensus for the group. In cases where the scores were evenly split between absent and present, the visual score was recorded as equivocal. To establish a cutoff value for abnormal quantitative CT variables, the 90th percentile values for% emphysema,% gas trapping, and segmental wall area% were obtained from a group of 92 non-smoking subjects with normal spirometry, scanned as part of the COPDGene study.
Results
Fifty-one reviewers (29 pulmonologists, 22 radiologists) completed assigned readings, for a total of 3017 readings (). Seven reviewers did not complete all readings and were not included in analysis. The actual numbers of scans completed and the number of reviewers completing them are included in .
Table 2. Number of scans and readings in each group.
provides kappa values for reviewers in each of the five reading groups. Kappa scores for all of the variables examined were similar in all 5 groups. In general, inter-observer agreement for presence or absence of emphysema and for presence of panlobular emphysema and tracheobronchomalacia was in the moderate range, while agreement on centrilobular emphysema and bronchial wall thickening was fair, and agreement on centrilobular nodularity, gas trapping, mosaic attenuation, and bronchial dilation was poor. Agreement on lower-prevalence variables such as reticular abnormality and bronchiectasis was also low, as would be expected because of low prevalence.
Table 3. Kappa values for presence or absence of specific variables
Kappa values were generally similar between pulmonologists and radiologists in all groups. Using a multivariate mixed model to determine if there were any differences in scores for physician specialty, we found that only two relatively uncommon findings differed significantly by physician specialty: tracheobronchial mucoid material (p = 0.0115) and tracheobronchial outpouching (p = 0.0004) were more frequently scored by radiologists. No significant differences in kappa values were identified among the review groups. However, there was substantial variation in kappa values across GOLD stages. For example, in Reading Group 1, the kappa values for the presence of emphysema in normals, smokers without COPD, and those with GOLD Stages 1, 2, 3, and 4 COPD were -0.01, 0.38, 0.67, 0.47, 0.48, and 0.27, respectively.
The percentage of readings that showed each finding in each disease category is provided in . The prevalence of all patterns of emphysema clearly increases across the GOLD grades, and emphysema was almost universally found in GOLD 4 patients. Bronchial wall thickening also increased in prevalence with GOLD grade, while centrilobular nodularity decreased in prevalence. Saber-sheath trachea and intratracheal mucoid material were also recorded with substantially increased frequency in the more severe stages of COPD. Bronchial dilation was identified in 52% of participants, with a frequency that was very similar across all categories, including the normal group and those without COPD. There were some differences in frequency of reticular abnormality and honeycombing across the GOLD grades, but the differences were quite small and may not be clinically significant.
Table 4. Percentage of readings on which CT findings were identified, by disease category
In the 92 normal subjects, the 90th percentile values for% emphysema,% gas trapping, and% segmental wall area were 4.8%, 19.5%, and 60.9% respectively. Individuals with quantitative CT (QCT) measurements exceeding these values were regarded as meeting QCT criteria for the presence of emphysema, gas trapping or airway wall thickening. Tables , and show the concordance between the QCT measures and visual measures of presence or absence of each entity. Excluding equivocal cases, the median visual scores were concordant with QCT assessment in 218/291 (75%) of cases for emphysema, 238/294 (81%) of cases for gas trapping, and 191/286 (67%) for airway wall thickening.
Table 5(a). Concordance between quantitative CT percentages of emphysema and visual evidence of emphysema
Table 5(b). Concordance between quantitative CT and visual evidence of gas trapping on expiratory CT
Table 5(c). Concordance between quantitative CT and visual evidence of airway wall thickening
Notably, among those with visual scores indicating absence of emphysema, QCT identified more than 4.8% emphysema-like abnormality in 25% of cases. With regard to gas trapping, visual assessment of absent air trapping was concordant with CT assessment in all cases, but visual scoring of the presence of air trapping was not associated with QCT evidence of air trapping in 24% of cases. Visual scores for presence or absence of bronchial wall thickening were discordant with QCT assessment in 38% and 21% of cases respectively. , 2, and 3 show examples of discordant visual and QCT findings for the presence or absence of emphysema, air trapping and airway wall thickening.
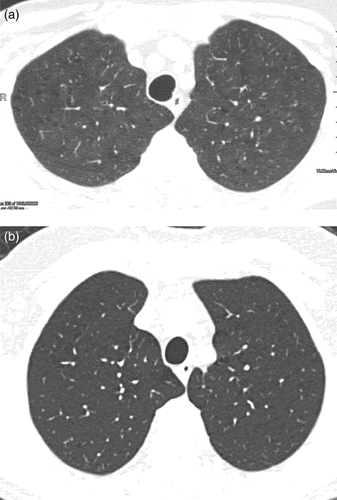
Figure 1. (a) Axial CT image in a subject with GOLD Stage 1 COPD, where reviewers scored visual emphysema, but quantitative% of emphysema was less than 1%. CT shows mild centrilobular emphysema, which did not reach the quantitative threshold for emphysema. (b) Axial CT image in a subject with GOLD Stage 1 COPD where reviewers scored no visual emphysema, but quantitative% of emphysema was 18%. Close inspection shows multiple small foci of decreased attenuation adjacent to vessels which may either represent dilated peripheral airways or very early emphysema.
Cases with high agreement derived from the CT workshop were used to develop a library of standard images for visual phenotyping of COPD, presented in the online supplement.
Discussion
This study utilized a large number of observers with diverse specialty training (pulmonary radiology and pulmonary medicine) to score a number of cases with varying disease severity to provide insight into the relationship between visual CT parameters, disease severity and quantitative scoring in COPD. Despite relatively low levels of observer agreement for many of the parameters we evaluated, we found that the prevalence of most CT findings (with the notable exceptions of centrilobular nodularity, cylindric bronchial dilation, tracheobronchial outpouching, and ground glass abnormality) increased substantially with increasing COPD severity. There was moderate discordance between visual assessment and quantitative CT assessment of the presence or absence of emphysema, gas trapping and airway wall thickening.
Several previous observers have evaluated the inter-observer variation among reviewers scoring for the presence and extent of emphysema. Bankier et al., in a study of 62 patients who subsequently underwent lung resection, found that inter-observer agreement for emphysema score among three readers was in the moderate range (weighted kappa values ranging from 0.48 to 0.57) (Citation11). The correlation between visual scoring and macroscopic and microscopic measurements of disease extent was less strong than for automated quantification, and there was a suggestion that the observers systematically over-estimated emphysema extent.
Ochsmann et al. in a study of 636 asbestos-exposed subjects found kappa scores of 0.46 and 0.45 respectively for presence and extent of emphysema on CT (Citation12). Hersh et al. found kappa values ranging from 0.2 to 0.60 for assessment of the presence of upper lung predominant emphysema (Citation13). These results are similar to those found in our study, where kappa values for presence of emphysema ranged from 0.45 to 0.63, and kappa values for specific pattern of emphysema (centrilobular, panlobular, or paraseptal) ranged from 0.25 to 0.49.
Some of the variation in kappa values identified in this and other studies may reflect a known limitation of the kappa value, by which the kappa value is reduced in subjects with high or low frequency of disease (Citation14). For example, when we analyzed the kappa values for presence of emphysema by GOLD grade, kappa values were lowest in normal subjects (who presumably have low prevalence of emphysema), and in GOLD Stage IV (with high prevalence of emphysema).
Assessment of bronchial wall thickening on CT is quite variable, with reported kappa values ranging from 0.15 to 0.67 (Citation15, 16) (Citation17). In the current study, the inter-observer agreement for evaluation of bronchial wall thickening was poor (kappa values ranging from 0.17 to 0.27), despite the use of training and a standard slide set that was agreed a priori. The most likely reason for this variation may be the variability of bronchial appearance in COPD. In contrast to asthma, where bronchi may be reliably graded as thick-walled or not thick-walled, the segmental and subsegmental bronchi display a great variety of appearances in COPD. They may be dilated and not thick-walled, dilated and thick-walled, or irregular in shape. This range of appearances may impair reproducible visual assessment of airway wall thickness. Similar considerations probably account for the inter-observer variability in bronchial dilation (kappa values ranging from 0.11 to 0.23). Quantitative analysis of airway wall parameters on volumetric CT scans may provide more reproducible evaluation of airway wall thickening and airway dilation (Citation18).
Despite the fact that radiologists have substantially more experience and training than pulmonologists in interpretation of imaging findings, there was no systematic difference in scoring pattern or observer agreement among radiologists and pulmonologists, with the exception of the relatively uncommon findings of tracheobronchial outpouching and mucoid material. The comparable performance of these two physician groups may be due to the fact both groups received the same pre-scoring training session in interpreting COPD images, and had access to a set of standard images. Hersh et al. similarly found that pulmonologists and radiologists did not differ significantly in assessing severity of emphysema (Citation13).
In this workshop, the varying prevalence of CT findings across GOLD grades was striking. Centrilobular and panlobular emphysema, bronchial wall thickening, saber sheath trachea, and intratracheal mucoid material all increased in prevalence with increasing severity of GOLD classification, suggesting that these are associated with increasing disease severity. It is interesting, however, that the prevalence of centrilobular nodularity decreased with increasing severity of GOLD grade, consistent with the hypothesis that centrilobular nodules are the precursors of emphysema, and therefore, decrease in prevalence as the nodules are replaced by parenchymal destruction (Citation19). The prevalence of bronchial dilation was almost evenly distributed across the normal and diseased groups, suggesting that this is not a useful marker of disease.
The prevalence of “abnormal” readings in non-smoking normal subjects in our study is notable. A normal reading was recorded in only 134 (26%) of 509 readings in these subjects. The most common “abnormalities” recorded in these subjects were gas trapping, bronchial dilation, bronchial wall thickening, and centrilobular nodularity. The prevalence of these findings on CT scans of non-smoking normal individuals has varied substantially in previous reports, perhaps because of variation in CT criteria for abnormality. Gietema et al. recently identified emphysema (usually of trivial degree) in 60% of non-smoking control subjects (Citation20). Mastora et al. found bronchial wall thickening in only one of 59 nonsmoking subjects, and none had micronodules (Citation21). In a study of 40 asymptomatic individuals over the age of 75, Copley et al. found bronchial dilation in 60%, reticular pattern in 60%, bronchial wall thickening in 55% and thin walled cysts in 25% (Citation17). In the study by Copley et al., all of these findings were much more common than in a comparison group aged less than 55 years, suggesting that these findings may be a manifestation of normal aging. It will be interesting to learn whether the use of quantitative CT airway measures can help distinguish between normal manifestations of aging and pathologic bronchial disease.
Previous reports have documented a high prevalence (50–60%) of expiratory air trapping in asymptomatic physiologically normal individuals (Citation21–23), particularly older subjects (Citation24). In our study, the prevalence of expiratory air trapping in normal subjects was 60%, very similar to the prevalence in previous studies. However, the prevalence of air trapping clearly increases substantially with increasing evidence of airflow obstruction.
In our study, there was moderate concordance between visual and QCT assessment of the presence or absence of emphysema, gas trapping and airway wall thickening, with concordance of 75%, 81%, and 67% respectively for these parameters, when the threshold for the QCT continuous variable was set at the 90th percentile for normal subjects. These concordance values are clearly dependent on the threshold set for QCT. When emphysema is mild or focal, it may be present on visual assessment but may not reach the threshold for QCT abnormality (Fig 1a). Conversely, quantitative assessment may falsely identify emphysema in some individuals in which it is visually minimal or absent (Fig 1b).
The presence of emphysema by QCT in individuals where it was not identified visually might be explained by the presence of isolated pixels of low attenuation which are not perceived as emphysema. Such low attenuation pixels could be due to hyperinflated lung, or microscopic emphysema. Alternatively, QCT may be falsely positive for technical reasons such as scanner variation, noise, etc. Gietema et al recently found that in those with less severe categories of emphysema, radiologists tended to visually underestimate extent of emphysema compared with quantitative measures, while in those with more severe emphysema, the radiologists tended to relatively overestimate emphysema extent (Citation20). Thus, QCT and visual evaluation may provide complementary, independent assessments of severity of emphysema, particularly in those with less severe abnormality.
With regard to gas trapping, it is interesting that the absence of gas trapping on visual assessment was 100% concordant with QCT. However, visually identified gas trapping was discordant with QCT in 24% of cases (): this discordance may be due to the presence of focal or mild gas trapping, or to false positive visual identification of gas trapping in individuals with heterogeneous lung emptying. With regard to bronchial wall thickening, only 17% of cases with no bronchial wall thickening by visual scoring met QCT criteria for bronchial wall thickening (). However, 38% of cases in which bronchial wall thickening was identified visually were discordant with the QCT assessment ().
Figure 2. Axial CT image in a non-smoking, physiologically normal subject, where reviewers scored visual gas trapping, but quantitative% of gas trapping was only 11%. CT shows relatively mild multilobular gas trapping, which did not reach the quantitative threshold for gas trapping.
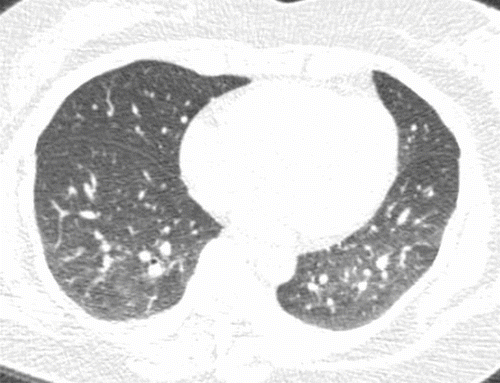
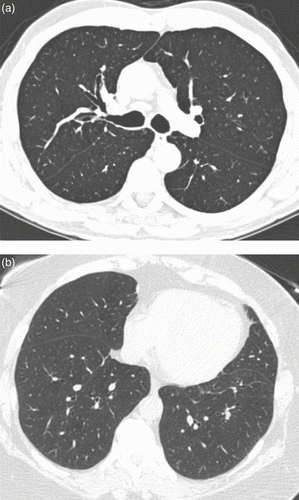
Figure 3 (a) Axial CT image in a subject with GOLD Stage 1 COPD, where reviewers scored visual bronchial wall thickening, but wall area% of segmental bronchi was 55%. CT shows evidence of thickening of the bronchial walls, but associated moderate dilation of the bronchial lumens resulted in normalization of the wall area% value. (b) Axial CT image in a smoking control subject where reviewers scored no bronchial wall thickening, but wall area% of segmental bronchi was 63%. Although the bronchial walls appear visually normal, the bronchial lumens are relatively small, and this might have resulted in artificial elevation of the wall area% value.
As illustrated in , some of this discordance reflects the limitation of measures of bronchial wall area% as an index of wall thickness, since variation in size of the bronchial lumen will also result in changes in this ratio. Discordance between visual and quantitative evaluation of bronchial walls may also be due to the presence of mild or focal abnormality, or to visual “overcalling” of bronchial wall thickening, since this finding was identified in 40% of readings of non-smoking controls.
A limitation of this study is the relatively high level of observer variation for many CT parameters, which limits the conclusions. Additionally, neither QCT nor visual assessment can be regarded as a gold standard for the presence or absence of disease: perhaps it is best to regard them as complementary.
Conclusion
Our study suggests that visual scoring of images of COPD by pulmonologists and radiologists, using a standardized training set, can characterize the presence and pattern of emphysema with moderate inter-observer variation. Agreement on airway-related parameters and gas trapping is relatively poor. Despite substantial interobserver variation, there was a clear increase in prevalence of emphysema and air trapping in individuals with increasing levels of COPD.
Declaration of Interest
The authors report no conflict of interest relevant to this publication, with the exception of the funding support indicated on the title page. The following authors are responsible for the content and writing of this paper: < Writing Committee: David A Lynch, James R Murphy*, James D Crapo, Gerard J. Criner, Maya Galperin-Aizenberg, Francine L. Jacobson, David A. Lipson, A. James Mamary, John D Newell Jr, Amir Sharafkhaneh, Edwin JR van Beek. Note: * Deceased.
Acknowledgments
We appreciate the hard work of many who made this COPD workshop possible, including Vinay Sandhir at the American College of Radiology, and our COPDGene staff, including Carla Wilson, Douglas Stinson, Rebecca Leek, Jordan Zach, Stacy Rodionova, Verity McArthur, Andrew Allen, Alex Kluiber and Tanya Mann.
Supplementary Material
Download (12.7 MB)Notice of Correction: Corrections have been made to this article since its original online publication date of 19 March, 2012.
References
- Friedlander AL, Lynch D, Dyar LA, Bowler RP. Phenotypes of chronic obstructive pulmonary disease. COPD 2007 Dec;4(4):355–384.
- Coxson HO, Rogers RM. Quantitative computed tomography of chronic obstructive pulmonary disease. Acad Radiol 2005 Nov;12(11):1457–1463.
- Hoffman EA, Simon BA, McLennan G. State of the Art. A structural and functional assessment of the lung via multidetector-row computed tomography: phenotyping chronic obstructive pulmonary disease. Proc Am Thorac Soc 2006 Aug; 3(6):519–532.
- Goldin JG. Quantitative CT of emphysema and the airways. J Thorac Imaging. 2004 Oct; 19(4):235–240.
- Vestbo J, Anderson W, Coxson HO, Crim C, Dawber F, Edwards L, Evaluation of COPD Longitudinally to Identify Predictive Surrogate End-points (ECLIPSE). Eur Respir J 2008 Apr; 31(4):869–873.
- Regan EA, Hokanson JE, Murphy JR, Make B, Lynch DA, Beaty TH, Genetic epidemiology of COPD (COPDGene) study design. COPD 2010 Feb; 7(1):32–43.
- Patel BD, Coxson HO, Pillai SG, Agusti AG, Calverley PM, Donner CF, Airway wall thickening and emphysema show independent familial aggregation in chronic obstructive pulmonary disease. Am J Respir Crit Care Med 2008 Sep 1; 178(5):500–505.
- Hansell DM, Bankier AA, Macmahon H, McLoud TC, Müller NL, Remy J. Fleischner Society: Glossary of terms for thoracic imaging. Radiology 2008 Mar;246(3):697–722.
- Rabe KF, Hurd S, Anzueto A, Barnes PJ, Buist SA, Calverley P, Global strategy for the diagnosis, management, and prevention of chronic obstructive pulmonary disease: GOLD executive summary. Am J Respir Crit Care Med 2007 Sep 15; 176(6):532–555.
- Landis JR, Koch GG. The measurement of observer agreement for categorical data. Biometrics 1977 Mar; 33(1):159–174.
- Bankier AA, De Maertelaer V, Keyzer C, Gevenois PA. Pulmonary emphysema: subjective visual grading versus objective quantification with macroscopic morphometry and thin-section CT densitometry. Radiology 1999; 211(3):851–858.
- Ochsmann E, Carl T, Brand P, Raithel HJ, Kraus T. Inter-reader variability in chest radiography and HRCT for the early detection of asbestos-related lung and pleural abnormalities in a cohort of 636 asbestos-exposed subjects. Int Arch Occup Environ Health. 2010 Jan; 83(1):39–46.
- Hersh CP, Washko GR, Jacobson FL, Gill R, Estepar RS, Reilly JJ, Interobserver variability in the determination of upper lobe-predominant emphysema. Chest. 2007 Feb; 131(2):424–431.
- Feinstein AR, Cicchetti DV. High agreement but low kappa: I. The problems of two paradoxes. J Clin Epidemiol [Research Support, Non-U.S. Gov't Research Support, U.S. Gov't, Non-P.H.S.]. 1990; 43(6):543–549.
- Daniloff E, Lynch D, Bartelson B, Newell JJ, Bernstein S, Newman L. Observer variation and relationship of computed tomography to severity of beryllium disease. Am J Resp Crit Care Med 1997; 155:2047–2056.
- Copley SJ, Wells AU, Müller NL, Rubens MB, Hollings NP, Cleverley JR, Thin-section CT in obstructive pulmonary disease: discriminatory value. Radiology 2002 Jun; 223(3):812–819.
- Copley SJ, Wells AU, Hawtin KE, Gibson DJ, Hodson JM, Jacques AE, Lung morphology in the elderly: comparative CT study of subjects over 75 years old versus those under 55 years old. Radiology 2009 May; 251(2):566–573.
- Nieber M, Putter H, Stolk J, Reiber JH, Stoel BC. Prediction of pulmonary function in COPD on the basis of CT measurements of bronchial wall thickness. Radiology. 2006 Jan; 238(1):374–375; author reply 5.
- Remy-Jardin M, Edme JL, Boulenguez C, Remy J, Mastora I, Sobaszek A. Longitudinal follow-up study of smoker's lung with thin-section CT in correlation with pulmonary function tests. Radiology 2002;222(1):261–270.
- Gietema HA, Muller NL, Nasute Fauerbach PV, Sharma S, Edwards LD, Camp PG, Quantifying the extent of emphysema: Factors associated with radiologists’ estimations and quantitative indices of emphysema severity using the ECLIPSE cohort. Academ Radiol 2011 Jun; 18(6):661–671.
- Mastora I, Remy-Jardin M, Sobaszek A, Boulenguez C, Remy J, Edme JL. Thin-section CT finding in 250 volunteers: assessment of the relationship of CT findings with smoking history and pulmonary function test results. Radiology 2001; 218(3):695–702.
- Chen D, Webb WR, Storto ML, Lee KN. Assessment of air trapping using postexpiratory high-resolution computed tomography. J Thorac Imaging 1998 Apr; 13(2):135–143.
- Tanaka N, Matsumoto T, Miura G, Emoto T, Matsunaga N, Ueda K, Air trapping at CT: high prevalence in asymptomatic subjects with normal pulmonary function. Radiology 2003 Jun; 227(3):776–785.
- Lee KW, Chung SY, Yang I, Lee Y, Ko EY, Park MJ. Correlation of aging and smoking with air trapping at thin-section CT of the lung in asymptomatic subjects. Radiology. 2000 Mar; 214(3):831–836.