
Abstract
Background: Knowledge about predictors for developing hypoxemia in the course of chronic obstructive pulmonary disease (COPD) progression is limited. The objective of the present study was to investigate predictors for overall PaO2, for a potential change in PaO2 over time, and for first occurrence of hypoxemia. Methods: 419 patients aged 40–76 years with COPD GOLD stages II-IV underwent clinical and pulmonary function measurements, including repeated arterial blood gases over three years. Airway obstruction, lung hyperinflation, markers of systemic inflammation and cardiovascular health, exacerbation frequency, smoking habits, and body composition were tested as possible predictors of PaO2 and first episode of hypoxemia. Results: In multivariate adjusted longitudinal analyses, forced expiratory volume in 1 second, total lung capacity and functional residual capacity (all in% predicted), resting heart rate and fat mass index were all associated with overall PaO2 (all P < 0.005). We found no change in PaO2 over time (ρ = 0.33), nor did we find evidence that any of the tested variables predicted change in PaO2 over time. In multivariate adjusted survival analyses, functional residual capacity and resting heart rate were predictors of episodic hypoxemia (both ρ < 0.005). Conclusions: This longitudinal study identified pulmonary, cardiac and metabolic risk factors for overall PaO2 and episodic hypoxemia, but detected no change in PaO2 over time.
Introduction
Chronic hypoxemia is a serious complication of chronic obstructive pulmonary disease (COPD), and is related to increased mortality (Citation1–3). Previous studies have shown that hypoxemia contribute to other COPD related complications, including heart disease (Citation4–6), polycythaemia (Citation7), and skeletal muscle dysfunction (Citation8). An important goal is therefore to increase awareness and understand which signs and symptoms precede hypoxemia.
Hypoxemic respiratory failure is usually defined as arterial oxygen (PaO2) less than 8.0 kPa (60 mmHg). An important determinant of hypoxemia in COPD patients is increased ventilation/perfusion (V/Q) mismatch, caused by progressive airway obstruction and destruction of the pulmonary capillary bed (Citation9). However, the risk of hypoxemia may also be associated with extrapulmonary factors, such as oxygen consumption and cardiac output (Citation10), resting heart rate, body mass index, fat mass index, total lung capacity and female gender (Citation11–12). Previous studies of predictors of PaO2 or hypoxemia have been conducted in cross-sectional studies and the numbers of predictors examined are few. To our knowledge, no published study has examined predictors for a potential change in PaO2 over time. Identifying predictors in a longitudinal setting is of particular relevance because it can guide clinicians to important focus points in the follow-up of COPD patients.
The aim of the present longitudinal study was two-fold: 1) to investigate predictors for overall PaO2 and for a potential change in PaO2 over time, 2) and to examine potential predictors of first occurrence of hypoxemia.
Methods
Study population
This study is based on the Bergen COPD Cohort Study, which is a three-year follow-up study of 433 COPD patients between February 2006 and December 2009, aged 40–76 years at baseline. The inclusion criteria and data collection have been described in detail previously (Citation11, Citation13). In short, COPD was defined according to the Global Initiative for Obstructive Lung Disease (GOLD) guidelines as post-bronchodilator ratio of forced expiratory volume in one second (FEV1) over forced vital capacity (FVC) < 0.7, and severity was defined according to post-bronchodilator FEV1 in% predicted (Citation14).
All subjects had smoked at least 10 pack-years, and they did not have any other known respiratory or systemic inflammatory disease. Measurements in the study were done on patients in a stable phase of their COPD. If a scheduled visit coincided with an acute exacerbation of COPD, defined as worsening of COPD symptoms leading to treatment with antibiotics and/or oral steroids and/or hospitalization, the visit was rescheduled to 4 weeks after symptom relief or end of medical treatment. Written informed consent from all participants was obtained prior to inclusion, and the Western Norway Regional Research Ethics Committee approved the study, approval number 165.08.
PaO2 and hypoxemia
PaO2 was measured at baseline and study visits every six months for three years, i.e., a maximum of seven measurements per patient were done. For each of the seven study visits, patients were also categorized with respect to hypoxemic respiratory failure, defined as a PaO2 less than 8.0 kPa (60 mmHg). The technical procedure for arterial blood sample collection and analysis of the arterial blood gases, including quality control system and reproducibility of the recordings, has been described previously (Citation11).
All samples were taken with the subjects sitting upright and at rest for at least 15 min prior to the arterial puncture and analysed on a Radiometer ABL 520 (Radiometer, Copenhagen). Supplemental oxygen was discontinued 30 minutes prior to drawing the blood sample. If this could not be done for medical reasons, this measurement was excluded from the analyses (29 samples). Samples with suspected venous admixture (n = 1), air bubbles (n = 1) hyperventilation (n = 2) or apparatus failure (n = 2) were excluded from the analyses.
Potential predictors
For the purpose of this study, 26 predictors were initially evaluated for analyses of both PaO2 and hypoxemia (). Potential predictors covered the following areas: demographics, smoking habits, airways obstruction, air trapping and hyperinflation, cardiovascular health, comorbidities, body composition, systemic inflammation and exacerbation frequency. All variables were continuous, except for gender (female, male), smoking status (current vs. former smoker), hypertension treatment (no, yes) and exacerbation frequency (<2, ≥2 during the last 12 months).
Table 1. Potential predictors for PaO2 and hypoxemia at baseline
Statistical analyses
All statistical analyses were performed using Stata/SE 11.2 (StataCorp, Texas, USA) software for Windows. Continuous variables were described as mean and standard deviation when normally distributed, and as median and interquartile range when having skewed distributions. Categorical variables were described as number and percentage. Correlation between pairs of variables was calculated using Pearson's correlation coefficient (r). Because of increasing missing PaO2 measures during the follow-up period, analyses were restricted to include patients with three or more PaO2 measurements.
To estimate potential predictors of repeated PaO2 measures, linear mixed effects models with random intercept were used. Effects of predictors were estimated in both simple and multiple regression models with additional adjustment of time. All continuous predictors, including time, were modelled as linear terms and dichotomous predictors as categorical terms. To investigate potential predictors for change in PaO2 over time, we further included all two-ways interactions with time by incorporating the product term of time and the predictor in multivariate models. For these analyses, the continuous predictor variables were centered on their population mean estimates to obtain interpretable regression coefficients (Citation15). Intra class correlation coefficient, a measure for between-patient heterogeneity, was estimated for the simplest random intercept model including only time.
To estimate potential predictors of first occurrence of hypoxemic respiratory failure (PaO2 < 8.0 kPa) among patients normoxemic at baseline, we applied Cox regression analyses. In these analyses, the time from baseline until the first occurrence of hypoxemia was used as the measure of event free time. All subjects were monitored for up to three years until censoring, with December 31, 2009 as the final day of follow-up. Effects of predictors were estimated in both simple and multiple regression models. All continuous predictors were modelled as linear terms and dichotomous predictors as categorical terms. Using a test based on Schoenfeld residuals, we verified that the proportional-hazards assumption was fulfilled for all variables in the final multivariate analyses.
Predictor inclusion criteria for the multivariate model
Initial selection of potential predictors was performed through univariate analyses. Variables that were associated with PaO2 or hypoxemia with a p < 0.25 were characterized as possible predictors and were analyzed further in multivariate regression analyses including confounding factors. Appropriate selection of confounding factors for each potential predictor was performed by subject-matter knowledge among covariates with a p < 0.25. Finally, if two or more covariates were collinear, we removed these variables one at the time by using the criteria of variance inflation factor > 6 before performing the final predictor analysis. Covariate selections for all analyses are presented in Supplementary . Because of multiple testing, significance of predictors and interaction terms in the final analyses was evaluated on the alpha level of 0.005, corresponding to a Bonferroni correction of 10 predictors.
Results
Study samples
Of the initial 433 COPD patients, 419 (97%) patients were eligible for analyses. Analyses involving predictors of repeated PaO2 measures excluded further 53 patients because they had only two or less follow-up measurements of PaO2, leaving 366 patients for analyses. Analyses involving predictors of first occurrence of hypoxemia (PaO2 <8.0 kPa) excluded 110 of the initial 419 patients due to one or several of the following reasons: hypoxemia at baseline, missing blood gas measurements at baseline, or less than two repeated blood gas measurement, leaving 309 patients for analyses. Patient characteristics and clinical features at baseline were essentially the same for the overall sample and the samples restricted to predictor analyses of change in PaO2 and episodes of hypoxemia ().
Table 2. Patient characteristics and clinical features at baseline
Longitudinal change of PaO2
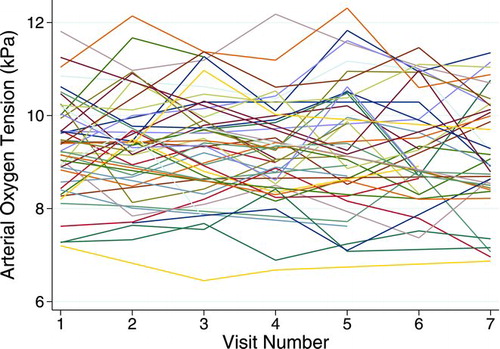
Individual trajectories of 50 (of 366) randomly selected patients with three or more repeated PaO2 observations are depicted in . The overall number of patients at each of the seven visits was 338, 301, 342, 282, 292, 263, and 273, respectively. The observed mean value and standard deviations in PaO2 were essentially constant over time; mean varied from 9.32 to 9.37 kPa, whereas standard deviation varied from 1.07 to 1.14. Simple random intercept models incorporating only time as a linear predictor showed that there was no statistically significant decline in PaO2 along the time axis (p = 0.33). The between-patient heterogeneity (i.e., intraclass correlation coefficient) estimated from this model was 0.66.
Figure 1. Individual trajectories of 50 randomly selected patients with three or more repeated partial pressure of arterial oxygen observations.
Predictor analyses of overall PaO2
Of the initial 26 baseline variables evaluated, 18 variables fulfilled the inclusion criteria described earlier for the final predictor analyses of PaO2 (). In simple time-adjusted regression analyses including only one predictor at a time, FEV1, FVC, TLC, RV, RV/TLC-ratio, IC, FRC, resting heart rate, and FMI were statistically significant predictors for overall PaO2 at the alpha level of 0.005. In multiple regression analyses, however, only FEV1, TLC, FRC, resting heart rate, and FMI remained statistically significant predictors (). Of these, FEV1, FRC and resting heart rate appeared as the strongest predictors. We did not find statistical significant evidence that any of the tested variables predicted change in PaO2 over time (), although there was a tendency for a decline in PaO2 for women (p = 0.035).
Table 3. Predictors of PaO2 estimated by linear mixed effects models
Table 4. Change in PaO2 According to selected baseline predictors, estimated by linear mixed effects models
Predictor analyses of hypoxemia
Of the initial 26 baseline variables evaluated, 17 fulfilled the inclusion criteria for the final predictor analyses of first occurrence of hypoxemia (). Median follow-up time was 35.6 months (range 7–36 months) with 9,412 person-months of accumulated risk. Notably, 45 out of the 309 (15%) normoxemic patients at baseline developed at least one episode of hypoxemia later on. In univariate Cox regression analyses, FEV1, RV, RV/TLC-ratio, FRC and resting heart rate were significantly associated with first occurrence of hypoxemia. In multivariate adjusted Cox regression analyses, only FRC in% predicted (hazard ratio 1.012) and resting heart rate (hazard ratio 1.494 per 10 beats per minute (bpm) elevation) remained significant predictors on the alpha level of 0.005 ().
Table 5. Predictors of first occurrence of hypoxemia estimated by Cox regression analyses
Discussion
Using data from a large longitudinal study of 433 COPD patients (GOLD stage II-IV), the present study aimed to investigate predictors for overall PaO2 and for a potential change in PaO2 over time, as well as first occurrence of hypoxemia. Our study showed no statistically significant decline in PaO2 from baseline to the end of the 3-year follow-up period. In multivariate longitudinal analyses, using mixed effects models, FEV1, TLC, FRC, resting heart rate and FMI were all significantly associated with overall PaO2, but there was no evidence that these or other variables were predictive of change of PaO2 during follow-up. In multivariate Cox regression analyses, a high FRC and a high resting heart rate were significant independent predictors for episodic hypoxemia.
A previous reference value study on PaO2 in a cross-sectional sample showed a yearly decline in PaO2 of approximately 0.05 kPa/year for healthy non-smoking individuals aged 40–70 yrs (Citation16). Naturally, it is possible that COPD patients have a different variability in PaO2 over time than comparably healthy, non-smoking individuals. Nevertheless, our finding of no decline in PaO2 over a 3-year period was somewhat unexpected.
One explanation for the stable PaO2 levels throughout the study period could be that our study may not be representative for COPD patients in general. The most severely ill patients could have refrained from attending study visits, increasing the probability that some of the patients with hypoxemia were not included in the analyses. Second, a PaO2 decline in COPD patients may happen stepwise, declining abruptly when mechanisms maintaining adequate V/Q matching fail. A 3-year longitudinal observation time could be too short to document these changes. Third, COPD may progress slower than previously believed. This is consistent with recent longitudinal studies on lung function decline in COPD, showing only a modest decrease in FEV1 over a period of 3–4 years (Citation17, 18). Also, the patients in our study were given COPD therapy, optimizing their lung health –possibly postponing their disease progress.
Rodriguez-Roisin et al. demonstrated that there is a steady progression of arterial blood gas disturbances with increasing airflow limitation (Citation19). Airways obstruction, as measured by FEV1, will over time cause reduced ventilation in an increasing number of lung regions, leading to V/Q disturbances. Our study confirms a relationship between FEV1 and PaO2. We found higher FRC and higher TLC to be independently associated with lower levels of PaO2 as well. Higher FRC and higher TLC reflect hyperinflation, contributing to gas exchange disturbances (Citation20).
Our analyses also indicated that having a high FMI is associated with a lower PaO2. This is consistent with earlier findings from baseline cross-sectional data of the same population (Citation11) as well as a study by Kim et al. on the association between SaO2 and BMI (Citation12). Excess fat tissue may cause under-ventilation of lower lung zones, leading to low V/Q ratios in these areas (Citation21). It has been shown that obese COPD patients have an altered pulmonary perfusion distribution, possibly due to increased pulmonary perfusion pressure (Citation21).
Increased resting heart rate was a strong independent predictor for both level of PaO2 and for developing an episode of hypoxemia. In fact, it was the strongest predictor of hypoxemia occurrence, increasing the risk by 49% per 10 bpm elevation in resting heart rate at baseline. The significant association between higher resting heart rate and lower level of PaO2 is consistent with earlier findings in cross-sectional studies (Citation6, Citation11, Citation22). Hypoxemic COPD patients have a higher sympathetic activation (Citation22) and arterial chemoreflex activation (Citation23), expressed by increased resting heart rate. The results from the Cox regression analyses also suggest that a higher resting heart rate in normoxemic COPD patients could predict development of hypoxemia in the future. The mechanism for this is not clear.
In our longitudinal analyses, we found no overall mean change in PaO2 over time. Nevertheless, there were changes in PaO2 at the individual level. In a number of subjects we registered variability in the measurements, with hypoxemia on one of the scheduled visits, returning to normoxemia on the next. Our hypothesis is that episodic hypoxemia precedes manifest hypoxemia, and therefore it is of interest to examine what could predict such episodes.
Adjusted Cox regression analyses also showed that having a high FRC increases the risk of developing an episode of hypoxemia for patients with normoxemia at baseline, with a 1.2% increased risk per 1%-unit elevation in FRC in%predicted. Elevated FRC is indicative of hyperinflation, seen in patients with emphysema and bronchial obstruction, with loss of lung elasticity and lung parenchyma destruction (Citation24). These are all factors that contribute to V/Q mismatch. FEV1 was not a significant factor in the adjusted model. However, a low FEV1 is associated with increased static lung volumes and closing volume. Closing volume may approach and even exceed FRC. When airway collapse occurs, it will cause V/Q disturbances and hypoxemia.
There are several strengths of our study. First, Bergen COPD Cohort Study it is a relatively large study with 433 COPD patients followed regularly over a three-year period and the only study with repeated arterial blood gas measurements to this extent. The same blood gas apparatus was used throughout the whole study, with thorough quality control twice daily, reducing instrumental variability in the measurements. In addition, the patients are well characterized by a large series of consistently measured pulmonary function- and body composition tests as well as questionnaire data, thus offering a unique opportunity to explore predictors of respiratory failure.
Our study also has certain limitations that should be acknowledged. A three-year observation time may be too short to document a decline in PaO2 over time. Therefore, future studies with longer follow-up time, including measurements that more closely reflect the mechanisms behind a change in PaO2, may uncover a more significant decrease in PaO2, and supplement our knowledge of factors contributing to respiratory failure in COPD. Furthermore, potential predictors may be closely linked when it comes to causal mechanisms, impacting one another, and it is not given what comes first. Thus, co-linearity can be a problem when examining multiple potential predictors for PaO2 and episodic hypoxemia.
Conclusion
In a COPD population with GOLD stage II-IV, PaO2 did not change during a three-year follow-up period. In a longitudinal setting, FEV1, TLC, FRC, resting heart rate and FMI were all significantly associated with overall PaO2 at each time point. Measures indicating hyperinflation and high resting heart rate both independently predicted future episodes of hypoxemic respiratory failure.
COPD imposes a substantial burden on both patients and the health care system. In particular, this is the case for COPD patients with coexisting chronic respiratory failure. Being able to uncover clinical markers predicting chronic respiratory failure may enable treatment with long-term oxygen at the right time, improving survival in this patient group and perhaps also have an impact on health care expenditures.
Acknowledgments
We would like to thank Lene Svendsen, Tina Endresen-Vinsjevik and Eli Nordeide for their role in the data collection.
Declaration of Interest Statement
Eirunn Waatevik Saure has received payment for lectures (GlaxoSmithKline, AstraZeneca, and Boehringer Ingelheim), not related to this study. Jon A. Hardie has received payment for lectures, development of educational presentations and travel/accomodations/meeting expenses (GlaxoSmithKline, AstraZeneca, Boehringer Ingelheim, Novartis), not related to this study. Per S. Bakke has received payment for lectures (GlaxoSmithKline, AstraZeneca, Pfizer), not related to this study. Tomas Eagan has received payment for lectures, and travel/accomodations/meeting expenses (GlaxoSmithKline, AstraZeneca, Boehringer Ingelheim, Novartis), not related to this study.
Robert L. Jenssen, Ane Johannessen, Marianne Aanerud, Roy M. Nilsen, and Einar Thorsen have no declarations of interest to report.
References
- Zielinski J, MacNee W, Wedzicha J, Causes of death in patients with COPD and chronic respiratory failure. Monaldi Arch Chest Dis 1997; 52:43–47.
- Nizet TA, van den Elshout FJ, Heijdra YF, van de Ven MJ, Mulder PG, Folgering HT. Survival of chronic hypercapnic COPD patients is predicted by smoking habits, comorbidity, and hypoxemia. Chest 2005; 127:1904–1910.
- Costello R, Deegan P, Fitzpatrick M, McNicholas WT. Reversible hypercapnia in chronic obstructive pulmonary disease: a distinct pattern of respiratory failure with a favorable prognosis. Am J Med 1997; 102:239–244.
- Banchero N. Cardiovascular responses to chronic hypoxia. Annu Rev Physiol 1987; 49:465–476.
- Chaouat A, Naeije R, Weitzenblum E. Pulmonary hypertension in COPD. Eur Respir J 2008; 32:1371–1385.
- Macnee W, Maclay J, McAllister D. Cardiovascular injury and repair in chronic obstructive pulmonary disease. Proc Am Thorac Soc 2008; 5:824–833.
- Kent BD, Mitchell PD, McNicholas WT. Hypoxemia in patients with COPD: cause, effects, and disease progression. Int J Chron Obstruct Pulmon Dis 2011; 6:199–208.
- Kim HC, Mofarrahi M, Hussain SN. Skeletal muscle dysfunction in patients with chronic obstructive pulmonary disease. Int J Chron Obstruct Pulmon Dis 2008; 3:637–658.
- Sandek K, Bratel T, Lagerstrand L, Rosell H. Relationship between lung function, ventilation-perfusion inequality and extent of emphysema as assessed by high-resolution computed tomography. Respir Med 2002; 96:934–943.
- Barbera JA, Roca J, Ferrer A, Mechanisms of worsening gas exchange during acute exacerbations of chronic obstructive pulmonary disease. Eur Respir J 1997; 10:1285–1291.
- Saure EW, Eagan TM, Jensen RL, Explained variance for blood gases in a population with COPD. Clin Respir J 2012; 6:72–80.
- Kim DK, Jacobson FL, Washko GR, Clinical and radiographic correlates of hypoxemia and oxygen therapy in the COPDGene study. Respir Med 2011; 105:1211–1221.
- Eagan TM, Ueland T, Wagner PD, Systemic inflammatory markers in COPD: results from the Bergen COPD Cohort Study. Eur Respir J 2010; 35:540–548.
- Pauwels R, Committee GOLD. Workshop Report: 2005 Update, of a 1998 NHLBI/WHO workshop. Global Strategy for Diagnosis, Management, and Prevention of COPD. 2005
- Eagan TM, Gabazza EC, D'Alessandro-Gabazza C, TNF-alpha is associated with loss of lean body mass only in already cachectic COPD patients. Respir Res 2012; 13:48.
- Cerveri I, Zoia MC, Fanfulla F, Reference values of arterial oxygen tension in the middle-aged and elderly. Am J Respir Crit Care Med 1995; 152:934–941.
- Tashkin DP, Celli B, Senn S, A 4-year trial of tiotropium in chronic obstructive pulmonary disease. N Engl J Med 2008; 359:1543–1554.
- Vestbo J, Edwards LD, Scanlon PD, Changes in forced expiratory volume in 1 second over time in COPD. N Engl J Med 2011; 365:1184–1192.
- Rodriguez-Roisin R, Drakulovic M, Rodriguez DA, Roca J, Barbera JA, Wagner PD. Ventilation-perfusion imbalance and chronic obstructive pulmonary disease staging severity. J Appl Physiol 2009; 106:1902–1908.
- O'Donnell DE, Parker CM. COPD exacerbations. 3: Pathophysiology. Thorax 2006; 61:354–361.
- Holley HS, Milic-Emili J, Becklake MR, Bates DV. Regional distribution of pulmonary ventilation and perfusion in obesity. J Clin Invest 1967; 46:475–481.
- Heindl S, Lehnert M, Criee CP, Hasenfuss G, Andreas S. Marked sympathetic activation in patients with chronic respiratory failure. Am J Respir Crit Care Med 2001;164:597-601.
- Volterrani M, Scalvini S, Mazzuero G, Decreased heart rate variability in patients with chronic obstructive pulmonary disease. Chest 1994; 106:1432–1437.
- Al-Ashkar F, Mehra R, Mazzone PJ. Interpreting pulmonary function tests: recognize the pattern, and the diagnosis will follow. Cleve Clin J Med 2003; 70:866, 868, 871–866,3, passim.
- Johannessen A, Lehmann S, Omenaas ER, Eide GE, Bakke PS, Gulsvik A. Post-bronchodilator spirometry reference values in adults and implications for disease management. Am J Respir Crit Care Med 2006; 173:1316–1325.
- Stocks J, Quanjer PH. Reference values for residual volume, functional residual capacity and total lung capacity. ATS Workshop on Lung Volume Measurements. Official Statement of The European Respiratory Society. Eur Respir J 1995; 8:492–506.