
Abstract
Introduction: Pulmonary hypertension (PH) is an indicator of poor prognosis in COPD patients; particularly in those with mean pulmonary artery pressure ≥ 40 mm Hg. Electrocardiography (ECG) might be useful for screening of this condition. Methods: Retrospective study of COPD patients evaluated for lung transplantation in whom we analyzed the 12-lead ECG performed closest to the time of right heart catheterization. Results: We included 142 patients. PH was present in 90 patients (63%) and 16 (11%) had a mean PAP ≥ 40 mmHg. The PR interval was longer in PH patients (151 (29) versus 139 (22) ms, p = 0.01) and T wave axis had a left shift (56.9 (32) versus 68.7 (19) degrees, p = 0.006). PR interval was longer (178.5 (35) versus 142.2 (23) ms, p = 0.001), T wave axis had a leftward deflection (63.6 (24) versus 42.8 (46) degrees, p = 0.005) and S wave in lead I was larger (0.19 (0.13) versus 0.12 (0.12) mV, p = 0.03) in patients with mean PAP ≥ 40 mmHg. A PR interval > 137 ms and S wave in DI > 0.02 mV had a sensitivity of 100% and a specificity of 59.5% to identify COPD patients with a mean PAP ≥ 40 mmHg. Conclusion: There are significant ECG differences between advanced COPD patients with and without PH; however the ECG is an inadequate tool to differentiate between the groups. A prolonged PR interval suggests the presence of severe PH.
| Abbreviations | ||
| CI: confidence interval, COPD: chronic obstructive pulmonary disease, ECG: electrocardiogram, FEV1: forced expiratory volume in the first second, FVC: forced vital capacity, IQR: inter-quartile range, LAS: lung allocation score, PAP: pulmonary artery pressure, PAOP: pulmonary artery occlusion pressure, PH: pulmonary hypertension. | = | |
Introduction
Chronic obstructive pulmonary disease (COPD) is a respiratory condition characterized by airflow limitation that affects between 4% to 10% of the population and is associated with high morbidity and mortality (Citation1–3). In fact, COPD is the fifth leading cause of death in high-income countries and the sixth major cause of mortality in low to middle income countries (Citation3). Different clinical factors have been associated with poor prognosis in patients with COPD (Citation4) including pulmonary hypertension (PH) (Citation5,6).
Indeed, the 5-year survival in COPD patients receiving long-term oxygen therapy was lower for those who had a mean pulmonary artery pressure (PAP) > 25 mm Hg7. In addition, COPD patients with PH have an increased risk of acute respiratory exacerbations (Citation8) and lower functional capacity (as measured by a shorter 6-minute walk distance) than COPD patients without PH, even after controlling for severity of airflow obstruction and other clinical factors (Citation9,10). Because PH is an indicator of poor prognosis in COPD patients; particularly in those with a mean PAP ≥ 40 mmHg5, it is important to routinely screen for this hemodynamic condition in the adequate setting.
Doppler echocardiography is the traditional screening test used for PH screening; however this methodology has important limitations (Citation11) in COPD patients with advanced disease (Citation12,13). In fact, the estimation of right ventricular systolic pressure in COPD patients is only possible in 38% of them and frequently varies by more than 10 mm Hg when compared to measures obtained during right heart catheterization (Citation13). Unlike echocardiography, electrocardiography (ECG) is widely available and relative inexpensive. A recent study in patients suspected of having precapillary PH suggested that right ventricular strain on the ECG helps identify patients with this condition (Citation14).
In patients with COPD, the ECG can demonstrate characteristic findings () suggesting the presence of right ventricular (RV) hypertrophy and chronic cor pulmonale (Citation15). However, the ECG findings may be late (Citation16) and not always reliable for this diagnosis (Citation17) due to their poor sensitivity (Citation18–21). ECG abnormalities are more commonly seen in COPD patients than age-matched controls and their prevalence increases with severity of pulmonary obstruction (Citation22). We hypothesized that some of the ECG abnormalities observed in COPD patients with advanced disease are due to the development of PH. The 12-lead ECG could be a useful tool in identifying PH or more importantly severe PH (Citation5) in these individuals. Therefore, we studied the ECGs in a cohort of COPD patients listed for lung transplant and compared the findings observed in subjects with or without PH. Furthermore, we related the ECG characteristics with hemodynamic findings obtained during right heart catheterization.
Table 1. ECG findings described in patients with emphysema
Methods
This retrospective study was approved by the Cleveland Clinic Institutional Review Board (study number 12-045). Written informed consent was waived. We included COPD patients evaluated for lung transplantation who had a 12-lead ECG available for review between Nov 2004 and Aug 2011.
Patients were identified from the Cleveland Clinic Lung Transplantation Registry. This registry contained data on the transplant evaluation date, demographics, oxygen need, lung allocation score (LAS) (Citation23), spirometry results (normal values based on reference (Citation24)), echocardiographic and hemodynamic data. We reviewed the patients’ medical records for additional information and to assess whether they were receiving any medication that could affect the electrocardiographic recording. Furthermore, we measured the pulmonary artery diameter and the ratio between the pulmonary artery and aorta diameters, using the computed tomography of the chest performed at the time of the evaluation.
We analyzed the ECG performed prior to lung transplantation, closest to the time of right heart catheterization. All 12-lead ECGs (Citation10-second recording) were performed by certified technicians in supine position (Muse Network Series system; Marquette Electronics; Milwaukee, WI, USA). ECGs were acquired using a paper speed of 25 mm/s, a sensitivity of 1 mV = 10 mm and standardized protocols to minimize lead misplacement and motion artifact. We used rulers and calipers for ECG measurements. In cases of irregular cardiac rhythm such as atrial fibrillation or flutter with variable atrioventricular conduction, we averaged at least 3 beats for each ECG determination.
Two investigators blinded to clinical data reviewed all ECGs independently (L.A. and M.B). Additional data included the ECG date, cardiac rhythm, heart rate, PR interval, QRS duration, QT and QT interval corrected for heart rate by Bazett's formula (QTc) (Citation25), P axis, QRS axis, T wave axis, P wave in lead II and V1, R wave in lead I, V1 and V6, S wave in lead I, V1 and V6 and calculated R/S ratios in lead I, V1 and V6. We assessed the QRS morphology in lead V1 and determined whether patients had complete or incomplete right bundle branch block, qR, QS, qrS or R pattern in V1.
We recorded whether subjects had T wave inversion or ST segment depression in inferior and/or V1-V3 precordial leads. The intraclass correlation coefficient between raters was 0.74 (0.63–0.81) for P wave in V1, 0.62 (0.46–0.74) for R wave amplitude in V1 and 0.95 ≠(0.93–0.97) for S wave in V1. Other determinations measured by the ECG system (e.g. PR interval, QT interval, etc.) had excellent correlation coefficients (> 0.90) between the two raters. The relatively low intraclass correlation coefficient, in the R wave amplitude in V1, was due to the measurement of either R or R′ by the operators. For the present study, we only considered the tallest R wave in V1 (irrespectively of whether this wave was the R or R′). A third investigator (AT) remeasured all the ECG parameters that substantially differed between the ≠investigators.
Right heart catheterization was performed following standard protocols. The studies were done using supplemental oxygen to keep the pulse oximetry saturation at 90% or above. Whenever possible, we maintained the same oxygen flow as patients used at home. Pressure waves were recorded and end-expiratory values obtained. Pulmonary hypertension was considered present when the mean PAP was ≥ 25 mmHg (Citation26). Elevated pulmonary artery occlusion pressure (PAOP) was defined as a value > 15 mm Hg. Pulmonary vascular resistance was obtained by dividing the transpulmonary gradient (mean PAP – PAOP) over the cardiac output obtained by thermodilution.
Statistical analysis
Continuous variables were summarized using mean and standard deviation or median and interquartile range (IQR) when appropriate. Interrater agreement for single measures was calculated using the intraclass correlation coefficient and its respective 95% confidence intervals. We compared numerical variables using t-test and categorical variables with Fischer's exact test. We applied the Pearson correlation to evaluate associations between continuous variables. When indicated we adjusted ECG measurements by the use of calcium channel blockers and beta blockers using analysis of covariance.
We performed receiver operating characteristic analysis to investigate the area under the curve (AUC) with its 95% confidence interval and determine the sensitivity and specificity of different cut-points of the ECG parameters of interest. We developed models using CART (classification and regression tree) binary recursive partitioning with V-fold cross-validation, in which the parent nodes are exactly split into two nodes in a recursive manner until the tree is terminated and each terminal node is assigned to a class outcome. We included categorical and continuous data in the CART models. We determine variable importance with the use of Random Forests (500 trees built using 5 predictors for each node).
We used binary logistic regression to test variables either alone or in combination that could predict the presence of PH or mean PAP ≥ 40 mmHg in COPD patients. Binary logistic regression results are given as odds ratio (95% confidence interval). Survival was assessed by Kaplan-Meier methodology. The start point was the date of the lung transplant evaluation and the end of follow-up was marked by the patient's death, transplantation or end of the study. Cox proportional hazards modeling, either univariate or adjusted by LAS, was used to examine the relationship between survival and selected ECG variables. All the p values were reported as two-tailed. A p value of <0.05 was prespecified as indicative of statistical significance. The statistical analyses were performed using the statistical package SPSS, Version 20 (IBM; Armonk, NY, USA) and CART version 7.0 (Salford Systems, California, USA).
Results
Patient characteristics
We included 142 patients with a mean (standard deviation) age of 59 (Citation7) years. Eighty-four (59%) were male. The averaged (SD) lung allocation score at listing was 33 (5)), forced vital capacity (FVC) percentage of predicted was 55 (17)% and forced expiratory volume in 1 sec (FEV1) percentage of predicted was 22 (13)%. All patients used oxygen (O2 flow at rest: 2 (2) L/min) (). Pulmonary hypertension was present in 90 patients (63%). Patients with PH had similar age, gender and spirometric values but used a higher O2 flow either at rest or during activities than patients without PH (). By echocardiography, right ventricular (RV) dysfunction (from mild to severe) was observed in 8 (15%) of COPD patients without PH and in 23 (26%) of those with PH (p = 0.06). The degree of RV dysfunction was only mild in individuals without PH but vary from mild to severe in those with PH ().
Table 2. Patient characteristics
Comparison of ECG characteristics between patients without and without PH
The median (IQR) length of time from the ECG to right heart catheterization was 0.5 (0–8) months. The majority of COPD individuals were in normal sinus rhythm (n = 134, 95%). We noted (see ) that the PR interval was longer (even when adjusting for treatments that can affect this interval), the R wave in lead I was taller, the T wave axis had a leftward shift and incomplete right bundle branch block was more common in COPD patients with PH compared to those without PH ( and e-). The AUC (95% CI) for PR interval, R wave and T wave axis to discriminated between patients with and without PH were 0.62 (0.53–0.72), 0.62 (0.52–0.72) and 0.63 (0.53–0.72), respectively.
Figure 1. Electrocardiographic characteristics of COPD patients without and with PH.Panel A corresponds to the ECG of a COPD patient without PH (mean PAP 17 mm Hg, heart rate 81 bpm, PR interval 124 ms, QRS complex duration 76 ms, QTc interval 401 ms, QRS axis + 37° and T wave axis + 70°). Panel B shows the ECG of a COPD patient with PH (mean PAP 65 mmHg, heart rate 63 bpm, PR interval 216 ms, QRS complex duration 84 ms, QTc interval 409 ms, QRS axis + 72° and T wave axis – 22°). In the ECG of the COPD patient with PH (panel B) the PR interval (PR) is longer, the P wave (P) in V1 and the S wave in lead I are of larger amplitude. In addition, there are negative T waves in the inferior leads (*).
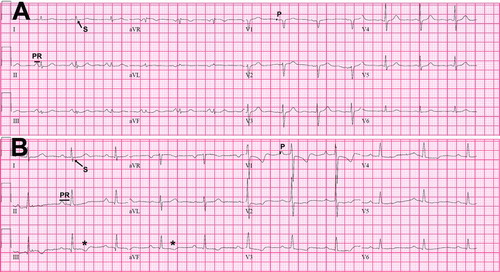
Table 3. Electrocardiographic variables
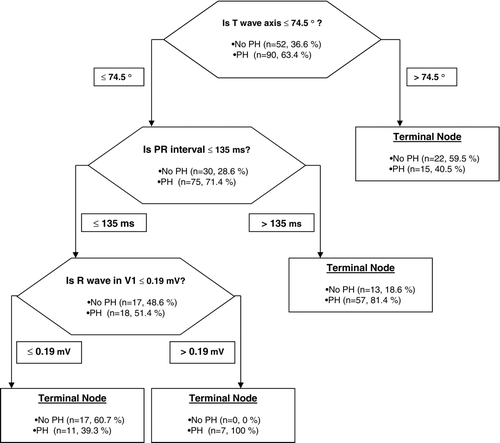
The odds ratio (95% confidence interval) of the PR interval (every 10 ms) to predict the presence of PH was 1.2 (1.04–1.41). This result did not change when adjusting for the use of beta blocker or calcium channel blocker. CART analysis is shown in . Random forests analysis identified T wave axis, PR interval and S wave amplitude in V6 as the variables with the highest relative importance score for adequate classification (100, 78.5 and 75.7, respectively). In multivariate analysis, only PR interval remained a significant predictor of PH.
Figure 2. Hierarchical binary recursive partitioning algorithm to predict the presence of PH in COPD patients.The model correctly classified 64 out of 90 (71.1%) PH patients, and 39 out of 52 (75%) patients without PH. The model precision was 83.1% with an AUC by ROC of 0.74.
The best non-hemodynamic variable (from ) that discriminated between patient with and without PH was the diameter of the pulmonary artery (OR (95% CI) per 1 mm increase: 1.39 (1.2–1.6)). None of the ECG variables predicted the presence of PH when added to the binary model that included pulmonary artery diameter. A CART analysis including pulmonary artery diameter and PR interval for the ≠identification of patients with COPD and PH is shown in e-.
Comparison of ECG characteristics between COPD patients with mean PAP < 40 mmHg and those with mean PAP ≥ 40 mmHg
A total of 16 (11%) COPD patients had a mean PAP ≥ 40 mmHg. Four were on PH-specific therapies (two on sildenafil and two on bosentan). The PR interval was longer in patients with mean PAP ≥ 40 mmHg than those with mean PAP < 40 mmHg (178.5 (35) versus 142.2 (23) ms, p = 0.001) (). The use of calcium channel blockers and beta blockers was not different between the COPD with or without PH (p = 0.5 and p = 0.7, respectively).
Table 4. Electrocardiographic variables in COPD patients with mean PAP < 40 or ≥ 40 mmHg
The QRS complex duration was longer, T wave axis had a leftward deflection, S wave amplitude in lead I was larger, P wave amplitude in V1 was taller and negative T waves in the inferior leads were more common in patients with mean PAP ≥ 40 mmHg. When mean PAP ≥ 40 mmHg was used as the state variable, the ROC curve for PR interval showed an AUC of 0.81 (0.71–0.91). The AUC (95% CI) for QRS complex duration, T wave axis, S wave amplitude in lead I and P wave amplitude in V1 were 0.65 (0.51–0.8), 0.66 (0.51–0.82), 0.69 (0.55–0.83) and 0.69 (0.55–0.83), respectively.
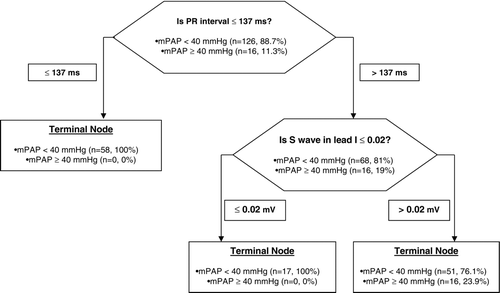
A PR interval of ≥160 ms had a sensitivity of 50% and a specificity of 81%, meanwhile a cutoff of 180 ms had a sensitivity of 44% with specificity of 93.4% for the distinction between patients with mean PAP < 40 or ≥ 40 mmHg. The odds ratio (95% confidence interval) of the PR interval (every 10 ms) to predict the presence of a mean PAP ≥ 40 mm Hg was 1.5 (1.3-1.9). This result did not change when adjusting for the use of beta blocker or calcium channel blocker. CART analysis is shown in . Random forests analysis noted that PR interval and S wave amplitude in lead I were the variables with the highest relative importance as splitters (100 and 42.8, respectively). Only PR interval remained a significant predictor of the presence of PH in multivariate analysis, when the pulmonary artery diameter was included in the model (CART analysis shown in e-).
Figure 3. Hierarchical binary recursive partitioning algorithm to predict mean PAP ≥ 40 mmHg in COPD patients.The model correctly classified the 16 COPD patients (100%) with mean PAP ≥ 40 mmHg and 75 out of 126 (59.5%) patients who had a mean PAP < 40 mmHg. The model precision was 24% with an AUC by ROC of 0.80. Abbreviations: mPAP: mean pulmonary artery pressure.
We also compared the ECG characteristics in COPD patients with PH who had a pulmonary vascular resistance < 3 Wood units (n = 51, 57%) or ≥ 3 Wood units (n = 39, 43%). The P and QRS axis were deflected rightward and the R waves in lead I and V6 were smaller in those with higher pulmonary vascular resistance ().
Table 5. Electrocardiographic variables in COPD patients with PH and a PVR < 3 or ≥ 3 Wood Units
Comparison of ECG characteristics in COPD patients with pulmonary artery occlusion pressure ≤ 15 versus > 15 mmHg
A total of 42 (29.6%) patients had a pulmonary artery occlusion pressure (PAOP) > 15 mmHg. R wave amplitude in lead I (0.42 versus 0.31, p = 0.003) and P wave amplitude in V1 (p = 0.09 versus 0.07, p = 0.007) were larger in patients with elevated PAOP. The AUC was 0.70 (0.6–0.8) and 0.6 (0.5–0.71), respectively.
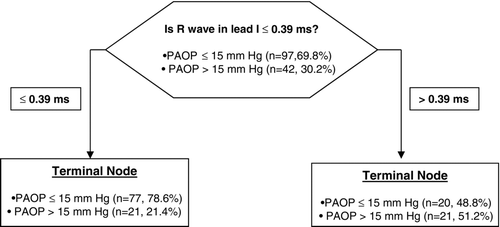
R wave amplitude of ≥ 0.4 had a sensitivity of 52% and a specificity of 81%, meanwhile R wave amplitude ≥ 0.5 had a sensitivity of 28% but a specificity of 91% to differentiate between groups. With binary logistic regression the odds ratio (95% confidence interval) of R wave in lead I (per 0.1 mV) to predict an elevated PAOP was 1.5 (1.2–1.8). CART analysis is shown in . Random forests analysis observed that R wave amplitude in lead I and S wave amplitude in V1 were the variables with the highest relative importance as primary splitters (100 and 37.9, respectively). However, only R wave amplitude in lead I remained a significant predictor of elevated PAOP in multivariate analysis.
Figure 4. Hierarchical binary recursive partitioning algorithm to predict PAOP > 15 mmHg in COPD patients.The model correctly classified 21 out of 42 COPD patients (50%) with a PAOP > 15 mmHg and 77 out of 97 (79.4%) patients who had a PAOP ≤ 15 mmHg. The model precision was 51.2% with an AUC by ROC of 0.65. Abbreviations: PAOP: pulmonary artery occlusion pressure.
Association of ECG measurements with echocardiographic and hemodynamic parameters
Right atrial pressure was associated with R wave amplitude in lead I (R = 0.24, p = 0.006), R wave amplitude in V6 (R = 0.27, p = 0.002) and T wave axis (R = –0.27, p = 0.002). Mean PAP was associated with PR interval (R = 0.43, p < 0.001), QRS duration (R = 0.18, p = 0.03), T wave axis (R = –0.30, p < 0.001), R wave amplitude in lead I (R = 0.2, p = 0.01) and P wave amplitude in V1 (R = 0.27, p = 0.002). PAOP was associated with PR interval (R = 0.21, p = 0.01), R wave amplitude in DI (R = 0.33, p < 0.001) and V6 (R = 0.26, p = 0.002), P wave amplitude in V1 (R = 0.29, p = 0.001) and T wave axis (R = –0.25, p = 0.003). Pulmonary vascular resistance was associated with PR interval (R = 0.22, p < 0.02) and S wave amplitude in lead I (R = 0.19, p = 0.03). Right ventricular dysfunction was associated with PR interval (R = 0.21, p = 0.02), QRS complex duration (R = 0.19, p = 0.03), P wave amplitude in V1 (R = 0.28, p = 0.001) and S wave amplitude in lead I (R = 0.2, p = 0.02).
ECG determinations and mortality in the lung transplant list
A total of 33 (23%) patients were alive at the end of the study, 19 (13%) died after being listed and 90 (63%) were transplanted. When censored by lung transplantation and end of follow up, the median survival on the transplant list was 64 (95% CI: 55–73) months. Using Cox regression, no ECG determination significantly predicted death. PR interval (per 10 ms) had a hazard ratio (HR) (95% CI) for mortality of 1.17 (0.97–1.4), p = 0.09; P wave in V1 (per 0.1 mV) had a HR (95% CI) of 2.8 (0.94–8.1), p = 0.07 and R/S ratio in V1 had a HR (95% CI) of 1.49 (0.95–2.3), p = 0.08. These trends disappeared when the model was adjusted for the LAS score.
Discussion
In the present study, we observed several electrocardiographic differences between patients with severe COPD with PH versus those without PH as determined by right heart catheterization. We noted ECG features that suggest the presence of a mean PAP of ≥ 40 mm Hg or PAOP > 15 mmHg. Furthermore, we found several associations between ECG determinations and hemodynamic parameters. Overall the 12-lead ECG lacks sensitivity to diagnose PH and the hemodynamic associations are not robust enough to replace other noninvasive methodologies; however a prolonged PR interval duration helps identify COPD patients with severe PH.
Electrocardiographic changes have been previously reported in COPD patients with cor pulmonale diagnosed clinically or during an autopsy (Citation16, 17, Citation27–29). The ECG findings suggestive of right ventricular ≠hypertrophy occur late in the course of the disease (Citation16) and are difficult to differentiate from the rotational changes or electrical insulating effects caused by the hyperinflated lungs (Citation17, Citation30). Traditional ECG determinations may not be adequate to determine RV involvement in COPD as most of the ECG findings may be related to COPD () instead of PH (Citation16, Citation22, Citation31).
Limited information exists on the ECG differences between COPD patients with or without cor pulmonale (Citation16, Citation27). No studies have been performed to identify whether patients with advanced COPD have ECG differences based on the presence of PH diagnosed by right heart catheterization, which is the gold-standard diagnostic tool. Given that PH is an indicator of poor prognosis in COPD and that ECG is widely available, certain ECG characteristics of end-stage COPD patients could suggest the presence of PH.
We found that the PR interval was longer in COPD patients with PH and associated with mean PAP, ≠pulmonary vascular resistance and right ventricular function; even when adjusted for medications known to prolong this interval. A prolonged PR interval was the only ECG variable that remained a significant predictor of the presence of a mean PAP ≥ 40 mmHg when added to the pulmonary artery diameter. This suggests that the delay in the atrio-ventricular conduction was motivated by right cardiac pressure overload. In support of our findings, Veldtman et al. (Citation32) noted a reduction in the PR interval after percutaneous closure of moderate sized atrial septal defects in adults.
Dittrich et al. also observed a reduction in the PR interval after thromboendarterectomy for chronic thromboembolic PH (Citation33). In these two studies, the shortening of the PR interval could be due to a better atrio-ventricular conduction after the right heart chambers had a decrease in volume and/or pressure after the interventions (Citation32). Another attractive hypothesis suggests a common link between PR prolongation and PH. A genome-side association study of PR interval (Citation34) identified CAV1 among the genes involved in atrio-ventricular conduction. CAV1 encodes the caveolin-1, a protein necessary for the development of caveolae, which are involved in cardiac signal transduction. Interestingly, mice deficient in CAV1 develop PH (Citation35).
Al-Naamani et al. (Citation36) showed that an R wave in lead I less than 2 mm had a positive predictive value of 82% in diagnosing PH. In our study, R wave amplitude in lead I was larger in COPD patients with PH but smaller in those with a PVR > 3 Wood Units. This puzzling finding is explained by a direct association between R wave amplitude in lead I and PAOP. Therefore, in patients with COPD, a larger R wave amplitude in lead I is supportive of pulmonary venous hypertension.
Using CART analysis () we identified the T wave axis as the variable with the highest relative importance score to differentiate COPD patients with and without PH. Those with PH had a leftward deflection of the T wave axis. In support of this selection, Henkens et al. (Citation37) observed that in PH patients with an elevated pulmonary vascular resistance had a leftward deviation of the T wave axis.
We also observed that incomplete right bundle branch block was more common in COPD patients with PH than those without. Other authors reported the presence of right bundle branch block in patients with advanced COPD related to a chronically increased right ventricular pressure (Citation22). Likewise, Selvester et al. (Citation27) found that the rSr’ pattern was characteristic of right ventricular overload since this hemodynamic condition produces anterior and rightward displacement of the middle and terminal QRS forces.
More important than the recognition of PH in COPD patients is the identification of those subjects with the so called ìdisproportionalî or ìsevereî elevation of the mean PAP (≥ 40 mmHg), since they have worse prognosis and could be candidates for specific-PAH therapies (Citation5). These patients probably have a different phenotype or concomitant idiopathic pulmonary arterial hypertension (Citation5). In our study, we found that COPD patients with a mean PAP ≥ 40 mmHg had a taller P wave in lead V1, prolonged PR interval and QRS duration, larger S wave amplitude in lead I and leftward deviation of the T wave axis. QRS duration was directly associated with mean PAP and right ventricular dysfunction. Similarly, Sun et al. (Citation38) found that QRS complex prolongation was directly associated with worse functional class, enlargement of right-sided cardiac chambers and mortality in patients with idiopathic pulmonary arterial hypertension. A larger S wave amplitude in lead I has been previously associated with right ventricular hypertrophy and elevated mean PAP in COPD patients (Citation39).
This study has limitations:
we cannot exclude the possibility of failing to reject a false null hypothesis (type 2 error); however we consider that our sample size (n = 142) is adequate and any potentially missed statistical difference is likely of no major clinical relevance;
our results are derived from patients seen at a tertiary-care center and are only applicable to subjects with advanced COPD evaluated for lung transplantation;
ECG determinations did not predict mortality, in part due to the low number of patients that died in our study (13%);
the time interval between RHC and ECG was shorter in COPD patients with PH; however the ECG difference observed between the groups persisted after making this time variable even between the groups.
Despite these limitations the study main strengths are: firstly, this is the first investigation that focused on assessing whether ECG characteristics are different in patients with advanced COPD with or without PH; secondly, PH was diagnosed by RHC and the ECG was performed close to this procedure and thirdly, all ECG determinations were obtained independently by two investigators.
In summary, the 12-lead ECG (Citation40) and traditional ECG measurements had no more than moderate correlation with clinical or hemodynamic status in these patients (Citation40,41). Nevertheless, a PR interval ≥ 180 ms has a high specificity for the detection of COPD patients with mean PAP ≥ 40 mmHg. Interestingly, an R wave amplitude in DI more than 0.5 had a high specificity for the identification of COPD patients with PAOP > 15 mmHg. A prospective study comparing the ECG characteristics immediately before and at different intervals after lung transplantation, would be of great value to determine whether some of the ECG findings identified in this study, revert after lung transplantation.
Conclusions
Patients with advanced COPD who develop PH had electrocardiographic differences when compared to those without PH; however the ECG is an inadequate tool to differentiate between the groups and lacks sensitivity. A prolonged PR interval and a taller R wave in lead I may suggest the presence of severe PH and an elevated pulmonary artery occlusion pressure.
Funding sources
This publication was made possible by CTSA KL2 [Grant # RR024990] (A.R.T.) from the National Center for Research Resources (NCRR), a component of the National Institutes of Health (NIH), and NIH Roadmap for Medical Research.
Declaration of Interests Statement
The authors have no significant conflicts of interest with any companies or organization whose products or services may be discussed in this article.
Laith Alkukhun, Manfred Baumgartner, Marie Budev, and Raed A. Dweik participated in the design of the study, interpretation of the results and critical revision of the manuscript for important intellectual content and final approval of the manuscript submitted. Adriano R. Tonelli, participated in the design of the study, data collection, statistical analysis, interpretation of the results, writing and critical revision of the manuscript for important intellectual content and final approval of the manuscript submitted. Dr. Tonelli is the guarantor of the paper, taking responsibility for the integrity of the work as a whole, from inception to published article.
Supplementary materials are available in the online version of this article.
References
- Ranieri VM, Rubenfeld GD, Thompson BT, Acute respiratory distress syndrome: the Berlin Definition. JAMA 2012; 307:2526–2533.
- Halbert RJ, Isonaka S, George D, Interpreting COPD prevalence estimates: what is the true burden of disease? Chest 2003; 123:1684–1692.
- Mannino DM, Buist AS. Global burden of COPD: risk factors, prevalence, and future trends. Lancet 2007; 370:765–773.
- Dolan S, Varkey B. Prognostic factors in chronic obstructive pulmonary disease. Curr Opin Pulm Med 2005; 11:149–152.
- Hurdman J, Condliffe R, Elliot CA, Pulmonary hypertension in COPD: results from the ASPIRE registry. Eur Respir J 2013; 41:1292–1301.
- Shujaat A, Bajwa AA, Cury JD. Pulmonary hypertension secondary to COPD. Pulm Med 2012; 203952.
- Oswald-Mammosser M, Weitzenblum E, Quoix E, Prognostic factors in COPD patients receiving long-term oxygen therapy. Importance of pulmonary artery pressure. Chest 1995; 107:1193–1198.
- Kessler R, Faller M, Fourgaut G, Predictive factors of hospitalization for acute exacerbation in a series of 64 patients with chronic obstructive pulmonary disease. Am J Respir Crit Care Med 1999; 159:158–164.
- Sims MW, Margolis DJ, Localio AR, Impact of pulmonary artery pressure on exercise function in severe COPD. Chest 2009; 136:412–419.
- Cuttica MJ, Kalhan R, Shlobin OA, Categorization and impact of pulmonary hypertension in patients with advanced COPD. Respir Med 2010; 104:1877–1882.
- Fisher MR, Forfia PR, Chamera E, Accuracy of Doppler echocardiography in the hemodynamic assessment of pulmonary hypertension. Am J Respir Crit Care Med 2009; 179:615–621.
- Andersen CU, Mellemkjaer S, Nielsen-Kudsk JE, Echocardiographic screening for pulmonary hypertension in stable COPD out-patients and NT-proBNP as a rule-out test. COPD 2012; 9:505–512.
- Arcasoy SM, Christie JD, Ferrari VA, Echocardiographic assessment of pulmonary hypertension in patients with advanced lung disease. Am J Respir Crit Care Med 2003; 167:735–740.
- Bonderman D, Wexberg P, Martischnig AM, A noninvasive algorithm to exclude pre-capillary pulmonary hypertension. Eur Respir J 2011; 37:1096–1103.
- Incalzi RA, Fuso L, De Rosa M. Electrocardiographic signs of chronic cor pulmonale: a negative prognostic finding in chronic obstructive pulmonary disease. Circulation 1999; 99:1600–1605.
- Kilcoyne MM, Davis AL, Ferrer MI. A dynamic electrocardiographic concept useful in the diagnosis of cor pulmonale. Result of a survey of 200 patients with chronic obstructive pulmonary disease. Circulation 1970; 42:903–924.
- Burch GE, Depasquale NP. The electrocardiographic diagnosis of pulmonary heart disease. Am J Cardiol 1963; 11:622–638.
- Scott RC. The electrocardiographic diagnosis of right ventricular hypertrophy: correlation with the anatomic findings. Am Heart J 1960; 60:659–661.
- Roman GT, Jr., Walsh TJ, Massie E. Right ventrical hypertrophy. Correlation of electrocardiographic and anatomic findings. Am J Cardiol 1961; 7:481–487.
- Flowers NC, Horan LG. Hypertrophy and infarction: subtle signs of right ventricular enlargement and their relative importance. In: Schlant RC, Hurst JW, eds. Advances in Electrocardiography. Orlando: Grune & Stratton 1972.
- Prakash R. Echocardiographic diagnosis of right ventricular hypertrophy: correlation with ECG and necropsy findings in 248 patients. Cathet Cardiovasc Diagn 1981; 7:179–184.
- Warnier MJ, Rutten FH, Numans ME, Electrocardiographic characteristics of patients with chronic obstructive pulmonary disease. COPD 2013; 10:62–71.
- Egan TM, Murray S, Bustami RT, Development of the new lung allocation system in the United States. Am J Transplant 2006; 6:1212–1227.
- Hankinson JL, Odencrantz JR, Fedan KB. Spirometric reference values from a sample of the general U.S. population. Am J Respir Crit Care Med 1999; 159:179–187.
- Bazett HC. An analysis of the time-relations of electrocardiograms. Heart 1920; 7:353–370..
- Badesch DB, Champion HC, Sanchez MA, Diagnosis and assessment of pulmonary arterial hypertension. J Am Coll Cardiol 2009; 54:S55–66.
- Selvester RH, Rubin HB. New criteria for the electrocardiographic diagnosis of emphysema and cor pulmonale. Am Heart J 1965; 69:437–447.
- Kilpatrick JA. Electrocardiographic changes in chronic cor pulmonale. Br Heart J 1951; 13:309–318.
- Phillips RW. The electrocardiogram in cor puimonale secondary to pulmonary emphysema: a study of 18 cases proved by autopsy. Am Heart J 1958; 56:352–371.
- Scott RC. The electrocardiogram in pulmonary emphysema and chronic cor pulmonale. Am Heart J 1961; 61:843–845.
- Fowler NO, Daniels C, Scott RC, The electocardiogram in cor pulmonale with and without emphysema. Am J Cardiol 1965; 16:500–505.
- Veldtman GR, Razack V, Siu S, Right ventricular form and function after percutaneous atrial septal defect device closure. J Am Coll Cardiol 2001; 37:2108–2113.
- Dittrich HC, Chow LC, Nicod PH. Early improvement in left ventricular diastolic function after relief of chronic right ventricular pressure overload. Circulation 1989; 80:823–830.
- Pfeufer A, van Noord C, Marciante KD, Genome-wide association study of PR interval. Nat Genet 2010; 42:153–159.
- Zhao YY, Liu Y, Stan RV, Defects in caveolin-1 cause dilated cardiomyopathy and pulmonary hypertension in knockout mice. Proc Natl Acad Sci U S A 2002; 99:11375–11380.
- Al-Naamani K, Hijal T, Nguyen V, Predictive values of the electrocardiogram in diagnosing pulmonary hypertension. Int J Cardiol 2008; 127:214–218.
- Henkens IR, Gan CT, van Wolferen SA, ECG monitoring of treatment response in pulmonary arterial hypertension patients. Chest 2008; 134:1250–1257.
- Sun PY, Jiang X, Gomberg-Maitland M, Prolonged QRS duration: a new predictor of adverse outcome in idiopathic pulmonary arterial hypertension. Chest 2012; 141:374–380.
- Schuren KP, Huttemann U. Effect of respiratory and hemodynamic abnormalities on the electrocardiogram in chronic obstructive lung disease. Respiration 1973; 30:234–245.
- Ahearn GS, Tapson VF, Rebeiz A, Electrocardiography to define clinical status in primary pulmonary hypertension and pulmonary arterial hypertension secondary to collagen vascular disease. Chest 2002; 122:524–527.
- Kanemoto N. Electrocardiographic and hemodynamic correlations in primary pulmonary hypertension. Angiology 1988; 39:781–787.
- Spodick DH. Electrocardiographic studies in pulmonary disease. II. Establishment of criteria for the electrocardiographic inference of diffuse lung diseases. Circulation 1959; 20:1073–1074.
- Wasserburger RH, Kelly JR, Rasmussen HK, The electrocardiographic pentalogy of pulmonary emphysema. A correlation of roentgenographic findings and pulmonary function studies. Circulation 1959; 20:831–841.