
Abstract
Magnetic resonance imaging (MRI) may provide attractive biomarkers for assessment of pulmonary disease in clinical trials as it is free from ionizing radiation, minimally invasive and allows regional information. The aim of this study was to characterize lung MRI T1 relaxation time as a biomarker of chronic obstructive pulmonary disease (COPD); and specifically its relationship to smoking history, computed tomography (CT), and pulmonary function test (PFT) measurements in comparison to healthy age-matched controls. Lung T1 and inter-quartile range (IQR) of T1 maps from 24 COPD subjects and 12 healthy age-matched non-smokers were retrospectively analyzed from an institutional review board approved study. The subjects underwent PFTs and two separate MR imaging sessions at 1.5 tesla to test T1 repeatability. CT scans were performed on the COPD subjects. T1 repeatability (intraclass correlation coefficient) was 0.72 for repeated scans acquired on two visits. The lung T1 was significantly shorter (p < 0.0001) and T1 IQR was significantly larger (p = 0.0002) for the COPD subjects compared to healthy controls. Lung T1 significantly (p = 0.001) correlated with lung density assessed with CT. Strong significant correlations (p < 0.0001) between lung T1 and all PFT measurements were observed. Cigarette exposure did not correlate with lung T1 in COPD subjects. In conclusion, lung MRI T1 mapping shows potential as a repeatable, radiation free, non-invasive imaging technique in the evaluation of COPD.
Introduction
Chronic obstructive pulmonary disease (COPD) is a heterogeneous lung disease that is a major cause of morbidity and mortality. The Global Obstructive Lung Disease (GOLD) guidelines characterize COPD by limitation of airflow, tissue destruction and an abnormal inflammatory response, most often caused by cigarette smoking (Citation1). Characterization of COPD relies on spirometry based pulmonary function test (PFT) measurements, such as forced expiratory volume in 1 s (FEV1). PFTs are inexpensive, relatively easy to perform and therefore commonly used in clinical trials. However, these methods only measure global lung function, resulting in a loss of sensitivity in early/mild disease (Citation2, Citation3). The discrepancy between spirometric measurements and COPD symptoms, as well as the nonspecific differentiation of lung disorders, is motivating the development of novel techniques to obtain regional lung function information and improved disease characterization (Citation1, Citation4–Citation6). Improved disease characterisation will allow the use of personalised medicine approaches to COPD treatment, an emerging field in which imaging biomarkers are likely to play an important role (Citation7).
Regional biomarkers of emphysema in COPD lungs can be obtained from computed tomography (CT) (Citation8) or single-photon emission computed tomography (SPECT) (Citation9). The clinical benefits of CT and SPECT for diagnosis of COPD clearly outweigh the potential harmful effects due to ionizing radiation. However for clinical trials, particularly those including a placebo cohort, repeated exposure to ionizing radiation needs to be considered carefully given that there may be no clinical benefit of the examination to the patient. Magnetic resonance imaging (MRI) may provide attractive biomarkers for assessment of pulmonary disease in clinical trials as it is free from ionizing radiation, minimally invasive and allows regional information (Citation10–Citation12).
Lung MRI has well-known limitations because of the low density of the lung and the fast signal decay due to susceptibility differences between tissue and air in lung parenchyma. Nevertheless, several lung MRI applications have been developed and interest in MRI of the lungs has recently increased (Citation10–Citation12). One technique is oxygen-enhanced MRI, in which regional and global lung function can be assessed by measuring MR signal before and after a challenge with oxygen (Citation13–Citation17). The lung water proton longitudinal relaxation time (subsequently called T1), a tissue specific MRI biomarker, is affected by interactions of water with macromolecules (Citation18) and paramagnetic agents such as molecular oxygen (Citation13). Moreover, T1 measurements of the lung have been used to enable lung perfusion measurements using MRI contrast agents and to measure regional partial pressure of oxygen in the alveolar airspaces using hyperpolarised gases (Citation10, Citation16, Citation19).
However, only a small number of studies have published data on changes in native T1 in emphysema and fibrosis patients relative to healthy controls (Citation20, Citation21). Little is known about lung T1 for different GOLD stage defined COPD patients, especially in relation to well-established markers such as smoking history, CT and PFTs. In contrast to other studies of T1 in the lungs (Citation20, Citation21), we have enrolled subjects with both moderate and severe COPD, have age-matched controls, included smoking history, added CT lung density scans and complete PFT information.
The objective for our study, therefore, was to test T1 repeatability and characterize the lung T1 relationship to smoking history, CT density scans and systematically performed PFTs in moderate and severe GOLD stage defined COPD subjects and healthy age-matched controls.
Materials and Methods
Subjects and study design
Lung T1 measurements from 24 COPD subjects and 12 healthy age-matched non-smokers () were retrospectively analyzed from an institutional review board-approved single center lung MRI study conducted in Manchester, United Kingdom. All COPD subjects were current or former smokers; 12 subjects with moderate COPD, defined by FEV1 > 50% predicted (GOLD stage 1–2) (Citation22), and 12 with severe COPD, FEV1 < 50% predicted (GOLD stage 3–4). A week prior to MRI scanning, all subjects underwent PFTs, whereas only the COPD subjects were scanned using CT, in order to not expose the healthy participants to ionizing radiation. Subsequently, a second lung MRI T1 measurement was performed one week later to test T1 repeatability.
Table 1. Demographic, pulmonary function, CT density and lung MRI T1 data
Pulmonary function test
PFTs were performed to assess FEV1, FEV1/forced vital capacity (FVC) and the diffusing capacity of carbon monoxide divided by alveolar volume (DLCO/VA). The measurements were carried out using a computerized spirometer system (V62J SensorMedics Plethysmograph, Viasys Healthcare, Carefusion, UK) by a trained test administrator according to ERS standards (Citation23).
CT protocol
CT was carried out for the COPD subjects to allow quantification of global lung density using a LightSpeed Plus scanner (GE Medical Systems, Amersham, UK). Volumetric images of the lung were acquired at full inspiration with following parameters: 120 kVp, 40 mAs, matrix size 5122 and 1.25-mm slice thickness. Images were reconstructed using the GE standard algorithm and the data was measured using the VIDA software package (Vida Diagnostics, Inc., Coralville, IA). The 15th percentile density (PD15) and relative lung area with attenuation values less than −950 Hounsfield units (HU), RA950, were calculated as measures of lung density. PD15 is expressed as grams per litre (g/L) by adding 1000 to the HU values.
MRI protocol
MR imaging was performed on a 1.5 tesla Philips Achieva MR system (Philips Healthcare, Best, the Netherlands). Subjects were positioned supine and the body coil was used for radio frequency transmission and reception. Cardiac triggering, respiratory gating and respiratory manoeuvres were not employed, allowing normal tidal breathing. Localization scans were acquired to allow reproducible slice positioning at each visit, selecting a posterior two-dimensional coronal slice placed across the descending aorta to permit good lung coverage and avoid the heart.
Static T1 mapping scans were performed during air breathing using a two-dimensional half Fourier acquired single shot turbo spin echo (HASTE) sequence preceded by an adiabatic non-selective inversion pulse. One week later the subjects were recalled and the repeatability of the T1 measurements tested. The imaging parameters were: repetition time (TR) = 5500 ms, echo time (TE) = 3 ms, field of view (FOV) = 4502 mm2, matrix size = 1282, 68 phase-encoding steps, coronal section with slice thickness = 10 mm, flip angle (FA) = 90°, with inversion times (TI) of 50, 300, 1100, 2000 and 5000 ms and 5 repeats acquired at each TI, resulting in a 4 min T1 mapping scan time. T1 maps were calculated on a voxelwise basis from inversion recovery HASTE data by fitting the inversion recovery signal equation
MR imaging analysis
All data analysis was performed using Pulmolux:OE software (Bioxydyn Ltd., Manchester, United Kingdom). Image registration was used to correct for breathing-induced motion. The software uses a non-linear diffeomorphic registration algorithm with a neighbourhood cross correlation similarity metric to account for the large elastic deformations in the lung. Lung segmentation was performed using a semi-automatic method where an intensity threshold was defined in order to extract the lungs from the image. The intensity threshold was individual-specific to account for both physiological and technical variation between scans. The segmentation procedure also allowed the large pulmonary vessels to be excluded in the quantification.
All segmentations were verified by a second observer to ensure the correct lung regions were defined for analysis. T1 was calculated by fitting the inversion recovery signal equation pixel-by-pixel over each lung image and used to calculate the median and inter-quartile range (IQR) of each subject using RStudio (version 0.98.507). Average lung T1 was compared between groups. Histograms and IQR of T1 were assessed to reveal the inherent structure in the maps as median T1 values are poorly suited to report image heterogeneity. Additionally, the signal to noise ratio (SNR), mean lung signal/standard deviation (SD) in background, was assessed for each TI image.
Statistical analysis
The T1 repeatability was assessed by intraclass correlation coefficient (ICC) and coefficient of variation (SD/mean, CV) analysis. Mean T1 from the two scanning visits was associated with pack-years (number of years or equivalent years in which 20 cigarettes a day were smoked, PY), CT density (RA950, PD15) and PFTs (FEV1, FEV1/FVC, DLCO/VA) by Pearson's correlation. Differences in demographic and lung T1 variables between groups were tested using one-way ANOVA with Tukey's multiple comparison test. All p-values are nominal and 0.05 was used as a significance level throughout the study. If not stated otherwise, the reported values are given as the mean ± one SD. Analyses were performed using RStudio (version 0.98.507).
Results
The means ± SD of demographic, PFT, CT and lung T1 biomarkers for all participants are shown in . There was no significant difference in age or body mass index across the three groups. The COPD smokers had smoking histories ranging from 12 to 102 PY; including 18 former and 6 current smokers (mean 49 ± 22 PY). One present healthy non-smoker had a past smoking history of 3.6 PY.
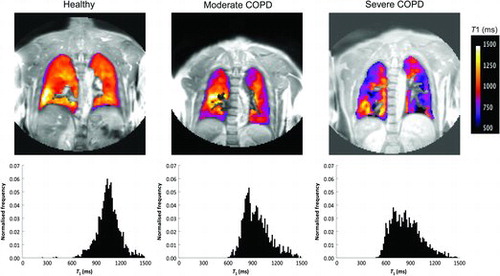
Representative lung T1 maps from each of the three groups – healthy, moderate and severe COPD subjects– are shown in . Heterogeneity of T1 values is evident in the maps of those with COPD, whereas the T1 map of a healthy subject appears relatively homogenous. Histograms of T1 further reveal this heterogeneity with an asymmetric broadening of T1 in the COPD subjects. Also, the mean T1 for the COPD subjects appears to be shorter than seen in the healthy subject.
Figure 1. Representative coronal lung MRI T1 maps overlaid on a signal intensity image with corresponding normalised T1 histograms for healthy, moderate COPD and severe COPD subjects. Both T1 maps and histograms reflected the severity of COPD by reduced T1 and increased heterogeneity.
Repeated T1 calculations in 27 participants were usable, 9 were excluded due to poor alignment, missing visits and data quality issues. The median lung T1 of each subject was satisfactorily repeatable between visits (ICC = 0.72). The mean T1 difference and CV assessed from the median T1 maps obtained from the two visits were 5 ms and 2.5%, respectively. Thus, T1 values were averaged for each individual across the two scanning visits before testing for significant group differences and correlations. Typical mean SNRs in lung for TIs of 50, 300, 1100, 2000 and 5000 ms were 28, 17, 8, 28 and 56, respectively.
The lung T1 (mean ± SD) was significantly shorter (10%, p < 0.0001; 14%, p < 0.0001) for the moderate COPD subjects (947 ± 56 ms) and severe COPD subjects (911 ± 64 ms) than in the healthy controls (1053 ± 55 ms) (; ). No statistically significant differences of T1 were found between the subjects with different grades of COPD.
Figure 2. Global lung T1 (a) and regional IQR of T1 (b) for healthy (), moderate COPD (▲) and severe COPD () subjects. T1 was significantly shorter for the moderate COPD (p < 0.0001) and severe COPD subjects (p < 0.0001) than in the healthy controls. IQR of T1 was significantly larger for the moderate COPD (p < 0.0001) and severe COPD subjects (p = 0.0002) than in the healthy controls. No statistically significant differences in T1 and IQR of T1 were found between the COPD subjects. The error bars indicate standard deviation of the mean.
IQR of T1 was significantly larger (57%, p < 0.0001, 41%, p = 0.0002) for the moderate COPD (324 ± 80 ms) and severe COPD subjects (291 ± 62 ms) than in the healthy controls (207 ± 45 ms) (; ). No statistically significant differences in IQR of T1 were found between the subjects with different grades of COPD.
Significant correlations between lung T1 and CT density measurements; RA950 (r = −0.63, p = 0.001) () and PD15 (r = 0.50, p = 0.017) () were found, showing that lung T1 decreases with lower lung density. Moreover, strong significant correlations (p < 0.0001) between lung T1 and all PFT parameters; FEV1 (r = 0.74) (), FEV1/ FVC (r = 0.77) () and DLCO/VA (r = 0.75) () were observed, indicating that lung T1 decreases with reduced lung function. There was no significant correlation between lung T1 and PY in the COPD subjects (p = 0.87).
Figure 3. Lung T1 as a function of CT density measurements RA950 (a) and PD15 (b), for moderate COPD (▲) and severe COPD () subjects. Significant correlations between lung T1 and RA950 (r = −0.63, p = 0.001) and PD15 (r = 0.50, p = 0.017) were found.
Figure 4. Lung T1 as a function of PFT parameters FEV1 (a), FEV1/ FVC (b) and DLCO/VA (c), for healthy (), moderate COPD (▲) and severe COPD () subjects. Strong significant correlations (p < 0.0001) between lung T1 and all PFT parameters; FEV1 (r = 0.74), FEV1/FVC (r = 0.77) and DLCO/VA (r = 0.75) were observed.
Discussion
Data from this study demonstrates significantly shorter lung T1 in moderate and severe COPD subjects than in healthy age-matched non-smoking controls. Additionally, IQR of T1 significantly increased for the COPD subjects compared to healthy controls, indicating enhanced heterogeneity in the diseased groups. The T1 protocol possessed good repeatability between the two visits in COPD and healthy subjects. Moreover, the significant T1 correlations to CT density and PFT parameters indicate that lung T1 is a potential biomarker for COPD staging. To the best of our knowledge, no other study has provided evidence of the lung T1 relationship to PY, CT and PFTs in COPD subjects in conjunction with healthy age-matched controls.
There are a number of reasons why lung T1 may be reduced in COPD subjects. It could be explained by the presence of tar or other substances which enhance dipolar relaxation in the extracellular tissue water and which accumulate in the lung as a direct consequence of smoking. However, we did not observe any T1 correlation to PY in the COPD subjects, so therefore it is unlikely that smoke particles from the cigarette smoke is the cause of shorter T1. Lung T1 may also be changed due to reduced oxygen concentrations and increased inflammation with edema in the COPD subjects. However, these alterations would be expected to increase T1 in the lung rather than reduce it as found in our study (Citation13, Citation25). The observed finding with reduced T1 in COPD patients, therefore, most likely reflects smoking-induced lung pathology, specifically emphysema which is supported by our PFT and CT measurements. Emphysema may reduce lung T1 due to the elimination of long T1 compartments such as water and blood (Citation26, Citation27) and an increased fraction of fibrotic tissue (Citation20). Fibrotic tissue is known to have short T1 (Citation28).
Stadler et al. found shorter lung T1 values for 11 emphysema and 14 fibrosis patients (Citation20) than 10 healthy volunteers (Citation29). Dasenbrook et al. showed a lowered normalized T1 for 10 cystic fibrosis patients than 5 healthy volunteers with unspecified age (Citation21). Our observed T1 changes for the COPD subjects are in the same order of magnitude as these studies. The results presented here extend the previous work (Citation20, Citation21) by using larger study groups, different disease grades, age-matched healthy controls, smoking history information, CT lung density scans and systematically performed PFTs. Moreover, our MRI T1 protocol allowed normal tidal breathing, while the studies mentioned above performed breath-hold protocols. A free-breathing MRI examination has a practical advantage in diseased subjects that might have difficulties in holding their breath. Moreover, capturing the lung during normal breathing is probably more likely to give representative information about lung function.
Additionally, a previous publication (Citation30) analyzed the same individuals as in this study and retrieved proton density values from the T1 mapping fitting routine (S0, Equation 1). Normalized lung proton density strongly correlated with CT density scans (Citation30). The addition of lung T1 to proton density may provide extra information on the underlying biology. Thus, radiation-free lung MRI T1 together with proton density quantification would be of considerable interest as an assessment of lung disease especially for longitudinal studies.
A limitation with this retrospective study was the two-dimensional MRI protocol that was restricted to one slice and did not cover the whole lung. A multi-slice or three-dimensional protocol would be preferred for improved regional analysis of the heterogeneous COPD disease. The present study showed good repeatability; however, reproducibility of lung T1 across sites will need to be determined in a multi-center setting with carefully designed study protocols (Citation31). No correlation between lung T1 and cigarette exposure was seen in the COPD subjects. However, we did not monitor intervals between last cigarette smoked and the imaging sessions, so there may be some effect of smoke particles on lung T1. To test this hypothesis a study in healthy smokers should be performed. Other limitations with this study were the small sample size, lack of mild COPD subjects and lack of baseline CT scans from the healthy controls.
The T1 data was presented as the change of median T1 and IQR, two quantities which describe the general change as well as the heterogeneity of T1 in the COPD subjects. As indicated above, the relationship between T1 and the underlying pathophysiology is not clearly outlined. In future studies it might be appropriate to compare other measures such as the 15th percentile of T1 to CT PD15, however first we need to increase our understanding of lung T1. The mean lung density from CT was not used in the comparison with T1, since it will represent a mixture of larger structures such as bronchi and vessels, emphysema and inflammation and will be of little value to increase the understanding of our findings (Citation32, Citation33).
This was an exploratory study to investigate a potential new biomarker for COPD. The main application for the imaging biomarker would be in clinical trials where there are needs to perform multiple scans and ionizing radiation would be a limitation. The validation of MRI biomarkers is in some ways more challenging than for more familiar molecular biomarkers (Citation31). For MRI measurements used as biomarkers, the quality and validity of the imaging measurement as a biomarker depends crucially on the use of a diagnostic imaging device, in the presence of the patient, in a manner for which the device was not primarily designed, and may be unfamiliar to the user in the trial site. It is essential to establish repeatability and variation before investigating response to therapy.
In conclusion, MRI T1 mapping of the lung showed significant differences between COPD subjects and healthy controls, and lung T1 correlated with CT density and PFTs, indicating the potential role of T1 quantification in the evaluation of COPD and emphysema. The good repeatability, and the radiation-free and non-invasive nature of MRI, make T1 mapping an attractive imaging biomarker of COPD for future longitudinal studies.
Acknowledgments
Thanks to the University of Manchester Magnetic Resonance Imaging Facilities and NIHR/Welcome Trust Clinical Research Facility for access to scanning facilities.
Funding
This work was supported by AstraZeneca and Allmänna Sjukhusets i Malmö stiftelse för bekämpande av Cancer.
Declaration of Interests Statement
The authors have no conflicts of interest to declare. The authors alone are responsible for the content and writing of the paper.
References
- Stockley RA, Mannino D, Barnes PJ. Burden and pathogenesis of chronic obstructive pulmonary disease. Proc Amer Thorac Soc 2009; 6(6):524–526.
- Bergin C, Müller N, Nichols D, et al. The diagnosis of emphysema. A computed tomographic-pathologic correlation. Am Rev Respir Dis 1986; 133(4):541.
- Swanney MP, Ruppel G, Enright PL, et al. Using the lower limit of normal for the FEV1/FVC ratio reduces the misclassification of airway obstruction. Thorax 2008; 63(12):1046–1051.
- Roy K, Smith J, Kolsum U, et al. COPD phenotype description using principal components analysis. Respir Res 2009; 10(1):41.
- Costa GM, Faria ACD, Mango D, et al. Bronchodilation in COPD: Beyond FEV1-the effect of albuterol on resistive and reactive properties of the respiratory system. J Brasil Pneumol 2009; 35(4):325–333.
- Jones P, Agusti A. Outcomes and markers in the assessment of chronic obstructive pulmonary disease. Euro Respir J 2006; 27(4):822–832.
- Agusti A. The path to personalised medicine in COPD. Thorax 2014; 69(9):857–864.
- Lynch DA. Imaging of small airways disease and chronic obstructive pulmonary disease. Clin Chest Med. 2008; 29(1):165–179.
- Jögi J, Ekberg M, Jonson B, et al. Ventilation/perfusion SPECT in chronic obstructive pulmonary disease: An evaluation by reference to symptoms, spirometric lung function and emphysema, as assessed with HRCT. Euro J Nucl Med Mol Imag. 2011; 38(7):1344–1352.
- Wild J, Marshall H, Bock M, et al. MRI of the lung (1/3): Methods. Insights Imag 2012; 3(4):345–353.
- Biederer J, Beer M, Hirsch W, et al. MRI of the lung (2/3). why… when… how? Insights Imag 2012; 3:1–17.
- Biederer J, Mirsadraee S, Beer M, et al. MRI of the lung (3/3)—current applications and future perspectives. Insights Imag 2012; 3:1–14.
- Edelman RR, Hatabu H, Tadamura E, et al. Noninvasive assessment of regional ventilation in the human lung using oxygen–enhanced magnetic resonance imaging. Nat Med 1996; 2(11):1236–1239.
- Ohno Y, Hatabu H. Basics concepts and clinical applications of oxygen-enhanced MR imaging. Eur J Radiol 2007; 64(3):320–328.
- Ohno Y, Iwasawa T, Seo JB, et al. Oxygen-enhanced magnetic resonance imaging versus computed tomography: Multicenter study for clinical stage classification of smoking-related chronic obstructive pulmonary disease. Am J Respir Crit Care Med 2008; 177(10):1095–1102.
- Morgan AR, Parker GJ, Roberts C, et al. Feasibility assessment of using oxygen-enhanced magnetic resonance imaging for evaluating the effect of pharmacological treatment in COPD. Eur J Radiol 2014; 83(11):2093–2101.
- Triphan SM, Breuer FA, Gensler D, et al. Oxygen enhanced lung MRI by simultaneous measurement of T1 and T2* during free breathing using ultrashort TE. J Magnet Reson Imag 2014; 41:1708–1714.
- Scholz TD, Fleagle SR, Burns TL, et al. Tissue determinants of nuclear magnetic resonance relaxation times. effect of water and collagen content in muscle and tendon. Invest Radiol 1989; 24(11):893–898.
- Deninger A, Eberle B, Ebert M, et al. Quantification of regional intrapulmonary oxygen partial pressure evolution during apnea by 3He MRI. J Magn Reson 1999; 141(2):207–216.
- Stadler A, Jakob PM, Griswold M, et al. T1 mapping of the entire lung parenchyma: Influence of respiratory phase and correlation to lung function test results in patients with diffuse lung disease. Magn Reson Med 2007; 59(1):96–101.
- Dasenbrook EC, Lu L, Donnola S, et al. Normalized T1 magnetic resonance imaging for assessment of regional lung function in adult cystic fibrosis patients-A cross-sectional study. PloS One 2013; 8(9):e73286.
- Rabe KF, Hurd S, Anzueto A, et al. Global strategy for the diagnosis, management, and prevention of chronic obstructive pulmonary disease. American Journal of Respiratory and Critical Care Medicine. 2007 September15; 176(6):532–55.
- Miller MR, Hankinson J, Brusasco V, et al. Standardisation of spirometry. Eur Respir J 2005; 26(2):319–338.
- Kingsley PB, Gordon Monahan W. Effect of increased repetition time TR on precision of inversion-recovery T1 measurements. Magn Reson Imag 2001; 19(2):279–282.
- Bottomley P, Hardy C, Argersinger R, et al. A review of 1H nuclear magnetic resonance relaxation in pathology: Are T1 and T2 diagnostic? Med Phys 1987; 14(1):1–37.
- Harms SE, editor. Breast MRI: Fundamentals and Technical Aspects, In. Hendrick RE, ed. Tissue Relaxation. New York, NY: Springer; 2008:19–29.
- Zhang X, Petersen E, Ghariq E, et al. In vivo blood T1 measurements at 1.5 T, 3 T, and 7 T. Magn Reson Med 2013; 70(4):1082–1086.
- Vinitski S, Pearson MG, Karlik SJ, et al. Differentiation of parenchymal lung disorders with in vitro proton nuclear magnetic resonance. Magn Reson Med. 1986 Feb; 3(1):120–125.
- Stadler A, Jakob PM, Griswold M, et al. T1 mapping of the entire lung parenchyma: Influence of the respiratory phase in healthy individuals. J Magn Reson Imag 2005; 21(6):759–764.
- Zhang W, Hubbard Cristinacce PL, Bondesson E, et al. MR quantitative equilibrium signal mapping: A reliable alternative to CT in the assessment of emphysema in patients with chronic obstructive pulmonary disease. Radiology 2015; 275:579–588.
- Waterton J. Translational magnetic resonance imaging and spectroscopy: opportunities and challenges In: Garrido L, Beckmann N, editors. New Applications of NMR in Drug Discovery and Development. Cambridge, UK: Royal Society of Chemistry; 2013: 333–360.
- Parr DG, Dirksen A, Piitulainen E, et al. Exploring the optimum approach to the use of CT densitometry in a randomised placebo-controlled study of augmentation therapy in alpha 1-antitrypsin deficiency. Respir Res 2009; 10(75):75.
- Shaker SB, Maltbaek N, Brand P, et al. Quantitative computed tomography and aerosol morphometry in COPD and alpha1-antitrypsin deficiency. Eur Respir J 2005; 25(1):23–30.