
Abstract
Background: We aimed to study whether pulmonary hypertension (PH) and elevated pulmonary vascular resistance (PVR) could be predicted by conventional echo Doppler and novel tissue Doppler imaging (TDI) in a population of chronic obstructive pulmonary disease (COPD) free of LV disease and co-morbidities.Methods: Echocardiography and right heart catheterization was performed in 100 outpatients with COPD. By echocardiography the time-integral of the TDI index, right ventricular systolic velocity (RVSmVTI) and pulmonary acceleration-time (PAAcT) were measured and adjusted for heart rate. The COPD patients were randomly divided in a derivation (n = 50) and a validation cohort (n = 50). Results: PH (mean pulmonary artery pressure (mPAP) ≥ 25mmHg) and elevated PVR ≥ 2Wood unit (WU) were predicted by satisfactory area under the curve for RVSmVTI of 0.93 and 0.93 and for PAAcT of 0.96 and 0.96, respectively. Both echo indices were 100% feasible, contrasting 84% feasibility for parameters relying on contrast enhanced tricuspid-regurgitation. RVSmVTI and PAAcT showed best correlations to invasive measured mPAP, but less so to PVR. PAAcT was accurate in 90- and 78% and RVSmVTI in 90- and 84% in the calculation of mPAP and PVR, respectively. Conclusions: Heart rate adjusted-PAAcT and RVSmVTI are simple and reproducible methods that correlate well with pulmonary artery pressure and PVR and showed high accuracy in detecting PH and increased PVR in patients with COPD. Taken into account the high feasibility of these two echo indices, they should be considered in the echocardiographic assessment of COPD patients.
Introduction
Measurement of mean pulmonary artery pressure (mPAP) and pulmonary vascular resistance (PVR) by right heart catheterization are currently gold standards and reference methods when it comes to definition of pulmonary hypertension (PH) and PVR (Citation1). In clinical practice, systolic pulmonary artery (PA) pressure and its derived mPAP, is calculated by echocardiographic tricuspid regurgitation peak velocity by the Bernoulli equation (Citation2). This method, however, could be hampered by low feasibility and poor accuracy. Moreover, measures of PVR for routine use has not been recommended (Citation3), although several simple non-invasive methods of estimating PVR have been proposed in different patient's populations (Citation4–Citation8).
Previous studies, measuring afterload noninvasively by echocardiography, have mainly been performed in patients with idiopathic PH and to a lesser extent in the largest group of patients with PH; chronic obstructive pulmonary disease (COPD). From 2006 to 2010 we recruited a well-defined group of COPD patients, which previously have been thoroughly described (Citation9–Citation11). Moreover, validation of echo indices against right heart catheterization regarding clinical accuracy, in particular in COPD, has hardly been performed.
The main objective of the present study was therefore to investigate the diagnostic ability and accuracy, precision and feasibility of echocardiography in predicting PH and PVR in a cohort of stable COPD patients by established methods, such as pulmonary acceleration time (PAAcT) (Citation12) and by novel tissue Doppler measures. We hypothesized that the TDI indices and a novel heart rate adjusted PAAcT would provide better estimations and be more feasible than the estimation by standard tricuspid jet.
Methods
Study population
The present study is an analysis of a previously described cohort of outpatients enrolled in a cross-sectional study at a secondary referral centre (Oslo University Hospital-Aker) for diagnosis and evaluation of COPD associated pulmonary hypertension, and who prospectively underwent right heart catheterization for the purpose of this study. The cohort was in advance screened with regard to established left sided heart disease and comorbidities, and excluded from participation if such conditions were present. Patients with a history of congenital, rheumatic, valvular and ischemic heart disease, treated arterial hypertension with blood pressure (BP) >160/90 mmHg, arrhythmias (including atrial fibrillation), cardiac surgery, other acute or chronic pulmonary disease, sleep apnea syndrome, malignancy, hyperthyroidism, systemic inflammatory diseases and renal failure, were excluded, as well as the use of beta-blockers, warfarin or clopidogrel.
The present report describes 100 patients with stable, smoke-induced COPD (with ≥ 10–pack-year history of smoking) in age of 40–75 years with different airway severity according to Global Initiative for Chronic Obstructive Lung Disease (GOLD) in stages I to IV (Citation13). Baseline, pulmonary function and arterial blood gas characteristics, invasive- resting and exercise hemodynamic data and selected echocardiographic data on RV myocardial function according to COPD with and without PH has been described in previous reports (Citation9–Citation11). In contrast to previous articles, the present article includes GOLD stage I participants. To identify clinical relevant cutoff values for different echocardiographic markers by receiver operating characteristic (ROC) curve analyses, the COPD cohort was randomly computer divided into equal sized groups; i) a derivation cohort (n = 50), and ii) a validation sample (n = 50). The study complies with the Declaration of Helsinki and was approved by the Local Research Ethics Committee. Written informed consent was obtained from all the participants.
Right heart catheterization
Standard right heart catheterization was performed after transthoracic echocardiography within 120 minutes as previously described (Citation9). Volume loading or sedation was not administered to patients prior to invasive measurements. A Swan–Ganz catheter was used for flow measurements and pressures, which were zeroed in the supine position at the mid-axillary line at the right atrial level. Automatic calibration was done prior to pressure measurements that were performed during temporary breath-hold at end-expiration, verified by flat respiration curve. Cardiac output (L/min) was measured by thermodilution technique. PVR was calculated by equation = (mPAP-pulmonary wedge pressure (PWP))/cardiac output) in Wood unit (WU). A PVR ≥ 2.0 WU was considered abnormal (Citation14).
Doppler-echocardiography
All echocardiograms were obtained by an experienced cardiologist (JMH) using standard techniques and a commercially available system (Vivid Seven, General Electric, Norway). Three consecutive measurements were performed and averaged. Echocardiograms were stored in digital format, and post-processing software (EchoPAC, GE Healthcare, Norway) was used. Echocardiograms were analysed by the same observer (JMH) who was blinded to the clinical status.
The tricuspid valve was interrogated from multiple different views to obtain the most complete Doppler envelope. Agitated saline was administered in all subjects as ordinary bolus (9 ml 0.9% saline and 1 ml air) intravenously to enhance tricuspid regurgitation jet signals, which were used in case of technically limitations (Citation15).
Estimation of systolic PA pressure was based on tricuspid regurgitation peak velocity and calculated by the simplified Bernoulli equation; 4(tricuspid regurgitation peak velocity) 2+ right atrial pressure (RAP). Estimation of RAP was done on the basis of the inferior vena cava diameter and collapse index (Citation3, Citation16).
According to current guidelines (Citation3), mPAP was estimated by pulsed Doppler, using PA flow acceleration time (PAAcT), defined as time interval between onset of systolic PA flow and peak velocity. Heart rate affects PA acceleration time (Citation17). To avoid false high values due to bradycardia, adjustment was performed: measured PA acceleration time/√RR interval (s) (Citation18) if heart rate < 60, denoted as heart rate-adjusted PA acceleration time (HR-adjusted PAAcT). In addition, mPAP was estimated by a systolic PA pressure estimate: (mPAP = 0.61·systolic PA pressure+2 mmHg) (Citation19) from continuous wave Doppler recordings.
The ratio of peak early transmitral velocity (E) by pulsed Doppler and peak early diastolic mitral annular velocity (Ea) at the medial mitral annulus by pulsed-Doppler TDI was used as a numeric substitute for pulmonary wedge pressure (Citation20).
PVR (WU) was estimated (Citation4) as:
PVR (WU) = Tricuspid regurgitation peak velocity/[(RV outflow tract pulsed Doppler VTI × 10)+0.16]
TAPSE was measured in the apical four-chamber view by aligning the M-mode cursor along the movement of the lateral tricuspid annulus (Citation3).
Tissue Doppler
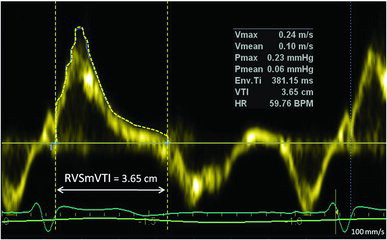
The tricuspid annular peak systolic myocardial velocity (Sm) and its velocity time integral (SmVTI) were acquired in apical four chamber view with a 2-mm sample volume at the junction of the free wall and the anterior leaflet of the tricuspid valve using pulsed-wave TDI. TDI (Citation21) waveforms were accepted when uniform and consistent with little or no beat-to-beat variation of the peak velocity was observed. The resulting velocities and integrals were analysed at sweep speed of 100 mm/s. RVSmVTI was traced exactly in its outer contour from start to cessation of S-wave (Figure ), and heart rate adjustment was done, in the same manner, as for PAAcT. Gain was optimized to allow a clear signal with minimal background noise. The time from the beginning of isovolumic contraction to the first systolic peak (Sm) was measured and referred to as time to peak Sm (Tpeak). RV diameter was measured in diastole as the internal annular mediolateral dimension of the RV (RVD). RVD/Tpeak (cm/sec) was calculated (Citation22).
Figure 1. Tracing (dotted line) of right ventricular velocity time integral (RVSmVTI) from tissue Doppler obtained from the lateral tricuspid annulus.
Statistical analysis
Data are expressed as mean ± standard deviation (SD) for normally distributed data and median and interquartile range for not-normally distributed data. Paired Student's t-test was used to compare continuous data. Statistical significance was inferred at p < .05. In the first analyses the regression equations were calculated between mPAP to echo markers and of PVR to echo markers in the 50 patients in the derivation group. In the next step, the algorithm derived from the regression line was used to calculate mPAP and PVR from the echo variables of 50 patients in the validation cohort. Finally, the agreement between the calculated mPAP and PVR values, and the invasive measures from RHC were evaluated using Bland-Altman plots.
Accuracy was predefined as 95% limits of agreement within ±5 mmHg for mPAP and ±1 Wu for PVR. Receiver operating characteristic (ROC) curves were constructed to evaluate the ability of echocardiographic parameters, HR-adjusted PAAcT and RVSmVTI, in addition to RVD/Tpeak, to predict PH. Furthermore, HR-adjusted PAAcT and SmVTI were used to predict elevated PVR. Comparison to clinically established parameters was done, and comparative analyses of area under curve (AUC) for different variables were performed.
ROC curve analysis was performed in the derivation group to establish cutoff values for the detection of i) PH (mPAP ≥ 25 mmHg) and ii) increased PVR (PVR ≥ 2 WU) (Citation1, Citation14). The cutoff values formed by the derivation group were applied to the test group to evaluate the diagnostic performance of the ROC cutoff values. Diagnostic utility was reported by balanced sensitivity- and specificity, by positive- and negative predictive values and diagnostic odds ratio, calculated as [((sensitivity × specificity)/(1-sensitivity) × (1-specificity)]. Reproducibility data were tested by intraclass correlation coefficient for RVSmVTI, RVSm, Tpeak and RVD1 in a randomly chosen sample of 10 study participants. The measurements were performed by two of the authors (KS and JMH). Statistical analyses were performed using SPSS v.20 and SigmaPlot v.12.
Results
Clinical, hemodynamic, and echocardiographic characteristics are presented in Tables and . COPD patients partitioned in derivation and validation group did not differ with regard to clinical, hemodynamic or echocardiographic characteristics. Pulmonary stenosis was not identified, and only trivial and mild pulmonary regurgitation was observed. Significant linear relationships (p < 0.01) were observed between invasive systolic PA pressure vs. mPAP (r = 0.92), and between mPAP and transpulmonary pressure gradient (r = 0.81). A difference of> 10 mmHg in systolic systemic blood pressure and of > 10 beats/min in heart rate between the invasive- and non-invasive data for any given patients were observed only in one patient.
Table 1. Baseline characteristics of study participants
Table 2. Hemodynamic and echocardiographic characteristics in COPD
Agreement between right heart catheterization and echocardiography
Feasibility of HR-adjusted PAAcT and TDI derived variables were 100% compared to 84% using tricuspid regurgitation peak velocity signals. Only mild-to-moderate tricuspid regurgitation jets were observed.
The derivation group revealed the following linear regression equations between invasive mPAP and the echo variables PAAcT, RVSmVTI, and RVD/Tpeak: y = -0.25x + 49.24, y = -8.67x + 43.47, and y = 0.48x +9.77, respectively. When applied to the validation group, strong correlation and satisfactory agreement with narrow limits of agreement by Bland-Altman plots were observed between echocardiography and right heart catheterization, in particular for PAAcT and RVSmVTI (Figure ). Difference between observed and predicted mPAP by PAAcT and RVSmVTI in the validation cohort were: -1.86 (95% CI: -2.72, -0.97) and 0.2 (95% CI: -0.66, 1.07) mmHg, respectively (Figure , panel B and D, respectively). Using the predefined definition of accuracy, both PAAcT and RVSmVTI were accurate in 90%, and RVD/Tpeak in 80%. Comparable value for the established clinical method for predicted mPAP by 0.61 × sPAP+2 mmHg versus observed mPAP is shown in Figure G. A strong correlation between predicted and invasive mPAP was also observed (Figure ), but weaker than validation indices, HR-adjusted PAAcT and HR-adjusted RVSmVTI (Figure ). Further, the established method showed a larger bias (+3.42 mmHg) and wider limits of agreement (Figure H), compared to HR-adjusted PAAcT and RVSmVTI (Figures B and D).
Figure 2. The panels A, C, E and G, show the relationship between heart rate adjusted pulmonary artery acceleration time (HR-adjusted PAAcT), the tissue Doppler derived right ventricle (RV) systolic myocardial velocity time integral (RVSmVTI), RV dimension to time to peak (RVD/Tpeak) and mPAP derived from Doppler echocardiography by the standard equation: [(0.61 × systolic artery pressure (sPAP)) + 2 mmHg] versus invasive mean pulmonary artery pressure (mPAP), respectively. The horizontal dashed lines represent definition of pulmonary hypertension (mPAP ≥ 25 mm Hg) by invasive right heart catheterization, while the vertical dashed lines reflect elevated mPAP by the PH cutoff value of the echo indices. The number within each quadrant of true-positive, false-negative, false-positive, and true-negative results are shown in the right plots. The red and green dots show misclassified and correctly classified patients, respectively. In panel B, D, F and H corresponding Bland-Altman plots are shown for observed minus estimated mPAP, based on regression equations from the derivation group, versus the average of predicted minus observed values of mPAP. The horizontal lines correspond to the mean difference and 95% limits of agreement. Less accuracy of Doppler echocardiography in estimating mPAP is apparent at high mPAP.
![Figure 2. The panels A, C, E and G, show the relationship between heart rate adjusted pulmonary artery acceleration time (HR-adjusted PAAcT), the tissue Doppler derived right ventricle (RV) systolic myocardial velocity time integral (RVSmVTI), RV dimension to time to peak (RVD/Tpeak) and mPAP derived from Doppler echocardiography by the standard equation: [(0.61 × systolic artery pressure (sPAP)) + 2 mmHg] versus invasive mean pulmonary artery pressure (mPAP), respectively. The horizontal dashed lines represent definition of pulmonary hypertension (mPAP ≥ 25 mm Hg) by invasive right heart catheterization, while the vertical dashed lines reflect elevated mPAP by the PH cutoff value of the echo indices. The number within each quadrant of true-positive, false-negative, false-positive, and true-negative results are shown in the right plots. The red and green dots show misclassified and correctly classified patients, respectively. In panel B, D, F and H corresponding Bland-Altman plots are shown for observed minus estimated mPAP, based on regression equations from the derivation group, versus the average of predicted minus observed values of mPAP. The horizontal lines correspond to the mean difference and 95% limits of agreement. Less accuracy of Doppler echocardiography in estimating mPAP is apparent at high mPAP.](/cms/asset/de201781-43f7-42a8-bccf-b06461b14b7a/icop_a_1057275_f0002_c.jpg)
The derivation group showed the two linear regression equations between invasive PVR and the echo indices, HR-adjusted PAAcT and RVSmVTI, y = –0.04x + 6.87 and -1.34 + 5.85, respectively. Applied to the validation group, strong correlations (Figures A and C) and acceptable limits of agreement were observed (Figures B and D). Accuracy according to predefinition of PVR for PAAcT and RVSmVTI was observed in 78% and 84%, respectively. There was also good agreement between PVR predicted as proposed by Abbas et al. and calculated PVR from RHC. Bland-Altman plot showed a mean difference -0.01 (95% CI: -0.30 -0.28). PAAcT and RVSmVTI were comparable to Abbas et al. (Citation4) with minor bias in mean differences of -0.23 (95% CI: -0.50, 0.04) and 0.09 (95% CI: -0.18, 0.36), respectively, and by comparable limits of agreements compared to PVR by Abbas (Figures 3B and D).
Figure 3. Scatterplots showing the relation between invasive pulmonary vascular resistance (PVR) versus heart rate adjusted pulmonary artery acceleration time (HR-adjusted PAAct) (panel A), right ventricular systolic velocity time integral (RVSmVTI) (panel C) and the recommended method by the Tricuspid regurgitation peak velocity/[(RV outflow tract pulsed Doppler VTI × 10)+0.16] (panel E). Correctly and misclassified subjects are illustrated by green and red dots, respectively. Bland-Altman plots of predicted minus observed PVR (vertical axis) against mean of observed and predicted PVR (horizontal axis) for PAAcT (panel B), RVSmVTI (panel D) and the recommended echo method (panel F). Good agreement with negligible mean difference and narrow limits of agreement for all three indices were observed; however, a tendency for greater negative differences with greater PVR, seen in both panel B, D and F.
![Figure 3. Scatterplots showing the relation between invasive pulmonary vascular resistance (PVR) versus heart rate adjusted pulmonary artery acceleration time (HR-adjusted PAAct) (panel A), right ventricular systolic velocity time integral (RVSmVTI) (panel C) and the recommended method by the Tricuspid regurgitation peak velocity/[(RV outflow tract pulsed Doppler VTI × 10)+0.16] (panel E). Correctly and misclassified subjects are illustrated by green and red dots, respectively. Bland-Altman plots of predicted minus observed PVR (vertical axis) against mean of observed and predicted PVR (horizontal axis) for PAAcT (panel B), RVSmVTI (panel D) and the recommended echo method (panel F). Good agreement with negligible mean difference and narrow limits of agreement for all three indices were observed; however, a tendency for greater negative differences with greater PVR, seen in both panel B, D and F.](/cms/asset/2050f3b3-a7d3-4fd4-a678-edf21ba65d14/icop_a_1057275_f0003_c.jpg)
Prediction of pulmonary hypertension and elevated PVR
Test indices areas under curve (derivation group) for RVD/Tpeak, RVSmVTI, and HR-adjusted PAAct to predict mPAP ≥ 25 mmHg ranged from 0.87 to 0.96 (Figure A), and were not statistical inferior to standard approaches by sPAP (Figure A). RVSmVTI had a large area under curve, 0.93 (95% CI 0.86–0.99), and a cutoff value of 2.53 provided the best balanced sensitivity, 85% (95% CI: 55–98%), and specificity, 92% (95% CI: 78–98%) with high test performance (diagnostic odds ratio of 77) to determine mPAP ≥ 25 mmHg (Table ). A cutoff value of 103 ms for HR–adjusted PAAcT provided the best balanced sensitivity, 98% (95% CI: 75–100%) and specificity, 89% (95% CI: 75–97%) with high diagnostic performance odds ratio of 62.
Figure 4. Comparative receiver operating characteristic curve analyses are presented in 50 patients (derivation group) for; heart rate adjusted pulmonary artery (HR-adjusted PAAcT), right ventricular (RV) systolic velocity time integral (HR-adjusted RVSmVTI), RV diameter (RVD)/time to peak Sm (RVD/Tpeak), estimation of mPAP from established formula (0.61·systolic PAP+2 mmHg, whereby *sPAP is obtained by continuous wave Doppler by tricuspid regurgitation (TR) peak velocity by Bernoulli + right atrial pressure), and echo pulmonary vascular resistance Tricuspid regurgitation peak velocity/[(RV outflow tract pulsed Doppler VTI × 10)+0.16]. The best discriminators for pulmonary hypertension (≥ 25 mmHg) and elevated pulmonary vascular resistance (>2WU) are shown in panel A and B, respectively. Area under the curve superscript (Citation1–Citation8): significant difference (p < 0.05) vs. numbered area under the curve.
![Figure 4. Comparative receiver operating characteristic curve analyses are presented in 50 patients (derivation group) for; heart rate adjusted pulmonary artery (HR-adjusted PAAcT), right ventricular (RV) systolic velocity time integral (HR-adjusted RVSmVTI), RV diameter (RVD)/time to peak Sm (RVD/Tpeak), estimation of mPAP from established formula (0.61·systolic PAP+2 mmHg, whereby *sPAP is obtained by continuous wave Doppler by tricuspid regurgitation (TR) peak velocity by Bernoulli + right atrial pressure), and echo pulmonary vascular resistance Tricuspid regurgitation peak velocity/[(RV outflow tract pulsed Doppler VTI × 10)+0.16]. The best discriminators for pulmonary hypertension (≥ 25 mmHg) and elevated pulmonary vascular resistance (>2WU) are shown in panel A and B, respectively. Area under the curve superscript (Citation1–Citation8): significant difference (p < 0.05) vs. numbered area under the curve.](/cms/asset/b821cc1c-581b-4b57-8f70-18349a6071e3/icop_a_1057275_f0004_c.jpg)
Table 3. Diagnostic performance of echocardiographic indices in predicting pulmonary hypertension and elevated PVR in the validation group (n = 50) with cutoff values from the derivation cohort (n = 50)
The ability of PAAcT and RVSmVTI to predict elevated PVR > 2WU were also tested, and areas under curve of 0.80 and 0.77 were noted, respectively (Figure B). PAAcT had statistical significant better predictive ability compared to PVR by Abbas. Cutoff values of 116 ms for PAAcT provided the best balanced sensitivity, 99% (95% CI: 75–100%) and specificity, 68% (95% CI: 50–82%) to determine PVR>2WU, and of 2.7 cm for RVSmVTI with sensitivity of 92% (95% CI: 64–99%) and specificity of 76% (95% CI: 59–88%).
Diagnostic performance by sensitivity, specificity and diagnostic odd ratio for all test variables is shown in Table for the validation group. Mean PAP by HR-adjusted PAAct and RVSmVTI showed superior diagnostic odd ratio compared to established methods (tricuspid regurgitation peak jet regurgitation by Bernoulli and mPAP by 0.61 × sPAP+2 (mmHg) (Table ).
Intra- and interobserver variability
The intraclass coefficient of intra- and interobserver (JMH vs. JMH -and JMH vs. KS) variability for post-processing analyses for RVSmVTI, RVSm, Tpeak and RVD1 were tested in 10 participants. The results for intraobserver (JMH) analyses with 95% CI were 0.99 (0.97–1.0), 0.97 (0.86–0.99), 0.99 (0.96–1.0), 0.99 (0.95–1.0) and for interobserver (JMH vs. KS) were 0.96 (0.83–0.99), 0.90 (0.61–0.98), 0.99 (0.96–0.99) and 0.91 (0.64–0.98), respectively. All parameters were significant (p < 0.001).
Discussion
In a COPD population with and without PH where post-capillary contribution to elevated mPAP has been excluded, we have shown that PH can be faithfully predicted by Doppler echocardiography and novel TDI with a considerable degree of sensitivity and specificity. TDI indices and PAACT were highly feasible, and showed good test accuracy both for mPAP and PVR estimations.
Non-invasive estimation of PH and PVR
Calculation of mPAP can be estimated by simple standard Doppler echocardiogram by the inverse relationship between PA acceleration time and mPAP, which also has been shown in the present study (Citation23, Citation24). We therefore consider that our data support the use of PA acceleration time as a predictor of PH in COPD. However, there are currently two empirical regression formulas available in determining mPAP by PA acceleration time depending on its duration; >120 or <120 ms (Citation3). Applying these formulas; patients with PA acceleration times of 119 and 120 ms would give estimated mPAP values of 16 and 25 mmHg, respectively, which creates an artificial difference. Our proposed regression equation, however, will avoid this problem. HR-adjusted PAAcT demonstrates satisfactory prediction of PH as shown in the ROC curve analysis (Figure A) and was significantly different in a statistical perspective compared to standard approaches based on tricuspid regurgitation, and hence, provided better discriminative ability.
ROC curve analyses showed diagnostic usefulness in predicting PH in our COPD population in particular by RVSmVTI (Figure ) similar to PAAcT. Melek et al. studied a comparable COPD population by echocardiography and found a similar relationship between echo-estimated systolic PA pressure by peak tricuspid regurgitation, and the TDI index as presented in our study to PA pressure (Citation21). To the best our knowledge, we are the first to report strong inverse correlation of RVSm and its velocity time integral to invasively measured mPAP. The afterload sensitivity of RVSmVTI can be utilized in the prediction of PH, as the vast majority of RV dysfunction in the setting of pulmonary vascular disease is afterload dependent. We clearly show that this measure will track with changes in RV afterload and also with good accuracy.
RVD/Tpeak was tested as a new index of systolic PA pressure in a recent study by McLean et al. (Citation22). This index was strongly correlated to invasively measured systolic PA pressure (r = 0.87) in nine patients, and a cutoff of 22 cm/sec predicted the presence of PH with 80% sensitivity and 83% specificity. Our study, comprising 100 COPD patients without and with mild to moderate PH, documents data that are consistent with the study of McLean et al. (Citation22). The numbers of misclassified subjects were 9 of 50 participants with slightly lower sensitivity and specificity than PAAcT and RVSmVTI (Figures and ). However, both sensitivity and specificity were still high and not inferior to standard approaches by tricuspid regurgitation based estimate.
Two studies have demonstrated good correlations between peak tricuspid regurgitation jet velocity and invasive measured systolic PA pressure (Citation25, Citation26). This method, however, is limited in particular in COPD by reduced quality of the Doppler signals due to hyper inflated lungs, expansion of the thoracic cage and alteration in the position of the heart. The success rate in estimating systolic PA pressure from unenhanced tricuspid regurgitation jet velocity ranges from 30 to 66% (Citation12, Citation27). We improved the feasibility of the tricuspid regurgitation velocity method by applying agitated saline to enhance the jet signals, and succeeded in 84% of COPD patients, which is similar to Gartman et al. (Citation28). Using agitated saline will imply intravenous access, which is time consuming and uncomfortable for the patients.
There are limited data available on non-invasive assessment of PVR especially in COPD. In the present study strong correlations between heart rate adjusted PA acceleration time by quadratic regression and SmVTI versus invasive PVR were observed, however, correlation was less robust at markedly elevated PVR (>5Wu) (Figures A and C), which is in line with others (Citation29). However, correlations and limits of agreement were similar to the recommended method by Abbas et al. (Figure ). Compared to the method by the same scientist, the area under the curve was significantly better for PA acceleration time and statistical similar for RVSmVTI. Both methods, however, showed a similar correlation to PVR by right heart catheterization and were not inferior predictors of PVR (Figure ). They also showed high feasibility compared to the standard tricuspid regurgitation velocity method, which is in line with previous reports (Citation18, Citation30). The present study reports on elevated PVR, defined as >2 WU, to identify early remodeling in the pulmonary circulation, contrasting the most used clinical cutoff value, PVR>3WU.
We consider measurements of intraclass coefficient of intra- and interobserver variability in echo recordings to be important according to the relatively large variability in the assessment of different echo indices. In the present study RVSmVTI and RVSm were selected, since they represented relative new TDI indices for the evaluation of pulmonary circulation and RV function, respectively. The two other indices were chosen in this respect according to their ability to measure time in the TDI image (Tpeak) and length in the 2D image (RVD1).
Clinical implications
The present study has demonstrated data on agreement and correlations between PA acceleration time and RVSmVTI versus invasive measured PA pressures and PVR, which are similar or better than the method previously described by Abbas et al. and others (Citation4, Citation18). Besides, both echo indices have demonstrated 100% feasibility, which we consider to be of significant clinical importance in particular in patients with COPD with their reduced acoustic conditions. We therefore suggest that both methods should be implemented in future echo evaluation in this group of patients.
It is debated whether elevated mPAP in COPD is of clinical relevance. Recent data, however, suggest that even small elevation in mPAP can influence mortality (Citation31), hospitalization (Citation32) and patient outcomes (Citation9, Citation33, Citation34). Although targeted treatment for PH in COPD remains to be established, future clinical attention should nevertheless be concentrated on early identification of altered pulmonary circulation and PH, because interventions at an early stage may reverse the process or slow its progression (Citation35). As previously shown by our group (Citation11), patients with clinical suspicion of PH and PaO2<9.5 kPa should be further examined with regard to PH.
Limitations
The invasive and non-invasive investigations were performed non-simultaneously due to comprehensive echocardiographic examinations. The time interval between examinations introduces a potential source of error due to biologic variation. To minimize these variations, echocardiographic examinations preceded RHC by no more than 120 minutes and were performed under comparable fasting and loading conditions.
The present study comprises a narrowly defined population of stable COPD patients without co-morbidities and clinical established LV disease to study exclusively the impact of pre-capillary pulmonary vascular disease. We therefore cannot extrapolate our findings to all patients with COPD.
Our patients had slightly elevated systemic blood pressure and pulmonary wedge pressure in the upper part of normal limits. Thus, latent LV diastolic heart failure with preserved ejection fraction cannot entirely be excluded. These considerations are thoroughly discussed in a previous paper including the same patients (Citation9).
TDI S velocity and its integral might be influenced by other mechanisms than RV afterload as impaired regional contractility due to myocardial infarction, postoperative state, tachy- or brady arrhythmias, all conditions that should be taken into consideration using this method as a substitute for invasive PAP. Measurements by TDI can be challenging because careful placement of the sample of volume at tricuspid annulus is required. However, this measurement is now being increasingly performed on a routine basis and errors from inaccurate sampling are less likely to occur.
Conclusion
In a COPD population free of LV disease and co-morbidities, mPAP and PVR were determined noninvasively by echocardiography with conventional and novel TDI techniques, Heart rate-adjusted PA acceleration time and RVSmVTI are simple and reproducible methods that correlate well with PA pressure and PVR and show a high degree of accuracy. They are therefore echo indices to be considered in the echocardiographic assessment of COPD patients with suspicion of PH, and may be of particular interest in cases with inadequate tricuspid Doppler signal.
Funding
This work was supported by Eastern Norway Regional Health Authority, 2303 Hamar, Norway and Department of Cardiology, Oslo University Hospital, Aker, Norway.
Declaration of Interest Statement
The authors report no conflicts of interest. The authors alone are responsible for the content and writing of the paper.
Color versions for one or more of the figures in the article can be found online at www.tandfonline.com/icop.
References
- Galiè N, Hoeper MM, Humbert M, Torbicki A, Vachiery JL, Barbera JA, et al. Guidelines for the diagnosis and treatment of pulmonary hypertension. Eur Heart J 2009; 30:2493–2537.
- Yock PG, Popp RL. Noninvasive estimation of right ventricular systolic pressure by Doppler ultrasound in patients with tricuspid regurgitation. Circulation 1984; 70:657–662.
- Rudski LG, Lai WW, Afilalo J, Hua L, Handschumacher MD, Chandrasekaran K, et al. Guidelines for the echocardiographic assessment of the right heart in adults: a report from the American Society of Echocardiography endorsed by the European Association of Echocardiography, a registered branch of the European Society of Cardiology, and the Canadian Society of Echocardiography. J Am Soc Echocardiogr 2010; 23:685–713.
- Abbas AE, Fortuin FD, Schiller NB, Appleton CP, Moreno CA, Lester SJ. A simple method for noninvasive estimation of pulmonary vascular resistance. J Am Coll Cardiol 2003; 41:1021–1027.
- Scapellato F, Temporelli PL, Eleuteri E, Corra U, Imparato A, Giannuzzi P. Accurate noninvasive estimation of pulmonary vascular resistance by Doppler echocardiography in patients with chronic failure heart failure. J Am Coll Cardiol 2001; 37:1813–1819.
- Haddad F, Zamanian R, Beraud AS, Schnittger I, Feinstein J, PetersonT, et al. A novel non-invasive method of estimating pulmonary vascular resistance in patients with pulmonary arterial hypertension. J Am Soc Echocardiogr 2009; 22:523–529.
- Bech-Hanssen O, Karason K, Rundqvist B, Bollano E, Lindgren F, Selimovic N. Can pulmonary hypertension and increased pulmonary vascular resistance be ruled in and ruled out by echocardiography? J Am Soc Echocardiogr 2013; 26:469–478.
- Bossone E, D’Andrea A, D’Alto M, Citro R, Argiento P, Ferrara F, et al. Echocardiography in pulmonary arterial hypertension: from diagnosis to prognosis. J Am Soc Echocardiogr 2013; 26:1–14.
- Hilde JM, Skjorten I, Hansteen V, MelsomMN, Hisdal J, Humerfelt S, et al. Haemodynamic responses to exercise in patients with COPD. Eur Respir J 2013; 41:1031–1041.
- Hilde JM, Skjorten I, Grotta OJ, Hansteen V, Melsom MN, Hisdal J, et al. Right ventricular dysfunction and remodeling in chronic obstructive pulmonary disease without pulmonary hypertension. J Am Coll Cardiol 2013;62:1103–11.
- Skjorten I, Hilde JM, Melsom MN, Hansteen V, Steine K, Humerfelt S. Pulmonary artery pressure and PaO2 in chronic obstructive pulmonary disease. Respir Med 2013; 107:1271–1279.
- Tramarin R, Torbicki A, Marchandise B, Laaban JP, Morpurgo M. Doppler echocardiographic evaluation of pulmonary artery pressure in chronic obstructive pulmonary disease. A European multicentre study. Working Group on Noninvasive Evaluation of Pulmonary Artery Pressure. European Office of the World Health Organization, Copenhagen. Eur Heart J 1991; 12:103–111.
- Rabe KF, Hurd S, Anzueto A, Barnes PJ, Buist SA, Calverley P, et al. Global strategy for the diagnosis, management, and prevention of chronic obstructive pulmonary disease: GOLD executive summary. Ame J Respir Crit Care Med 2007; 176:532–555.
- Kovacs G, Olschewski A, Berghold A, Olschewski H. Pulmonary vascular resistances during exercise in normal subjects: a systematic review. Eur Respir J 2012; 39:319–328.
- Himelman RB, Stulbarg M, Kircher B, Lee E, Kee L, Dean NC, et al. Noninvasive evaluation of pulmonary artery pressure during exercise by saline-enhanced Doppler echocardiography in chronic pulmonary disease. Circulation 1989; 79:863–871.
- Brennan JM, Blair JE, Goonewardena S, Ronan A, Shah D, Vasaiwala S, et al. Reappraisal of the use of inferior vena cava for estimating right atrial pressure. J Am Soc Echocardiogr 2007; 20:857–861.
- Stewart WJ, Jiang L, Mich R, Pandian N, Guerrero JL, Weyman AE. Variable effects of changes in flow rate through the aortic, pulmonary and mitral valves on valve area and flow velocity: impact on quantitative Doppler flow calculations. J Am Coll Cardiol 1985; 6:653–662.
- Tossavainen E, Soderberg S, Gronlund C, Gonzalez M, Henein MY, Lindqvist P. Pulmonary artery acceleration time in identifying pulmonary hypertension patients with raised pulmonary vascular resistance. Eur Heart J Cardiovasc Imaging 2013; 14:890–897.
- Chemla D, Castelain V, Humbert M, Hebert JL, Simonneau G, Lecarpentier Y, et al. New formula for predicting mean pulmonary artery pressure using systolic pulmonary artery pressure. Chest 2004; 126:1313–1317.
- Nagueh SF, Mikati I, Kopelen HA, Middleton KJ, Quinones MA, Zoghbi WA. Doppler estimation of left ventricular filling pressure in sinus tachycardia. A new application of tissue doppler imaging. Circulation 1998;98:1644–50.
- Melek M, Esen O, Esen AM, Barutcu I, Fidan F, Onrat E, et al. Tissue Doppler evaluation of tricuspid annulus for estimation of pulmonary artery pressure in patients with COPD. Lung 2006; 184:121–131.
- McLean AS, Ting I, Huang SJ, Wesley S. The use of the right ventricular diameter and tricuspid annular tissue Doppler velocity parameter to predict the presence of pulmonary hypertension. Eur J Echocardiogr 2007; 8:128–136.
- Torbicki A, Skwarski K, Hawrylkiewicz I, Pasierski T, Miskiewicz Z, Zielinski J. Attempts at measuring pulmonary arterial pressure by means of Doppler echocardiography in patients with chronic lung disease. Euro Respir J 1989; 2:856–860.
- Kitabatake A, Inoue M, Asao M, Masuyama T, Tanouchi J, Morita T, et al. Noninvasive evaluation of pulmonary hypertension by a pulsed Doppler technique. Circulation 1983; 68:302–309.
- Arcasoy SM, Christie JD, Ferrari VA, Sutton MS, Zisman DA, Blumenthal NP, et al. Echocardiographic assessment of pulmonary hypertension in patients with advanced lung disease. Am J Respir Crit Care Med 2003; 167:735–740.
- Currie PJ, Seward JB, Chan KL, Fyfe DA, Hagler DJ, Mair DD, et al. Continuous wave Doppler determination of right ventricular pressure: a simultaneous Doppler-catheterization study in 127 patients. J Am Coll Cardiol 1985; 6:750–756.
- Rich JD, Shah SJ, Swamy RS, Kamp A, Rich S. Inaccuracy of Doppler echocardiographic estimates of pulmonary artery pressures in patients with pulmonary hypertension: implications for clinical practice. Chest 2011; 139:988–993.
- Gartman EJ, Blundin M, Klinger JR, Yammine J, Roberts MB, Dennis MF. Initial risk assessment for pulmonary hypertension in patients with COPD. Lung 2012; 190:83–89.
- Dahiya A, Vollbon W, Jellis C, Prior D, Wahi S, Marwick T. Echocardiographic assessment of raised pulmonary vascular resistance: application to diagnosis and follow-up of pulmonary hypertension. Heart 2010; 96:2005–2009.
- Martin-Duran R, Larman M, Trugeda A, Vazquez de Prada JA, Ruano J, Torres A, et al. Comparison of Doppler-determined elevated pulmonary arterial pressure with pressure measured at cardiac catheterization. Am J Cardiol 1986; 57:859–863.
- Oswald-Mammosser M, Weitzenblum E, Quoix E, Moser G, Chaouat A, Charpentier C, et al. Prognostic factors in COPD patients receiving long-term oxygen therapy. Importance of pulmonary artery pressure. Chest 1995; 107:1193–1198.
- Kessler R, Faller M, Fourgaut G, Mennecier B, Weitzenblum E. Predictive factors of hospitalization for acute exacerbation in a series of 64 patients with chronic obstructive pulmonary disease. Am J Respir Crit Care Med 1999; 159:158–164.
- Cuttica MJ, Kalhan R, Shlobin OA, Ahmad S, Gladwin M, Machado RF, et al. Categorization and impact of pulmonary hypertension in patients with advanced COPD. Respir Med 2010; 104:1877–1882.
- Sims MW, Margolis DJ, Localio AR, Panettieri RA, Kawut SM, Christie JD. Impact of pulmonary artery pressure on exercise function in severe COPD. Chest 2009; 136:412–419.
- Rubin LJ. Cor pulmonale revisited. J Am Coll Cardiol 2013; 62:1112–1123.