Abstract
Interaction of integrins with extracellular matrices is essential for cell adhesion to substrata. Ventral surfaces of fibroblasts adhering to flat substrata are not flat but have uneven 3D topology. However, spatial relationship between the topology of the ventral cell surface and arrangement of extracellular matrix fibrils remains unclear. Here, we report a novel and simple method based on total internal reflection fluorescence microscopy to quantify the distance between the ventral plasma membrane and the glass substratum. We observe that the distance varies from < 25 nm at focal adhesions to 40–50 nm at close contacts and > 80 nm in other regions. Furthermore, by applying this novel method, we show that fibronectin fibrils are also separated from the substratum in regions where the ventral cell surface-substratum distance is > 80 nm. Our results reveal that fibronectin fibrils are not simply adsorbed to the glass substratum but follow the ventral cell surface topology.
INTRODUCTION
Cell adhesion to the extracellular matrix (ECM) is essential for cellular morphogenesis, migration and proliferation. Integrins, heterodimeric transmembrane receptors for ECM proteins, play a central role in the cell-ECM adhesion. Integrin molecules form clusters on the plasma membrane, which provide links between ECM and actin cytoskeleton. In particular, cells spread on the 2D surface develop well-organized adhesion structure called focal adhesion (FA), where the tip of an actin stress fiber is anchored to an integrin cluster through a plaque of cytoplasmic proteins including vinculin, talin and α-actinin (CitationGeiger et al., 2001).
Specific sets of integrins bind to specific ECM proteins. For example, α5β1 integrin is the primary receptor of fibronectin (FN), a ubiquitous ECM protein, and the binding of α5β1 integrin to FN is crucial for fibrillogenesis of FN (CitationSingh et al., 2010). At FAs, α5β1 integrin is colocalized with FN fibrils (CitationKatz et al., 2000). However, in conventional immunofluorescence observations, α5β1 integrin is not localized along the entire length of FN fibrils (CitationDamsky et al., 1985; CitationCattelino et al., 1999; CitationHirata et al., 2004). Therefore, integrin distribution is not determined solely by 2D distribution of its ligands. Since integrin affinity for its ligands can be regulated by the “inside-out” signaling (CitationHarburger & Calderwood 2009), the spatial regulation of integrin-ECM affinity may be involved in the regulation of integrin distribution. However, the exact mechanism underlying the differential distributions of integrin and its ligand ECM fibrils remains to be elucidated.
When cells spread on a flat substratum, their ventral plasma membranes (VPMs) are not flat but have 3D topology. Using interference reflection microscopy (CitationIzzard & Lochner 1976), electron microscopy (Chen & Singer Citation1982) and total internal reflection fluorescence (TIRF) microscopy (CitationLanni et al., 1985; CitationTruskey et al., 1992), it has been revealed that distance between the VPM and the substratum is 10–20 nm at FAs and > 100 nm in other regions. If one considers the size of an integrin molecule (8 × 12 nm for an extracellular headpiece and 18 nm for flexible legs (CitationWeise et al., 1992)), the gap between the VPM and the substratum outside FAs is much larger than the reach of the molecule. Therefore, if ECM fibrils are lying on the flat substratum, integrin molecules outside FAs would not gain access to the fibrils. Thus, the 3D topology of the VPM may contribute to the differential distributions of integrin and ECM fibrils. However, the role of VPM topology in the regulation of integrin distribution is unknown. In particular, it is not clear whether ECM fibrils outside FAs are associating with the VPM or are lying on the substratum separated from the VPM.
In this study, we demonstrate a novel TIRF microscopy-based approach to quantify the distance between the VPM and the substratum. And we show the relationship between VPM topology and 3D arrangement of FN fibrils.
METHODS
Cell culture
Swiss 3T3 fibroblasts and Hs68 human foreskin fibroblasts were cultured in Dulbecco's modified Eagle's medium (Nissui, Tokyo) supplemented with 10% fetal bovine serum (Nipro, Osaka, Japan) at 37°C in 5% CO2. For experiments, cells were grown on glass slides, which were precoated with 100 μg/ml FN when indicated. For the myosin II-inhibition experiments, cells were treated with 100 μM blebbistatin (Toronto Research Chemicals, North York, Canada) for 30 minutes (CitationStraight et al., 2003).
Staining of plasma membrane, fibronectin and α5β1 integrin
Cells were fixed for 30 minutes with 4% formaldehyde in the external buffer (125 mM potassium acetate, 1.8 mM CaCl2, 0.8 mM MgCl2, 12 mM glucose, 25 mM HEPES pH 7.0), followed by blocking with 1% BSA, 0.5% glycine and 25 mM NH4Cl for 30 minutes. For the TIRF observation in the presence of B-phycoerythrin, 33 nM B-phycoerythrin (Molecular Probes, Eugene, OR) was added to the external buffer. For the staining of plasma membranes, cells were treated with 30 μM 1,1′-dihexadecyl-3,3,3′,3′-tetramethylindocarbocyanine perchlorate (DiI; Molecular Probes) for 2 minutes. Fibronectin was stained with anti-fibronectin antibody (Santa Cruz Biotechnology, Santa Cruz, CA) and Alexa 488-conjugated anti-rabbit IgG antibody (Molecular Probes). α5β1 integrin was stained with anti-α5β1 integrin antibody (Millipore, Billerica, MA) and Alexa 546-conjugated anti-mouse IgG antibody (Molecular Probes). When indicated, plasma membranes were permeabilized with 0.2% Triton X-100 in the external buffer for 5 minutes after the fixation.
TIRF microscopy
Cells were observed with an inverted fluorescence microscope (Axiovert S100, Carl Zeiss, Jena, Germany) equipped with an oil immersion objective (NA 1.3, 100 × ; Plan-NEOFLUAR, Carl Zeiss) and an ICCD video camera (C2400 - 89, Hamamatsu Photonics, Hamamatsu, Japan). The acquired images were analyzed off-line with the public domain ImageJ program (version 1.45f).
TIRF microscopy was carried out as described previously (CitationHirata et al., 2003). In brief, the glass slide on which cells were grown was coupled to two prisms with immersion oil. The laser beam was incident on one prism, suffered multiple total internal reflections inside the glass slide and exited from the other prism. Blue (wavelength = 473 nm; BCL-015, Crystalaser, Reno, NV) or green (wavelength = 532 nm; DPSS532, Coherent, Santa Clara, CA) laser was used as light source.
Quantification of VPM-to-substratum separation
TIRF images of B-phycoerythrin solution were used for quantifying VPM-to-substratum separation. Adsorption of B-phycoerythrin to cells and glass substrata was much less than that of rhodamine-conjugated dextran (Hirata, unpublished result).
The evanescent field intensity I(z) decays exponentially with distance z from the glass substratum surface as
where the decay length d is calculated to be 73 nm in our case (wavelength = 532 nm, and incidence angle = 72.7°) (CitationAxelrod et al., 1984). The fluorescence intensity from the unit volume of B-phycoerythrin solution located at z will be proportional to I(z), and, therefore, can be expressed as
where C is a constant. The fluorescence intensity in the TIRF image of B-phycoerythrin can be obtained by integrating f(z) along z. In the cell region of the TIRF image, B-phycoerythrin molecules are confined between the glass substratum surface and the VPM. When the VPM-to-substratum separation is l(x, y) at the position (x, y), the fluorescence intensity in the cell region of the TIRF image is
On the other hand, the fluorescence intensity in the TIRF image outside the cell region is
From the equations (3) and (4), the distance between the glass substratum surface and the VPM at the position (x, y) is expressed as
The value of Fout was obtained from the mean fluorescence intensity outside the cell region. At points where Fout – F(x, y) ≤ 0, l(x, y) was set zero. We found that the real cell boundary, especially the protruding edge, did not always match the TIRF image of B-phycoerythrin (Supplementary Figure 1 available online at http://www.informahealthcare.com/doi/abs/10.3109/15419061.2012.665968). For this reason, the cell region was defined by the epi-fluorescence image of the DiI-stained plasma membrane.
RESULTS AND DISCUSSION
To visualize the space between the VPM and the surface of the glass substratum, the fluorescent protein, B-phycoerythrin, was added to the extracellular solution, and then the specimen was observed with TIRF microscopy. Fluorescence intensity was lower in the cell region than in the region outside the cell (). In the cell region, dark streaks were observed (, arrows). These streaks were reminiscent of FAs, and were likely to be caused by low amount of B-phycoerythrin due to short distance between the VPM and the substratum at FAs. To test this possibility, after washing out B-phycoerythrin, the plasma membrane of the same cell was stained with DiI. The epi-fluorescence image indicates staining of the entire plasma membrane (). However, only bright streaks were observed with TIRF microscopy (, arrows). These bright streaks represent vinculin-positive FA sites (CitationLanni et al., 1985; CitationHirata et al., 2003), and clearly corresponded to the dark streaks in the B-phycoerythrin image. These results indicate that TIRF intensity of B-phycoerythrin in the cell region identifies the locations where separation of the VPM from the substratum surface is small.
Figure 1. Quantification of VPM-to-substratum separation. (A) A Swiss 3T3 cell on the non-coated glass substratum was observed with TIRF microscopy in the presence of B-phycoerythrin. Arrows indicate dark streaks in the cell region. (B) An epi-fluorescence image of the plasma membrane of the same cell as in (A). After the observation of (A), B-phycoerythrin was washed out, and then the plasma membrane was stained with DiI. (C) A TIRF image of the same region as in (B). Arrows indicate bright streaks corresponding to FAs. (D) The map showing the distance between the substratum surface and the VPM of the same cell as in (A–C). The distance was calculated as described in METHODS. The pseudocolor scale in nm is in the right. At FAs, VPM-to-substratum separation was < 25 nm (arrows). Bar, 20 μm.
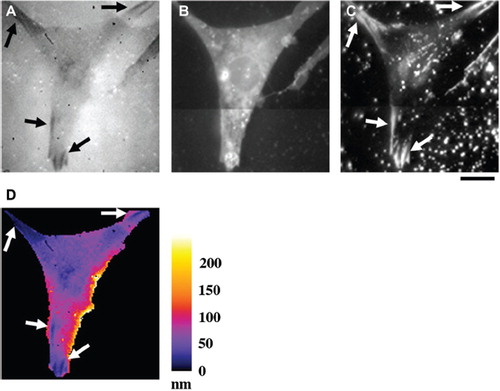
From TIRF intensity of B-phycoerythrin, we calculated distance between the VPM and the substratum as described in METHODS, and show the result in . According to this result, VPM-to-substratum separation was < 25 nm at FAs (dark blue-colored regions; , arrows). The upper bound value is in good agreement with the values reported previously using interference reflection microscopy (CitationIzzard & Lochner 1976) or electron microscopy (Chen & Singer Citation1982). In broad purple regions around FAs, the separation was 40–50 nm. These regions possess, both qualitatively and quantitatively, the characteristics of close contacts (CitationIzzard & Lochner 1976; Chen & Singer Citation1982). In other regions colored in magenta-to-orange, the separation was > 80 nm, which is consistent with the previous results obtained using interference reflection and electron microscopes (CitationIzzard & Lochner 1976; Chen & Singer Citation1982). These results indicate that topology of the VPM on a nanometer scale can be quantitatively evaluated with TIRF microscopy using fluorescent protein-containing extracellular solution.
Next, we examined 3D arrangement of FN fibrils. When cells on the FN-coated substratum were stained for FN, FN fibrils were observed in the ventral focal plane with epi-fluorescence microscopy (). FN fibrils were also observed on the apical surface of the cell (data not shown). These apical FN fibrils had high fluorescence intensity probably due to high accessibility of antibody molecules and were observed as blurred bright pattern in the epi-fluorescence image (, arrowhead). When the same area was observed with TIRF microscopy (), the fluorescence from the apical fibrils disappeared. Some ventral fibrils were partially invisible in the TIRF image (filled arrows in and ), while the fibrils in their vicinity were visible along their entire length (open arrows in and ). The partial appearance of FN fibrils in the TIRF image was confirmed by plotting epi-fluorescence and TIRF intensities along individual FN fibrils (). The epi-fluorescence and TIRF intensities varied similarly until the middle of the FN fibril (arrows in ). However, beyond that point, epi-fluorescence intensity became higher, while TIRF intensity remained low. These results indicate that ventral FN fibrils can be separated from the substratum surface.
Figure 2. Epi-fluorescence and TIRF observations of FN fibrils. Hs68 human foreskin fibroblasts on the FN-coated glass substratum were fixed and stained for FN. To improve accessibility of antibody molecules to ventral FN fibrils, plasma membranes were permeabilized after the fixation. (A and B) Epi-fluorescence (A) and TIRF (B) images of FN. The dotted line in (A) indicates the cell boundary, and the upper part of the image represents the cell region. The blurred bright region indicated by an arrowhead in (A) represents a FN fibril located on the apical surface of the cell. Bar, 10 μm. (C) Plots of epi-fluorescence (black diamonds) and TIRF (gray squares) intensities along one FN fibril indicated by a double arrowhead in (A and B). Intensities were normalized to the maximum values in the individual plots.
We examined whether pre-coating of the glass surface with FN affected VPM topology. Cells on FN-coated glass substrata developed long linear contact regions (dark lines in Supplementary Figure 2A), presumably corresponding to fibrillar adhesions (also called ECM contacts) (CitationChen et al., 1985; CitationKatz et al., 2000; CitationZamir et al., 2000). However, apart from this feature, VPM-to-glass substratum separation was comparable to that of the cells on a bare glass substratum (Supplementary Figure 2B).
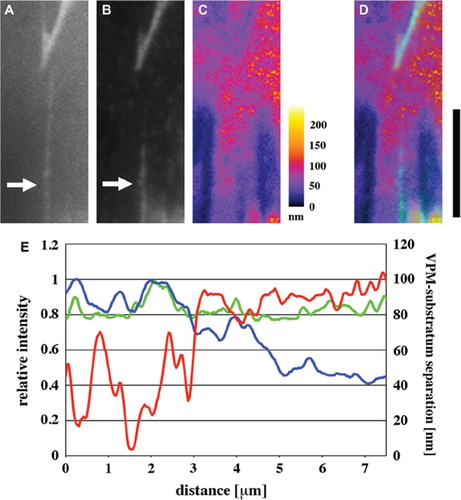
To examine the relationship between VPM topology and 3D arrangement of FN fibrils, cells stained for FN were observed with TIRF and epi-fluorescence microscopy in the presence of B-phycoerythrin. Again, some FN fibrils that appeared in the epi-fluorescence image (, arrow) were only partially visible in the TIRF image (, arrow). Distance between the VPM and the substratum was calculated in the same region based on the TIRF intensity of B-phycoerythrin (). Thus, in (merged image of Figures 3B and C), the FN fibril became invisible where the VPM-to-substratum separation was > 80 nm. In the simultaneous plot of VPM-to-substratum separation and epi-fluorescence and TIRF intensities of FN along the fibril (), the epi-fluorescence and TIRF intensities varied similarly in the region where the separation of VPM was < 80 nm. However, only TIRF intensity drastically dropped when the separation was > 80 nm, revealing close correlation between 3D arrangement of FN fibrils and the VPM topology. The spatial correlation similar to that shown in was apparent from the comparison of the TIRF image of DiI-stained VPM with TIRF and epi-fluorescence images of FN fibrils (Supplementary Figure 3). These results strongly suggest that FN fibrils are not simply adsorbed to the glass substratum surface but run on the VPM.
It has been well established that fibroblasts grown on flat 2D substrata have uneven VPM topology (CitationIzzard & Lochner 1976; Chen & Singer Citation1982; CitationLanni et al., 1985; CitationTruskey et al., 1992; CitationHirata et al., 2003). Separation between the VPM and the substratum surface has been measured with interference reflection microscopy (CitationIzzard & Lochner 1976) and electron microscopy (Chen & Singer Citation1982). TIRF microscopy has also been used to quantitatively estimate the VPM-to-substratum separation, where plasma membranes or cytoplasm were fluorescently labeled (CitationLanni et al., 1985; CitationTruskey et al., 1992). To calculate the VPM-to-substratum distance from TIRF intensity of fluorescently labeled cells, multiple images obtained with different incidence angles are required (CitationLanni et al., 1985). In contrast, in the present study, we show that the VPM-to-substratum distance can be estimated from a single TIRF image of a fluorescent protein in the extracellular space. There is a previous report using TIRF microscopy employing fluorescent dextran-containing extracellular solution to visualize the VPM topology (CitationGingell et al., 1985). Here, we extend this approach to obtain the map showing the VPM- to-substratum distance on a nanometer scale. Although we have assumed uniform concentration of the fluorescent protein in the extracellular space, and have ignored the effect of fluorescence emitted above the apical surface of the cell, calculated values are in good agreement with the values obtained with interference reflection microscopy or electron microscopy, as discussed above. Since the theoretical study has revealed that TIRF microscopy with extracellular fluorophores is much more sensitive to small changes in distance between the VPM and the substratum than interference reflection microscopy (CitationGingell et al., 1987), and since this approach is essentially noninvasive, the method developed in the present study would be useful especially in quantifying dynamic changes in the VPM-to-substratum separation in living cells.
Relationship between VPM topology and distribution of adhesion proteins has been evaluated using immunoelectron microscopy or interference reflection microscopy combined with immunofluorescence microscopy. At FAs (10–20 nm separation between the VPM and the substratum) and close contacts (30–50 nm separation), the space between the VPM and the substratum can be filled with FN, which enables colocalization of α5β1 integrin and FN (Chen & Singer Citation1982; CitationChen et al., 1985). In other regions, it has been observed that thick FN fibrils run parallel to actin stress fibers and span over a large distance (> 100 nm) between the VPM and the substratum. The structures thus formed are fibrillar adhesions where remarkable colocalization of α5β1 integrin with the FN fibrils occurs (Chen & Singer Citation1982; CitationChen et al., 1985; CitationZamir et al., 2000). However, it still remains unclear whether thinner FN fibrils associate with the VPM or lie on the substratum surface separated from the VPM. The immunoelectron microscopic study has shown immunogold-labeled FN immediately beneath the ventral cell surface apart from the substratum (Chen & Singer Citation1982). However, it is possible that such gold-labeled FN represents monomeric/origomeric FN bound to the cell surface or to the membrane-adjacent ECM layer. Interference reflection microscopy combined with immunofluorescence microscopy has demonstrated that locations of FN fibrils are coincident with both dark and bright streaks of interference reflection images (CitationChen et al., 1985; CitationChen et al., 1986), suggesting that FN fibrils are located not only in cell-to-substratum contact regions but also in regions where VPM is separated from the substratum. However, these studies did not provide information on the separation between the FN fibrils and the substratum surface. Furthermore, interference reflection contrast is affected by both cell thickness and intracellular structures (CitationIzzard & Lochner, 1976). In the present study, using TIRF and epi-fluorescence microscopy, we have revealed that FN fibrils are separated from the substratum surface in the regions where the VPM-to-substratum distance is > 80 nm. While we cannot determine at present the exact distance between the VPM and FN fibrils, our results strongly suggest that FN fibrils are associated with the VPM.
Figure 3. Relationship between VPM-to-substratum separation and FN fibril arrangement. Hs68 human foreskin fibroblasts on the FN-coated glass substratum were fixed, stained for FN without permeabilization, and then observed in the presence of B-phycoerythrin. (A and B) Epi-fluorescence (A) and TIRF (B) images of FN. Arrows indicate the FN fibril only partially visible in the TIRF image. (C) The map showing the distance between the substratum surface and the VPM of the same region as in (A and B). (D) A merged image of (B) and (C). The regions where FN fibrils could be observed with TIRF microscopy are in cyan. Bar, 10 μm. (E) Plots of VPM-to-substratum separation (red line; right scale) and epi-fluorescence (green line) and TIRF (blue line) intensities of FN (left scale) along one FN fibril indicated by arrows in (A and B). Fluorescence intensities were normalized to the maximum values in the individual plots.
Previous observations have shown that fibroblast cells can remove FN from the glass surface and reorganize it into fibrils (CitationAvnur & Geiger 1981; CitationPankov et al., 2000). That FN fibrils are not simply adsorbed to the glass substratum but conform to the 3D topology of the VPM suggests that reorganization of FN fibrils occurs on the VPM surface.
Regulation of integrin localization on a plasma membrane is essential for cell migration and morphogenesis. Although α5β1 integrin is colocalized with FN fibrils at FAs and fibrillar adhesions (CitationKatz et al., 2000), FN fibrils outside these adhesion sites are not always occupied by α5β1 integrin (Supplementary Figure 4; CitationDamsky et al., 1985; CitationCattelino et al., 1999; CitationHirata et al., 2004), indicating that distribution of α5β1 integrin is not determined solely by 2D distribution of FN fibrils.
As demonstrated in previous studies (CitationIzzard & Lochner 1976; Chen & Singer Citation1982; CitationLanni et al., 1985) and also shown in this study, the VPM is separated by > 80 nm from the substratum surface outside FAs and close contacts. Therefore, if FN fibrils were lying on the substratum, the fibrils located outside FAs would be too distant from the VPM to interact with integrin molecules. However, this scenario is unlikely, because, as revealed in this study, FN fibrils are associated with the VPM even in the regions where the VPM is separated from the substratum.
Alternatively, integrin affinity for its ligands may be reduced outside FAs and fibrillar adhesions. Binding of the talin head domain to the cytoplasmic tail of integrin activates integrin to interact with its ligand (CitationHarburger & Calderwood 2009), and this activation may be confined in FA and fibrillar adhesion sites. Another intriguing possibility is the tension-dependent regulation of the integrin-FN interaction. Recently, it has been revealed that the binding of α5β1 integrin to FN is strengthened by mechanical tension acting on this bond (CitationFriedland et al., 2009; CitationKong et al., 2009). In fact, we observed that in the cells treated with blebbistatin, an inhibitor of myosin-II activity, dark spots appeared within individual α5β1 integrin clusters (compare Supplementary Figure 5A-C, G-I with S5D-F, J-L). This suggests dissociation of α5β1 integrin from FA sites in response to inhibition of myosin II-based cellular tension. If FN fibrils are not bound to the rigid substratum but are associated with the VPM, sufficient tension would not be developed between α5β1 integrin and these fibrils, and binding affinity of α5β1 integrin to these FN fibrils would remain low. Our observation is consistent with this notion. Such spatial regulation(s) of α5β1 integrin affinity to FN may be important for individual integrin molecules to be free from unnecessary interaction with FN fibrils outside adhesion sites, and may be involved in cell migration and morphogenesis. Further studies are needed to reveal the exact mechanism underlying the differential distributions of α5β1 integrin and FN fibrils.
Supplementary Figures 1–5
Download PDF (4.1 MB)ACKNOWLEDGEMENTS
We thank Dr. Sri Ram Krishna Vedula (National University of Singapore) for proofreading of the manuscript and Dr. Hiroaki Machiyama (National University of Singapore) for technical support. We also thank two reviewers’ helpful comments that significantly improved the manuscript. This work was supported in part by Grants-in-aid for General Scientific Research from the Ministry of Education Science Sports and Culture (to HM).
Declaration of interest: The authors report no conflicts of interest. The authors alone are responsible for the content and writing of the article.
REFERENCES
- Avnur Z, Geiger B (1981). The removal of extracellular fibronectin from areas of cell-substrate contact. Cell. 25: 121–132.
- Axelrod D, Burghardt TP, Thompson NL (1984). Total internal reflection fluorescence. Annu Rev Biophys Bioeng. 13: 247–268.
- Cattelino A, Albertinazzi C, Bossi M, Critchley DR, de Curtis I (1999). A cell-free system to study regulation of focal adhesions and of connected actin cytoskeleton. Mol Biol Cell. 10: 373–391.
- Chen WT, Hasegawa E, Hasegawa T, Weinstock C, Yamada KM (1985). Development of cell surface linkage complexes in cultured fibroblasts. J Cell Biol. 100: 1103–1114.
- Chen WT, Wang J, Hasegawa T, Yamada SS, Yamada KM (1986). Regulation of fibronectin receptor distribution by transformation, exogenous fibronectin, and synthetic peptides. J Cell Biol. 103: 1649–1661.
- Chen WT, Singer SJ. (1982). Immunoelectron microscopic studies of the sites of cell-substratum and cell-cell contacts in cultured fibroblasts. J Cell Biol. 95: 205–222.
- Damsky CH, Knudsen KA, Bradley D, Buck CA, Horwitz AF (1985). Distribution of the cell substrate attachment (CSAT) antigen on myogenic and fibroblastic cells in culture. J Cell Biol. 100: 1528–1539.
- Friedland JC, Lee MH, Boettiger D (2009). Mechanically activated integrin switch controls α5β1 function. Science. 323: 642–644.
- Geiger B, Bershadsky A, Pankov R, Yamada KM (2001). Transmembrane extracellular matrix-cytoskeleton crosstalk. Nat Rev Mol Cell Biol. 2: 793–805.
- Gingell D, Heavens OS, Mellor JS (1987). General electromagnetic theory of total internal reflection fluorescence: the quantitative basis for mapping cell-substratum topography. J Cell Sci. 87: 677–693.
- Gingell D, Todd I, Bailey J (1985). Topography of cell-glass apposition revealed by total internal reflection fluorescence of volume markers. J Cell Biol. 100: 1334–1338.
- Harburger DS, Calderwood DA (2009). Integrin signalling at a glance. J Cell Sci. 122: 159–163.
- Hirata H, Ohki K, Miyata H (2003). Change of the topography of ventral cell surface during spreading of fibroblasts as revealed by evanescent wave-excited fluorescence microscopy: effect of contractility and microtubule integrity. JSME Int J Ser C. 46: 1208–1217.
- Hirata H, Ohki K, Miyata H (2004). Dynamic change in the distribution of alpha5beta1 integrin on isolated ventral membrane: effect of divalent cation species. Cell Motil Cytoskeleton. 59: 131–140.
- Izzard CS, Lochner LR (1976). Cell-to-substrate contacts in living fibroblasts: an interference reflexion study with an evaluation of the technique. J Cell Sci. 21: 129–159.
- Katz BZ, Zamir E, Bershadsky A, Kam Z, Yamada KM, Geiger B (2000). Physical state of the extracellular matrix regulates the structure and molecular composition of cell-matrix adhesions. Mol Biol Cell 11: 1047–1060.
- Kong F, García AJ, Mould AP, Humphries MJ, Zhu C (2009). Demonstration of catch bonds between an integrin and its ligand. J Cell Biol. 185: 1275–1284.
- Lanni F, Waggoner AS, Taylor DL (1985). Structural organization of interphase 3T3 fibroblasts studied by total internal reflection fluorescence microscopy. J Cell Biol. 100: 1091–1102.
- Pankov R, Cukierman E, Katz BZ, Matsumoto K, Lin DC, Lin S, Hahn C, Yamada KM (2000). Integrin dynamics and matrix assembly: tensin-dependent translocation of α5β1 integrins promotes early fibronectin fibrillogenesis. J Cell Biol. 148: 1075–1090.
- Singh P, Carraher C, Schwarzbauer JE (2010). Assembly of fibronectin extracellular matrix. Annu Rev Cell Dev Biol. 26: 397–419.
- Straight AF, Cheung A, Limouze J, Chen I, Westwood NJ, Sellers JR, Mitchison TJ (2003). Dissecting temporal and spatial control of cytokinesis with a myosin II inhibitor. Science 299: 1743–1747.
- Truskey GA, Burmeister JS, Grapa E, Reichert WM (1992). Total internal reflection fluorescence microscopy (TIRFM) II. Topographical mapping of relative cell/substratum separation distances. J Cell Sci. 103: 491–499.
- Weise JW, Nagaswami C, Vilaire G, Bennett JS (1992). Examination of the platelet membrane glycoprotein IIb-IIIa complex and its interaction with fibrinogen and other ligands by electron microscopy. J Biol Chem. 267: 16637–16643.
- Zamir E, Katz M, Posen Y, Erez N, Yamada KM, Katz BZ, Lin S, Lin DC, Bershadsky A, Kam Z, Geiger B (2000). Dynamics and segregation of cell-matrix adhesions in cultured fibroblasts. Nat Cell Biol. 2: 191–196.