Abstract
Previous studies indicate that exposure to perfluorooctanesulfonate (PFOS), a ubiquitous and highly persistent environmental contaminant induces immunotoxicity in mice. However, clear mechanisms to explain any PFOS-induced immunotoxicity are still unknown. The study here sought to examine the ability of PFOS to potentially perturb T-helper (TH)-1 and -2 cell cytokine secreting activities, as well as to cause shifts in antibody isotype levels, as possible mechanisms involved in PFOS-induced immunotoxicity. Adult male C57BL/6 mice were given by gavage 0, 5, or 20 mg PFOS/kg/d for 7 days. One day after the final exposure, spleens from these hosts were isolated and used for analyses of the ex vivo production of TH1-type (interleukin-2 (IL-2), interferon-γ (IFNγ)), TH2-type (IL-4), and IL-10 cytokines by isolated splenocytes. In addition, serum was isolated from these mice in order to assess their levels of immunoglobulin M (IgM) and IgG antibodies. In all studies, levels of the cytokines of the antibodies were quantified via enzyme-linked immunosorbent assay or enzyme-linked immunosorbent spot. The results here showed that IL-2 and IFNγ formation was reduced, but that IL-4 production increased by the 5 and 20 mg PFOS/kg/d treatments. Serum IgM levels decreased significantly (in dose-related manner) as a result of the PFOS exposures; serum IgG levels increased markedly with 5 mg PFOS/kg/d, but decreased slightly with the 20 mg PFOS/kg/d regimens PFOS exposure increased serum corticosterone levels in a dose-dependent manner. These results indicated that, after a high-dose short-term exposure to PFOS, a host’s immune state is likely to be characterized by a shift toward a more TH2-like state that, in turn, may lead to suppression of their cellular response and enhancement of their humoral response.
Introduction
Perfluorooctanesulfonate [PFOS; CF3(CF2)7SO3−], which is produced synthetically or from the metabolism of other perfluorinated chemicals (PFCs) (Butenhoff et al., Citation2006), has extreme thermal, biological, and chemical stability as well as hydrophobic and lipophobic characteristics. These properties make it widely used as industrial surfactants and emulsifiers and in numerous consumer products. Non-stick pans, carpets, furniture, household cleaners, shampoos, shoes, clothing, and convenience food packaging are some of the products that can contain PFCs. PFOS has aroused great concern in scientists in recent years due to its widespread occurrence in the environment, in wildlife and in humans (Giesy and Kannan Citation2001; Calafat et al., Citation2007; Jin et al., Citation2007). Furthermore, it has shifted among biological populations via biological concentration and magnification, leading to excessive accumulation among the higher trophic level of the food chain (such as predators and human beings) (Houde et al., Citation2006; de Vos et al., Citation2008). One of our recent studies indicate that the serum PFOS level in non-occupationally exposed individuals from Shenyang, China increased significantly from 0.03 µg/L in 1987 to 22.4 µg/L in 2002 (a 747-fold increase) and increased 13-fold just in the period from 1999 to 2002 (Jin et al., Citation2007).
PFOS accumulates primarily in the blood and liver (Seacat et al., Citation2003) and exhibits an estimated serum half-life in humans of many years (mean is 8.7 years [± SD = 6.1 years]; range = 2.3–21.3 years) as reported in occupationally exposed individuals (Burris et al., Citation2002). Our studies, as well as those of other investigators, have shown that these compounds can activate certain components of innate immunity (Qazi et al., Citation2009a) but suppress acquired immunity (Yang et al., Citation2000, Citation2001, Citation2002a,Citationb; Dewitt et al., Citation2008; Peden-Adams et al., Citation2008; Dong et al., Citation2009; Qazi et al., Citation2009b; Zheng et al., Citation2009). For instance, 7–10 days of dietary or gavage exposure of mice to either PFOS or perfluorooctanoate (PFOA) causes severe atropy of the thymus (central organ) and spleen (peripheral organ), two important immune organs for acquired immune responses (Yang et al., Citation2000, Citation2001, Citation2002a,Citationb; Qazi et al., Citation2009b). At the same time, the populations of splenocytes and thymocytes of all phenotypes are reduced dramatically in size. With both compounds, the reduction in splenic cellularity is associated with a significant reduction in specific humoral immune responses against foreign antigens, e.g., horse or sheep red blood cells (Yang et al., Citation2002a; Peden-Adams et al., Citation2008; Dong et al., Citation2009; Zheng et al., Citation2009).
Although the above research indicated that PFOS as a chronic toxic chemical could affect host immunity by decreasing the weight of immune organs and numbers of lymphocytes, little information is known about the cellular immune response after PFOS exposure. A large body of evidence implicates differences in cytokine secretion patterns among T-helper (TH)-cell subsets as determinants of the type of immune response made to a particular antigenic challenge. The TH1/TH2 balance has important role for host homeostasis and is very influential in determining disease outcomes (Sato et al., Citation1998; Kulmatycki and Jamali Citation2001; Galon et al., Citation2006).
TH1 and TH2 cells are the major classical subsets of fully differentiated CD4+ T-cells, and their distinctive functions in immune responses correlate with their distinctive cytokine secretion patterns. Interferon-γ (IFNγ) and interleukin-2 (IL-2) are important TH1-type cytokines, whereas IL-4 is major TH2-type cytokine. As a negative regulator, IL-10 (which originally had been thought of as solely a TH2-based cytokine, but now is known to be generated by many lymphocyte/non-lymphocyte cell types) plays an important role during immune responses. In this study, after administration of a high dose of PFOS over a short time frame of exposure, the levels of the TH1-type cytokines IFNγ and IL-2, the TH2-type cytokine IL-4, as well as of IL-10, were assessed by enzyme-linked immunosorbent assay (ELISA) or enzyme-linked immunosorbent spot (ELISPOT) in order to ascertain what changes might have been induced in host immune status as a result of this type of PFOS exposure. ELISA was also used to assess any shifts in total levels of serum immunoglobulin M (IgM) and IgG isotypes in order to provide additional information in this regard.
Methods
Chemicals, antibodies, and supplies
Perfluorooctane sulfonic acid potassium salt (PFOS; FW538.22; purity > 98%) was purchased from Fluka Chemical (Steinheim, Switzerland). Potassium PFOS suspensions were prepared in deionized water with 2% Tween® 80 at various concentrations. Roswell Park Memorial Institute (RPMI)-1640 medium (containing L-glutamine and sodium bicarbonate), phosphate-buffered saline (with or without Ca2+ and Mg2+), and penicillin/streptomycin were purchased from Cellgro (Mediatech, Herndon, VA). The fetal bovine serum was from Hyclone (Logan, UT). Nitroblue tetrazolium chloride (NBT), nicotinamide adenine dinucleotide (NAD+), and phenazine methosulfate were from Amresco (Solon, OH). Luma Plate, Unifilters, and Microscint 20™ were procured from Packard (Meriden, CT). Triton-X, tissue culture plates, and disposable labware were purchased from Sigma (St. Louis, MO). Sodium carbonate (> 99.5% pure) was obtained from Kanto Chemical (Tokyo, Japan). Methyl tertiary-butyl ether (MTBE; HPLC grade), methanol (HPLC grade), acetonitrile (HPLC grade), and ammonium acetate (> 97%) were obtained from Wako Pure Chemical Industries (Osaka, Japan). IL-2 and IL-10 ELISPOT Kits and IL-4 and IFNγ DueSet ELISA Kits were purchased from R&D Systems (Minneapolis, MN).
Animals and treatment
All experiments performed herein were approved by the University Institutional Animal Ethics Committee and conformed to NIH guidelines on the ethical use of animals. For the experiments, adult male C57BL/6 mice (8–10-week-old; weighing 18–20 g) were purchased from the Shanghai Laboratory Animal Center of Chinese Academy of Science (SLAC, Shanghai, China). Male mice were chosen to avoid the hormonal changes associated with cyclic ovulation and menstruation, which can influence the immune system, and moreover, Peden-Adams et al. (Citation2008) demonstrated that male mice are more sensitive than females of the same strain to the immunotoxicity of PFOS. Thirty-six mice were then randomly divided by weight into three groups of 12/group. Once distributed into groups, the mice were acclimated to cage conditions and the treatment room (12-h light/dark cycle, 22 ± 2°C, 60–65% relative humidity) for 1 week before dosing was initiated. Throughout the studies, the mice were provided access to filtered water and food ad libitum.
Exposures consisted of oral administration of PFOS delivered in deionized water containing 2% Tween 80. Control mice received deionized water with 2% Tween 80 only. Mice were dosed once daily via oral gavage for 7 days (0, 5, or 20 mg/kg body weight/d). The food intake (12 mice of each group were assigned into four cages [3/cage]; individual intake was calculated from total group consumption over each 24-h period divided by three) and body weight of each animal was measured daily over the 7-d treatment period. The gavage volume was adjusted based on the most current body weight (to range between 100 and 130 µL) in order to assure consistency of the dose being delivered. Bedding, food, and water were changed twice a week and the mice were observed daily. The concentration and duration of exposure of PFOS in this study was based on the acute oral LD50 for PFOS established by the OECD (Organization for Economic Cooperation and Development) (OECD, Citation2002).
Serum sampling, organ mass and spleen cell culture
Mice were sacrificed 24 h following the final exposure (i.e., Day 8 of the study) and blood was obtained by cardiac puncture. The blood was transferred from the plastic syringe into a plastic EP tube and then centrifuged (400g, 4°C) for 10 min. The resultant sera was collected, placed into a new plastic EP tube, and stored at −80°C for the later IgM and IgG analysis. Thereafter, spleen, thymus, liver, and kidneys were collected aseptically and weighed. All balances were calibrated using standard weights prior to use. Organ mass was normalized for body weight and reported as a somatic index ([organ weight/body weight] × 100).
After weighing, the isolated spleen from each mouse was pressed through a sterile fine-wire mesh with 10 mL of RPMI-1640 (Life Technologies, Burlington, Ontario, Canada) supplemented with 5% heat-inactivated fetal calf serum (FCS) (Hyclone), 25 mM HEPES (Life Technologies), 0.12% gentamicin (Schering, Montreal, Quebec, Canada) and 2 mM glutamine (Life Technologies). Cell suspensions were centrifuged at 350 × g for 10 min at room temperature (RT). Erythrocytes present in the suspension were then lysed with cold 0.17 M NH4Cl and the remaining cells were washed twice with fresh medium. Viability of the spleen cells was determined by trypan blue exclusion and was always > 90%. The isolated spleen cells were then adjusted to a final concentration of 107 cells/mL in RPMI-1640 supplemented with 10% heat-inactivated FCS. Aliquots (500 µL/well) of the suspension were then placed (in triplicate) into 24-well flat-bottom tissue culture plates (Falcon, BD Biosciences, San Jose, CA) and incubated for 48 h at 37°C in a humidified 5% CO2 incubator. The plates were then centrifuged at 350g for 10 min at RT, and the supernatants were collected and stored at −80°C until utilized in the various cytokine assays.
Serum PFOS analysis
Details of the analytical procedure to measure PFOS in each serum sample have been outlined previously (Hansen et al., Citation2001). Briefly, 0.5 mL of serum, 1 mL of 0.5 M tetrabutyl-ammonium hydrogen sulfate solution and 2 mL of sodium carbonate buffer (0.25 M, pH 10) were added to 15 mL polypropylene tube and thoroughly mixed. Following addition of 5 mL of MTBE to the solution, the organic and aqueous layers were separated by centrifugation, and the organic layer was removed. The aqueous mixture was rinsed with MTBE and separated twice. The solvent was evaporated at RT under an N2 gas flow, and the sample then reconstituted in 0.5 mL methanol. The sample was then passed through a nylon filter (Autovial R5 PUNYL; 0.45-µm pore size; Whatman, Tokyo) to remove any suspended materials and insoluble particles.
Each extracted solution was then analyzed by liquid chromatography-mass spectrometry (LC/MS system, Shimadzu, Kyoto, Japan) as previously described (Jin et al., Citation2007). Briefly, each methanol extract (injection volume, 10 µL) was analyzed using HPLC at a flow rate of 0.2 mL/min. Gradient conditions were used in the mobile phase. Initial mobile phase conditions were 35:65 CH3CN/10 mM CH3COONH4 buffer, followed by a 5 min ramp to 45:55, hold until 20 min. The chromatographic column was kept at 40°C. Mass spectra were taken using an LC/MS system equipped with an orthogonal spray interface, employing electrospray ionization in the negative mode. The electrospray probe and ion source were operated at the following conditions: capillary voltage = 4 kV, fragmentor voltages = 200 V, nebulizer pressure = 50 psi, desolvation temperature = 350°C, and desolvation gas flow rate = 101/min. Molecular ion 499 was selected as the primary ion for PFOS (C8F17SO3). The limit of detection and limit of quantification were 0.2 µg/L and 0.5 µg/L, respectively.
Serum corticosterone analysis
On the days of blood collection, movement in and out of the animal suite was limited. Animals were euthanized by dose group to minimize disturbance to other groups and blood was collected from all animals/cage via cardiac puncture within 5 min of removal from the animal suite. Blood was processed as described above for later analysis of corticosterone. The levels of corticosterone in thawed serum samples were measured in duplicate using an RIA kit (ICN Biomedical, Costa Mesa, CA) as described previously (Francis et al., Citation2000). The sensitivity of the corticosterone assay was 0.2 ng/mL.
Measurement of ex vivo production of IL-2 and IL-10 by ELISPOT
Levels of cytokines IL-2 and IL-10 produced/released by splenocytes isolated from treated hosts were measured by ELISPOT, following manufacturer’s protocols for each kit. Briefly, wells in the 96-well PVDF-backed microplate coated with polyclonal antibody specific for mouse IL-2 or IL-10 were first filled with 200 µL of sterile RPMI-1640 media and incubated for ≈20 min at RT. When cells were ready to be plated, the culture media in the wells was aspirated and 100 µL of the appropriate spleen cell preparation (prepared at 1 × 10⁵/ mL for IL-2 and 1 × 10⁶/mL for IL-10) was placed into each of triplicate wells. Wells that received recombinant mouse IL-2 or IL-10 (and no cells) were used as positive controls. The plates were then incubated at 37°C in a 5% CO2 incubator for 1 h. Following the incubation, the plates were washed manually five times, each time by filling every well with Wash Buffer (250–300 µL) via multi-channel pipette. After the last wash, any remaining Wash Buffer was removed by decanting and the plate was then inverted and blotted against a clean paper towel. Diluted Detection Antibody (100 µL aliquots of biotinylated polyclonal antibody specific for mouse IL-2 or IL-10) was then added into each well and the plate was incubated at 4°C overnight. Thereafter, the plates were washed manually five times as noted above. Diluted Streptavidin-AP (in 100 µL aliquots) was then added into each well and the plate was incubated for 2 h at RT. Following another round of five washes, 100 µL of BCIP/NBT Chromogen was added into each well and the plate incubated for a further 1 h in the dark at RT. After the spots were visualized, chromogen solution was removed from the microplate and the latter rinsed with deionized water. Once any excess water was removed, the flexible plastic underdrain from the bottom of the microplate was withdrawn and the plate placed at 37°C for 20 min to dry completely. The final developed microplate was then analyzed using a specialized automated ELISPOT reader (ImmunoSpot, Cellular Technologies [CTL], Shaker Heights, OH).
Measurement of IL-4, IFNγ, IgG, and IgM by ELISA
Levels of cytokines IL-4 and IFNγ, produced/released by splenocytes isolated from treated hosts, as well as of IgG and IgM antibodies present in the serum from these hosts, were measured by ELISA, following manufacturer’s protocols for each kit (R&D Systems for cytokines, Serotec Ltd. [AbD Serotec, Raleigh, NC] for antibodies). The final optical density values for each well in a kit were read at 450 nm using an Emax Microplate Reader (Molecular Devices; Menlo Park, CA). The concentrations of IL-4, IFNγ, IgG, or IgM in each sample were routinely calculated by extrapolation from a standard curve prepared in parallel during each assay.
Statistics
All experiments were repeated two times (two trials) with an N = 6 each. Experimental trials were tested for trial by treatment interactions and when statistically possible, data from trials were combined. Data were tested for normality (using Shapiro–Wilks W-test) and homogeneity (using Bartlett’s test for unequal variances) and, if needed, appropriate transformations were made. The transformations (when required) are outlined in the figure legends. A one-way analysis of variance was used to determine differences among doses for each endpoint using SAS software (version 9.13; SAS Institute Inc., Cary, NC) in which the standard error used a pooled estimate of error variance. When significant differences were detected by the F-test (p < 0.05), a Dunnett’s t-test was used to compare treatment groups to the control group.
Results
Effect of PFOS exposures on animal body weight, food intake, and organ indices
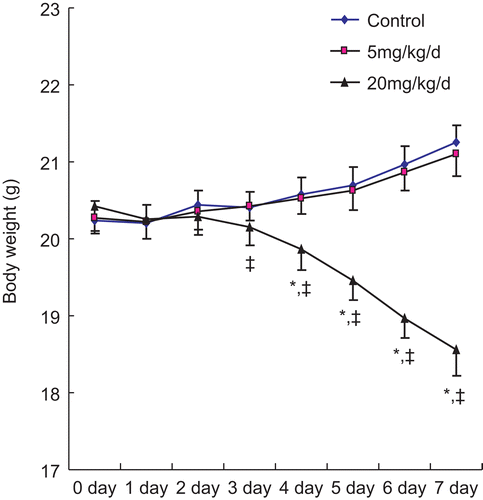
There were no significant differences in body weight and food intake among the treatment groups at the beginning of the experiment. In the 7-d study, the mean body weight in control hosts on Day 0 (pre-treatment timepoint) was 20.24 (± 0.26; SE) g and increased to 21.25 (± 0.22) g by day 7; this represented a net change of ≈5% from baseline. In contrast, the mean body weight of mice exposed to 20 mg PFOS/kg/d showed significant deterioration from 20.43 (± 0.32) g to 18.56 (± 0.34) in the same period, an ≈9.15% loss from their own pre-exposure baseline values. Treatment with the 5 mg PFOS/ kg/d dose did not produce any significant change in body weight over the treatment period ().
Figure 1. Body weight trend among adult male C57BL/6 mice treated orally daily with PFOS for 7 days. Body weight was measured after each day’s treatment of animals. Values shown are in terms of mean ± SE; n = 12 in each group. *Significantly different from control (p ≤ 0.05); ‡significantly different from pre-treatment baseline value (p ≤ 0.05).
One day following the final treatment with 20 mg PFOS/ kg/d, the splenic and thymic indices were each seen to be significantly decreased compared to those values noted with the mice that received daily gavages with saline/ Tween® 80 over the 7 d of treatments (). Treatment with 5 mg PFOS/kg/d had no effect on these parameters. In contrast to those two organs, the hepatic indices of mice that received the 5 and 20 mg PFOS/kg/d treatments were increased by 34 and 79% above the control values, respectively. With none of the PFOS treatments was kidney mass markedly affected.
Table 1. PFOS concentrations in serum (mg/L), body weight, and organ indices in adult male C57BL/6 mice treated orally with PFOS daily for 7 days.
Serum PFOS and corticosterone levels
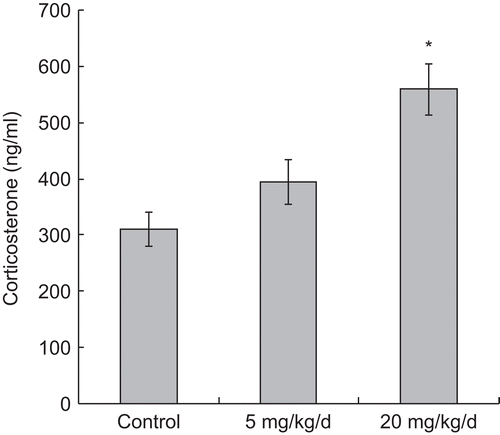
Concentrations of PFOS in serum of mice exposed to either dose of PFOS are shown in . The data indicate that there was a dose-related increase in the levels of PFOS in serum from exposed mice; as expected, PFOS was not detectable in the serum of control mice. Changes in serum corticosterone among the treatment groups are shown in . The corticosterone level (mean ± SE) in sera of control animals at sacrifice was 311.04 (± 30.27) ng/mL. Treatment with 5 mg PFOS/kg/d did not significantly affect serum corticosterone levels (i.e., value = 394.78 [± 40.15] ng/mL). In contrast, these levels were significantly increased in mice that were treated with 20 mg PFOS/kg/d (i.e., value = 559.68 [± 45.43] ng/mL).
Figure 2. Changes in serum corticosterone levels in male C57BL/6 mice following oral exposures to PFOS for 7 days. Serum corticosterone levels were measured in samples collected 24 h after the last of the treatments (i.e., at the time of sacrifice). Data are presented as mean (± SE). n = 12 in each group. *Significantly different from control (p ≤ 0.05).
Effects of PFOS exposures on ex vivo IL-2, IL-4, IL-10, and IFNγ production
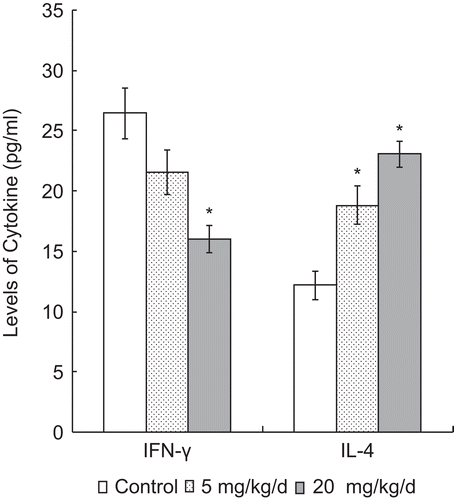
Both IFNγ and IL-4 levels in splenocyte culture supernatants were determined by ELISA. As shown in , with increasing levels of PFOS exposure, there was a significant trend toward decreased IFNγ production. For the 20 mg PFOS/kg/d group, the IFNγ levels were significantly lower than the control group value (16.01 [± 1.08] pg/mL vs. 26.47 [± 2.11] pg/mL, respectively). In the case of IL-4, there was a dose-related trend toward increased synthesis by the cells from hosts that received the 5 and 20 mg PFOS/kg/d regimens (18.83 [± 1.63] and 23.05 [± 1.08] pg/mL, respectively) as compared to the production associated with cells from control animals (i.e., 12.17 [± 1.15] pg/mL).
Figure 3. IFNγ and IL-4 levels in the splenocyte culture supernatant of splenocytes harvested from mice 24 h after the last of their 7 days of treatment, i.e., daily oral exposures to PFOS. Data are presented as mean (± SE) of ELISA results. *Significantly different from respective control (p ≤ 0.05). The data were log transformed as required for statistical analysis. n = 12 in each group.
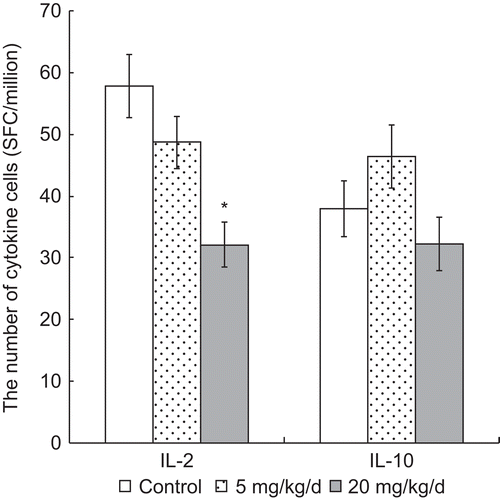
As opposed to measuring the cytokine levels directly as above, to ascertain the effect of PFOS treatments on release of IL-2 and IL-10, ELISPOT assays were performed to measure the quantity of cells secreting the respective proteins (i.e., herein designated as IL-2+ and IL-10+ lymphocytes) (). The results shown indicate that with the 20 mg PFOS/kg/d group, the quantity of IL-2+ secreting cells was markedly lower than that in the control group (32.13 [± 3.57] vs. 57.81 [± 5.08], respectively). In contrast, the quantity of IL-10+ (IL-10-secreting) cells did not significant differ among the various treatment groups (p > 0.05).
Figure 4. Numbers of T-cells secreting IL-2 (IL-2+) and IL-10 (IL-10+) among the splenocytes harvested from mice 24 h after the last of their 7 days of treatment, i.e., daily oral exposures to PFOS. Data are presented as mean (± SE) of ELISPOT results. When significant differences were detected by the F-test (p < 0.05), a Dunnett’s t-test was used to compare treatment groups to the control. *Significantly different from control (p ≤ 0.05). n = 12 in each group.
Effect of PFOS exposures on IgG and IgM production in situ
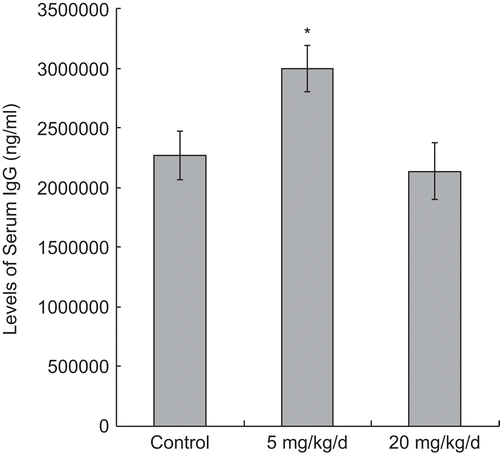
After 7 d of exposures to PFOS, non-specific (total) IgM synthesis (as inferred from levels in the serum) was significantly reduced in all treated groups (in a dose-related manner) in comparison to that in the control mice (all in terms of ng/mL; 5 mg PFOS/kg/d = 27.61 [± 3.43] × 104, 20 mg PFOS/kg/d = 20.58 [± 2.55] × 104, Control = 38.16 [± 3.03] × 104) (). In contrast, the non-specific (total) IgG titers were significantly elevated as a result of the 5 mg PFOS/ kg/d treatment (299.28 [± 19.36] × 104 ng/ mL), unaffected by the 20 mg PFOS/kg/d regimen (213.65 [± 23.44] × 104 ng/ mL) comparing with that in the control group (227.15 [± 20.34] × 104 ng/mL) ().
Figure 5. Serum IgM levels in mice 24 h after the last of their 7 days of treatment, i.e., daily oral exposures to PFOS. Data are presented as mean (± SE) of ELISA results. When significant differences were detected by the F-test (p < 0.05), a Dunnett’s t-test was used to compare treatment groups to the control. *Significantly different from control (p ≤ 0.05). n = 12 in each group.
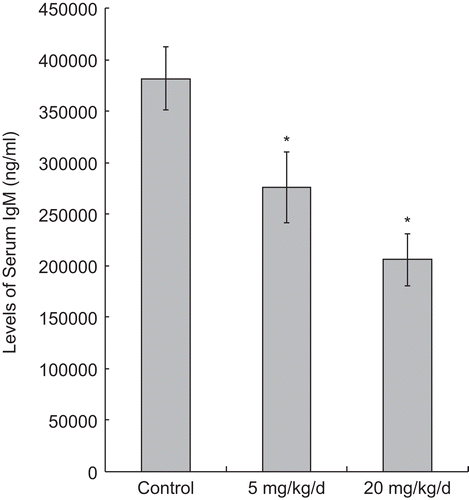
Figure 6. Serum IgG levels in mice 24 h after the last of their 7 days of treatment, i.e., daily oral exposures to PFOS. Data are presented as mean (± SE) of ELISA results. When significant differences were detected by the F-test (p < 0.05), a Dunnett’s t-test was used to compare treatment groups to the control. *Significantly different from control (p ≤ 0.05). n = 12 in each group.
Discussion
PFOS exists widely in the world and sera PFOS levels in many populations have been seen to increase in intensity. The previous studies by our group and by others have shown that the PFOS exposure affects host immune function. This has important implications in that the immune status of a host has a strong connection with disease incidence and outcome. In general, specific immune responses are mediated by activated CD4+ TH cells. Two major subsets of these helper cells (denoted TH1 and TH2) have been defined and characterized by effector functions and distinctive cytokine secretion patterns. The signature cytokines of TH1 and TH2 cells are IFNγ and IL-4, respectively. In this study, we assessed the ex vivo release of TH1- and TH2-type cytokines by isolated splenocytes of exposed adult male C57BL/6 mice to better monitor changes in the hosts’ immune status following high-dose short-term PFOS exposure. We expected these studies would provide experimental data that could subsequently be used for human health risk assessments and related disease analyses.
As an aspect of effector function, cytokine secretion is an important marker of lymphocyte activation. In this study, we chose to assess levels of four cytokines (e.g., IL-2, IL-4, IL-10, and IFNγ) to determine a host’s immune state following PFOS exposure. IL-2 (T-cell growth factor) acts to stimulate growth and differentiation of T-cells, B-cells, and natural killer (NK) cells. IL-10 is considered a negative modulator of immune reactions and has an important role in immunoregulation. IFNγ and IL-4 are signature cytokines of TH1 and TH2 cells, respectively, and their interaction represents an important regulatory mechanism critical to maintaining host immunologic integrity. During the course of any immune response, cytokines that are released by any one of a number of participating immune/non-immune cells can directly or indirectly impact upon a series of events, such as antigen processing/presentation (by macrophages and/or other antigen-presenting cell [APC] types), lymphocyte recognition of antigen, maturation and differentiation of lymphocytes, and (in the case of humoral immunity) antibody production, that ultimately shape what type of response (and the magnitude) is manifest.
Because there is so little information in the literature about the effects of PFOS exposure on cytokines levels associated with (production by) TH1- and TH2-lymphocytes, it is difficult to compare the results of our these studies with those of other investigators. Guruge et al. (Citation2009) studied the effect of a 21-d pre-administration of PFOS exposure on resistance to influenza A infection in B6C3F1 mice. Those studies found that PFOS exposure resulted in a significant increase in mortality in response to the virus. Since TH1 adaptive immunity is an important response against intracellular microbes, and an increase in TH1-type cytokines reflects a vigorous anti-viral host response (Bermejo-Martin et al., Citation2009; Fietta and Delsante, Citation2009), our results in combination with those from Guruge and colleagues allow us to hypothesize that PFOS exposure suppresses TH1-centered immune responses in mice and that this ultimately led the mice to be more vulnerable to influenza A.
Apart from causing changes in anti-microbial responses, PFOS-induced shifts in TH1 (relative to TH2)-based events might also impact on other key immune response in an exposed host. For example, what was noted here in mice after high-dose short-term PFOS exposures, i.e., a shift to a more TH2-type dominant immune state was very similar to changes seen to evolve among TH-cell populations in patients with cancers. Specifically, Berghella et al. (Citation2006) showed that an imbalance develops between TH1 and TH2 cell types in patients with cancer, with a progressive expansion of TH2 cell populations and malfunctioning of any remaining TH1 cells; these results confirmed earlier data showing that cancer patients often manifest a TH2-dominant immune status (Sato et al., Citation1998; Galon et al., Citation2006). With increases in circulating IL-4 expected to accordingly occur as a result of the imbalance among lymphocyte subtypes, there would be even further suppression of TH1-based responses (Fietta and Delsante, Citation2009). This ultimately would lead to a mitigation in the availability of TH1 cell-derived co-stimulator signals critical to the activation of NK and CTL cells essential for recognizing, killing, and removing tumor cells.
It is difficult to state with certitude whether any PFOS-induced changes in an individual’s immune status after repeated PFOS exposure could contribute to an elevated numbers of cancers and/or increases in cancer-related morbidity. Occupational exposure studies have indicated an elevated cancer morbidity associated with PFOS exposure (Gilliland and Mandel, Citation1993; Alexander et al., Citation2003); however, there are still no reports showing a direct relationship between PFOS exposure and the development of cancers in humans. In contrast, a chronic mammalian toxicology study performed by the 3M Company (St. Paul, MN) indicated that PFOS exposures led to an increase in the presence of tumors of the liver, thyroid, and mammary glands (OECD, Citation2002). This could suggest that the shifts in any TH1 vs. TH2 balance induced by PFOS could be facilitating cancer growth in situ—regardless of what the original cancer causative agent might be. Ultimately, to provide a clearer link between our results here and those of the epidemiology studies cited above, it is still necessary to assess both the immune status of PFOS-exposed individuals (with cancer) and their body (specifically, serum) levels of this perfluorinated agent to validate whether there is a relationship between the PFOS exposures and changes in their immune status that could adversely impact upon resistance to cancer.
Although the cytokine patterns assessed here for IL-2, IL-4, and IFNγ reflect an apparent shift in TH1 vs. TH2 balance induced in the mice by high-dose short-term PFOS exposures, the results for IL-10 in these hosts are far less demonstrative of the effect. However, there are several potential reasons to explain this apparently aberrant outcome. For many years, IL-10 (originally isolated from TH2 cells) was considered solely a TH2-type cytokine. However, it is now known that many other cell types produce IL-10, including B-cells, mast cells, eosinophils, macrophages, and DC, as well as many T-cell subtypes, e.g., CD8+ T-cells, Treg cells (forkhead box P3 (FoxP3)+CD4+CD25+ regulatory T-cells), and antigen-driven regulatory CD4+ T-cells (O’Garra and Vieira, Citation2004, Citation2007; Boonstra et al., Citation2006; Mosser and Zhang, Citation2008). IL-10 is a negative immune regulator and inhibits the production of pro-inflammatory cytokines and mediators from macrophages and DC. In this study, although changes in the quantity of IL-10+ (IL-10-secreting) cells after the PFOS treatment(s) were detected, the quantities never significantly differed among the treatment groups (i.e., p > 0.05). Thus, although we are able to assert that PFOS induces immune suppression (as suggested by changes in weights of immune organs and in lymphocyte numbers), our hypothesized mechanism for this effect, i.e., one mediated by TH1 cells, may not be IL-10-dependent.
In this study, changes in normal antibody forming activity in the mice (assessed by measures of serum levels of non-specific [total] IgM and IgG) were also used as markers of any effects on immune status following PFOS exposure. The results here indicate a clear dose-related decrease in serum IgM levels in the mice following daily PFOS exposure for 7 days. In contrast, there was no consistent pattern of effect with respect to IgG, i.e., IgG production (inferred from serum levels) was initially increased (rather than decreased) in mice that received 5 mg PFOS/kg/d. In general, a potential reason for these decrements in IgM (and initial increases in IgG) could be related to the increases in IL-4 production that are expected to occur in situ (in light of the ex vivo data obtained here). As indicated in a classic paper by Spiegelberg (Citation1990), and subsequently verified in numerous studies by other investigators (most recently reviewed in a research paper by Avery et al. [2008]), an increased presence of IL-4 (as well as IL-10, IL-13, IL-21, and TGF-β) can cause increasing levels of isotype switching from IgM to IgG (more specifically IgG1, and ultimately to IgE) in the B-cells of mice. Normally, such conversions are restrained by the presence of IL-2 and/or IFNγ (via cytokine-distinct mechanisms) (Pène et al., Citation1988; Spiegelberg et al., Citation1991; Hasbold et al., Citation1999). Given that the isolated splenocytes here manifest increased production of IL-4 and decreased formation of the IL-2 and IFNγ down-regulators of class switching, the initial differential trends in IgG and IgM levels in the PFOS-exposed mice would not be completely unexpected. Nevertheless, ultimately a toxic threshold was attained in these hosts and IgG formation—like that of IgM—declined as the level of PFOS tested increased.
Although the IL-4-based mechanism could be the potential mechanism for the noted effects on IgG and IgM levels in the PFOS-treated mice, these inter-isotype discrepancies regarding effects of PFOS on antibody secretion parallel the array of differential outcomes reported by others. Peden-Adams et al. (Citation2008) noted that both serum SRBC-specific IgM and trinitrophenyl (TNP)-specific IgM titers were suppressed in PFOS-exposed adult mice (both sexes) after challenge with corresponding T-dependent or -independent [TNP-lipopolysaccharide] antigens. However, Lefebvre et al. (Citation2008) reported a significant trend toward elevated keyhole limpet hemocyanin (KLH)-specific (T-dependent) IgM in the serum of female rats and KLH-specific IgG in the serum of male rats exposed to increasing levels of PFOS. These latter studies also noted no significant changes in KLH-specific IgM and IgG1 titers in the male rats. These discordant results are not apparently isolated to PFOS only. In studies of the effects of PFOA (physicochemically similar to PFOS) on immune functions in female C57BL/6N mice, Dewitt et al. (Citation2008) found that SRBC-specific IgM synthesis was dose-dependently suppressed by PFOA, whereas SRBC-specific IgG titers were increased at lower (and similar to controls at higher) doses of PFOA. In contrast, Yang et al. (Citation2002a) reported that PFOA exposure markedly suppressed the formation of both IgM and IgG antibodies against horse red blood cells.
Apart from any direct effect of a toxicant (like PFOS) on cells of the immune system, an increased level of serum corticosterone (one manifestation of severe environmental and/or physiologic stress) might also lead to immunomodulation in an exposed host. The stress response mediated by the hypothalamic-pituitary-adrenal (HPA) axis is known to suppress immunoglobulin production and to impair immune function (Lall and Dan, Citation1999; Shakhar and Blumenfeld, Citation2003; Reichlin, Citation2004). In the study here, PFOS (at 20 mg PFOS/kg/d) significantly increased corticosterone levels in the serum of the exposed mice. Results from Austin et al. (Citation2003) also indicated a significant increase in corticosterone and norepinephrine levels in the paraventricular nucleus of rats exposed to 10 mg PFOS/kg/d for 2 week. In conjunction with our data, this indicated that PFOS has a stimulatory effect on the stress axis. As such, the effects of PFOS on immune function overall may be partly (and quite probably) mediated through the HPA axis. Based upon the results of the current study, it will be valuable to employ lower doses in future studies, as a dose of 20 mg/kg/d appeared to be overtly toxic/stressful. Interestingly, our study also showed that even among mice treated with 5 mg PFOS/kg/d, whereas body weight or serum corticosterone levels were not markedly different from control values, IL-4 and serum IgM/IgG levels were still impacted.
It is possible that PFOS skews cytokine production in favor of TH2 cytokines because, as we noted above, others have reported an increase in IgG after PFOS (Lefebvre et al., Citation2008) or PFOA (Dewitt et al., Citation2008) exposure in animals immunized with a novel antigen. Although the precise cause of such an increase in IgG synthesis is unknown, Dewitt et al. (Citation2008) suggested this may have been due to a rebound of immune function (which has been observed following a period of immunosuppression) rather than a shift in cytokine production per se. Unfortunately, as noted previously, total Ig concentrations do not have the universal predictive power that actual responses to a novel antigen may have and, thus, one should interpret such data with caution. In fact, a convincing argument could be made that PFAA-induced shifts in cytokine production in general do not necessarily correlate with actual alteration in more involved immune functions. For example, in the respective studies by the Lefebvre and DeWitt groups, neither PFOS nor PFOA exposure suppressed the DTH response at doses (at least for Dewitt et al. albeit over a longer dosing period [i.e., 15–30 d]) similar to those used in the current study. That is not what one might reasonably expect to occur if skewing to TH2-type responses (and the corresponding increases in Ig formation) was the mode of action. However, in those same studies, the effects of the fluorinated agents did not enhance the DTH responses either (as, logically, might be expected had the response become skewed toward TH1 cells). Unfortunately, in neither study were analyses of TH1 vs. TH2 populations performed; thus, the ability to link changes in Ig status to those in altered DTH and each, in turn, to shifts in TH1 vs. TH2 status as a result of exposures to the fluorinated agents remains to be more precisely defined. Nevertheless, based on the results here, when taken in their totality, we conclude that high-dose short-term PFOS exposure caused a shift in host immune status to one reflecting cellular response suppression and a likely humoral response enhancement.
In conclusion, it is clear that daily PFOS exposures over a 7-d period can induce immunomodulatory effects. However, for the highest dose employed in this study, i.e., 20 mg PFOS/ kg/d, we are mindful that there was a significant change in host body weights. Clearly, such overt toxicity (i.e., ≈ > 10% loss in weight) confounds data interpretation. Accordingly, it cannot be determined with certainty that the immune effects observed at this dose were a priori due to the PFOS exposure (direct and/or indirect effects) itself or, instead, due to overt toxicity (indirect effects due to moribund conditions in host) OR a combination of the two. It is for this reason that we stipulate above that to reaffirm our findings and confirm our results, lower doses must be employed in future studies. However, as many of the significant changes noted occurred at 5 mg PFOS/kg/d, the “problem” with the 20 mg dose does not ultimately negate our main conclusion, i.e., daily PFOS exposures over a 7-d period can induce immunomodulatory effects.
Acknowledgments
This research was supported by grants from the National Natural Science Foundation of China (20707041), the Liaoning Province Science and Technology Foundation (2009225010-6), and the Liaoning Province Education Department Foundation (L2010706).
Declaration of interest
The authors report no conflicts of interest. The authors are alone responsible for the content and writing of the paper.
References
- Alexander, B. H., Olsen, G. W., Burris, J. M., Mandel, J. H. and Mandel, J. S. 2003. Mortality of employees of a perfluorooctanesulphonyl fluoride manufacturing facility. Occup. Environ. Med. 60:722–729.
- Austin, M. E., Kasturi, B. S., Barber, M., Kannan, K., MohanKumar, P. S. and MohanKumar, S. M. 2003. Neuroendocrine effects of perfluorooctane sulfonate in rats. Environ. Health Perspect. 111:1485–1489.
- Berghella, A. M., Contasta, I., Pellegrini, P., Del Beato, T. and Adorno, D. 2006. Are immunological mechanisms involved in colon cancer and are they possible markers for biotherapy improvement? Cancer Biother. Radiopharm. 21:468–487.
- Bermejo-Martin, J. F., Ortiz de Lejarazu, R., Pumarola, T., Rello, J., Almansa, R., Ramírez, P., Martin-Loeches, I., Varillas, D., Gallegos, M. C., Serón, C., Micheloud, D., Gomez, J. M., Tenorio-Abreu, A., Ramos, M. J., Molina, M. L., Huidobro, S., Sanchez, E., Gordón, M., Fernández, V., Del Castillo, A., Marcos, M. A., Villanueva, B., López, C. J., Rodríguez-Domínguez, M., Galan, J. C., Cantón, R., Lietor, A., Rojo, S., Eiros, J. M., Hinojosa, C., Gonzalez, I., Torner, N., Banner, D., Leon, A., Cuesta, P., Rowe, T. and Kelvin, D. J. 2009. Th1 and Th17 hypercytokinemia as early host response signature in severe pandemic influenza. Crit. Care. 13:R201.
- Boonstra, A., Rajsbaum, R., Holman, M., Marques, R., Asselin-Paturel, C., Pereira, J. P., Bates, E. E., Akira, S., Vieira, P., Liu, Y. J., Trinchieri, G. and O’Garra, A. 2006. Macrophages and myeloid dendritic cells, but not plasmacytoid dendritic cells, produce IL-10 in response to MyD88- and TRIF-dependent TLR signals, and TLR-independent signals. J. Immunol. 177:7551–7558.
- Burris, J. M., Lundberg, J. K., Olsen, G. W., Simpson, C., and Mandel, J. H. 2002. Determination of Serum Half-lives of Several Fluorochemicals. Interim Report #2. St. Paul, MN:3M Company. U.S. EPA docket AR-226-1086. Washington, DC: U.S. Environmental Protection Agency.
- Butenhoff, J. L., Olsen, G. W. and Pfahles-Hutchens, A. 2006. The applicability of biomonitoring data for perfluorooctanesulfonate to the environmental public health continuum. Environ. Health Perspect. 114:1776–1782.
- Calafat, A. M., Kuklenyik, Z., Reidy, J. A., Caudill, S. P., Tully, J. S. and Needham, L. L. 2007. Serum concentrations of 11 polyfluoroalkyl compounds in the u.s. population: Data from the national health and nutrition examination survey (NHANES). Environ. Sci. Technol. 41:2237–2242.
- de Vos, M. G., Huijbregts, M. A., van den Heuvel-Greve, M. J., Vethaak, A. D., Van de Vijver, K. I., Leonards, P. E., van Leeuwen, S. P., de Voogt, P. and Hendriks, A. J. 2008. Accumulation of perfluorooctane sulfonate (PFOS) in the food chain of the Western Scheldt estuary: Comparing field measurements with kinetic modeling. Chemosphere 70:1766–1773.
- Dewitt, J. C., Copeland, C. B., Strynar, M. J. and Luebke, R. W. 2008. Perfluorooctanoic acid-induced immunomodulation in adult C57BL/6J or C57BL/6N female mice. Environ. Health Perspect. 116:644–650.
- Dong, G. H., Zhang, Y. H., Zheng, L., Liu, W., Jin, Y. H. and He, Q. C. 2009. Chronic effects of perfluorooctanesulfonate exposure on immunotoxicity in adult male C57BL/6 mice. Arch. Toxicol. 83:805–815.
- Fietta, P. and Delsante, G. 2009. The effector T-helper cell triade. Riv. Biol. 102:61–74.
- Francis, J., MohanKumar, S. M. and MohanKumar, P. S. 2000. Correlations of norepinephrine release in the paraventricular nucleus with plasma corticosterone and leptin after systemic lipopolysaccharide: Blockade by soluble IL-1 receptor. Brain Res. 867:180–187.
- Galon, J., Costes, A., Sanchez-Cabo, F., Kirilovsky, A., Mlecnik, B., Lagorce-Pagès, C., Tosolini, M., Camus, M., Berger, A., Wind, P., Zinzindohoué, F., Bruneval, P., Cugnenc, P. H., Trajanoski, Z., Fridman, W. H. and Pagès, F. 2006. Type, density, and location of immune cells within human colorectal tumors predict clinical outcome. Science 313:1960–1964.
- Giesy, J. P. and Kannan, K. 2001. Global distribution of perfluorooctane sulfonate in wildlife. Environ. Sci. Technol. 35:1339–1342.
- Gilliland, F. D. and Mandel, J. S. 1993. Mortality among employees of a perfluorooctanoic acid production plant. J. Occup. Med. 35:950–954.
- Guruge, K. S., Hikono, H., Shimada, N., Murakami, K., Hasegawa, J., Yeung, L. W., Yamanaka, N. and Yamashita, N. 2009. Effect of perfluorooctane sulfonate (PFOS) on influenza A virus-induced mortality in female B6C3F1 mice. J. Toxicol. Sci. 34:687–691.
- Hansen, K. J., Clemen, L. A., Ellefson, M. E. and Johnson, H. O. 2001. Compound-specific, quantitative characterization of organic fluorochemicals in biological matrices. Environ. Sci. Technol. 35:766–770.
- Hasbold, J., Hong, J. S., Kehry, M. R. and Hodgkin, P. D. 1999. Integrating signals from IFN-γ and IL-4 by B-cells: Positive and negative effects on CD40 ligand-induced proliferation, survival, and division-linked isotype switching to IgG1, IgE, and IgG2a. J. Immunol. 163:4175–4181.
- Houde, M., Bujas, T. A., Small, J., Wells, R. S., Fair, P. A., Bossart, G. D., Solomon, K. R. and Muir, D. C. 2006. Biomagnification of perfluoroalkyl compounds in the bottlenose dolphin (Tursiops truncatus) food web. Environ. Sci. Technol. 40:4138–4144.
- Jin, Y., Saito, N., Harada, K. H., Inoue, K. and Koizumi, A. 2007. Historical trends in human serum levels of perfluorooctanoate and perfluorooctane sulfonate in Shenyang, China. Tohoku J. Exp. Med. 212:63–70.
- Kulmatycki, K. M. and Jamali, F. 2001. Therapeutic relevance of altered cytokine expression. Cytokine 14:1–10.
- Lall, S. B. and Dan, G. 1999. Role of corticosteroids in cadmium induced immunotoxicity. Drug Chem. Toxicol. 22:401–409.
- Lefebvre, D. E., Curran, I., Armstrong, C., Coady, L., Parenteau, M., Liston, V., Barker, M., Aziz, S., Rutherford, K., Bellon-Gagnon, P., Shenton, J., Mehta, R. and Bondy, G. 2008. Immunomodulatory effects of dietary potassium perfluorooctane sulfonate (PFOS) exposure in adult Sprague-Dawley rats. J. Toxicol. Environ. Health Part A 71:1516–1525.
- Mosser, D. M. and Zhang, X. 2008. Interleukin-10: New perspectives on an old cytokine. Immunol. Rev. 226:205–218.
- O’Garra, A. and Vieira, P. 2004. Regulatory T-cells and mechanisms of immune system control. Nat. Med. 10:801–805.
- O’Garra, A. and Vieira, P. 2007. TH1 cells control themselves by producing interleukin-10. Nat. Rev. Immunol. 7:425–428.
- OECD (Organization for Economic Co-operation and Development). 2002. Hazard Assessment of Perfluorooctane Sulfonate (PFOS) and Its Salts. Available at http://www.oecd.org/dataoecd/23/18/2382880.pdf.
- Peden-Adams, M. M., Keller, J. M., Eudaly, J. G., Berger, J., Gilkeson, G. S. and Keil, D. E. 2008. Suppression of humoral immunity in mice following exposure to perfluorooctane sulfonate. Toxicol. Sci. 104:144–154.
- Pène, J., Rousset, F., Brière, F., Chrétien, I., Bonnefoy, J. Y., Spits, H., Yokota, T., Arai, N., Arai, K. and Banchereau, J. 1988. IgE production by normal human lymphocytes is induced by interleukin 4 and suppressed by interferons gamma and alpha and prostaglandin E2. Proc. Natl. Acad. Sci. USA 85:6880–6884.
- Qazi, M. R., Bogdanska, J., Butenhoff, J. L., Nelson, B. D., DePierre, J. W. and Abedi-Valugerdi, M. 2009a. High-dose, short-term exposure of mice to perfluorooctanesulfonate (PFOS) or perfluorooctanoate (PFOA) affects the number of circulating neutrophils differently, but enhances the inflammatory responses of macrophages to lipopolysaccharide (LPS) in a similar fashion. Toxicology 262:207–214.
- Qazi, M. R., Xia, Z., Bogdanska, J., Chang, S. C., Ehresman, D. J., Butenhoff, J. L., Nelson, B. D., DePierre, J. W. and Abedi-Valugerdi, M. 2009b. The atrophy and changes in the cellular compositions of the thymus and spleen observed in mice subjected to short-term exposure to perfluorooctanesulfonate are high-dose phenomena mediated in part by peroxisome proliferator-activated receptor-α (PPARα). Toxicology 260:68–76.
- Reichlin, S. 2004. Neuroendocrinology of acute immunity. J. Endocrinol. Invest. 27:48–61.
- Sato, M., Goto, S., Kaneko, R., Ito, M., Sato, S. and Takeuchi, S. 1998. Impaired production of TH1 cytokines and increased frequency of TH2 subsets in PBMC from advanced cancer patients. Anticancer Res. 18:3951–3955.
- Seacat, A. M., Thomford, P. J., Hansen, K. J., Clemen, L. A., Eldridge, S. R., Elcombe, C. R. and Butenhoff, J. L. 2003. Sub-chronic dietary toxicity of potassium perfluorooctanesulfonate in rats. Toxicology 183:117–131.
- Shakhar, G. and Blumenfeld, B. 2003. Glucocorticoid involvement in suppression of NK activity following surgery in rats. J. Neuroimmunol. 138:83–91.
- Spiegelberg, H. L. 1990. The role of interleukin-4 in IgE and IgG subclass formation. Springer Semin. Immunopathol. 12:365–383.
- Spiegelberg, H. L., Falkoff, R. J., O’Connor, R. D. and Beck, L. 1991. Interleukin-2 inhibits the interleukin-4-induced human IgE and IgG4 secretion in vivo. Clin. Exp. Immunol. 84:400–405.
- Yang, Q., Abedi-Valugerdi, M., Xie, Y., Zhao, X. Y., Möller, G., Nelson, B. D. and DePierre, J. W. 2002a. Potent suppression of the adaptive immune response in mice upon dietary exposure to the potent peroxisome proliferator, perfluorooctanoic acid. Int. Immunopharmacol. 2:389–397.
- Yang, Q., Xie, Y. and Depierre, J. W. 2000. Effects of peroxisome proliferators on the thymus and spleen of mice. Clin. Exp. Immunol. 122:219–226.
- Yang, Q., Xie, Y., Alexson, S. E., Nelson, B. D. and DePierre, J. W. 2002b. Involvement of the peroxisome proliferator-activated receptor-α in the immunomodulation caused by peroxisome proliferators in mice. Biochem. Pharmacol. 63:1893–1900.
- Yang, Q., Xie, Y., Eriksson, A. M., Nelson, B. D. and DePierre, J. W. 2001. Further evidence for the involvement of inhibition of cell proliferation and development in thymic and splenic atrophy induced by the peroxisome proliferator perfluoroctanoic acid in mice. Biochem. Pharmacol. 62:1133–1140.
- Zheng, L., Dong, G. H., Jin, Y. H. and He, Q. C. 2009. Immunotoxic changes associated with a 7-day oral exposure to perfluorooctanesulfonate (PFOS) in adult male C57BL/6 mice. Arch. Toxicol. 83:679–689.