Abstract
The current study investigated the effects of 14-day pioglitazone (PIO) and/or simvastatin (SIM) treatments on serum adiponectin (Adp) and TNFα levels (markers of adipocyte dysfunction), as well as on metabolic perturbations that arise from prolonged (8 week) consumption of a high fructose (HFD; 60%) diet in a rat model of pre-diabetic insulin resistance. The HFD induced a deranged lipid profile that was associated with adipose tissue hypertrophy, increased ratios of visceral and epididymal fats to body weight, and fatty liver. These perturbations were associated with hypo-adiponectinemia (50.8%) and increased serum TNFα (6.5-fold) levels. Treatment with PIO ameliorated the altered blood and hepatic glucose metabolism via an Adp-dependent mechanism; PIO also mitigated the changes in blood TNFα and led to a hyperelevation of Adp levels. SIM amended hepatic and overall lipid metabolism, regulated TNFα, but failed to alter the glucose intolerance or significantly impact on the HFD-altered Adp levels. Coadministration of SIM + PIO was superior in improving overall metabolic parameters compared to each monotherapy. Cotreatment was optimal in reestablishing insulin resistance, most efficacious in improving serum lipid profiles, normalizing percentage ratios of epididymal and visceral fats to body weight, and augmenting Adp/reducing TNFα levels relative to that in the HFD group or with HFD + each drug alone. The results here show that use of either monotherapy or a combined SIM + PIO approach might, from a clinical perspective, provide an ability to delay progression to Type 2 diabetes and its associated inflammatory/cardiovascular effects.
| Abbreviations | ||
| Adp, | = | adiponectin |
| AUC, | = | area under the curve |
| FFA, | = | free fatty acids |
| HbA1c, | = | glycated hemoglobin |
| HDL-C, | = | high density lipoprotein cholesterol |
| HFD, | = | high fructose-diet |
| HMG-CoA reductase, | = | 3-hydroxy-3-methyl-glutaryl-CoA reductase |
| HOMA-IR index, | = | homeostasis model assessment for insulin resistance |
| IPGTT, | = | intra-peritoneal glucose tolerance test |
| IR, | = | insulin resistance |
| LDL-C, | = | low density lipoprotein cholesterol |
| LPL, | = | lipoprotein lipase enzyme |
| PIO, | = | pioglitazone |
| PPARγ, | = | peroxisome proliferator-activated receptor-γ |
| SIM, | = | simvastatin |
| T-Chol, | = | total cholesterol |
| TGs, | = | triglycerides |
| TNFα, | = | tumor necrosis factor-α |
| TZD, | = | thiazolidinediones |
Introduction
Epidemiological and biochemical studies strongly indicate that consumption of a high fructose diet (HFD) contributes to increased prevalence of the modern epidemic of obesity and insulin resistance, the basis for metabolic syndrome (MS) (Astrup and Finer, Citation2000) that confers an increased risk for diabetes and cardiovascular (CV) diseases. MS is frequently associated with a myriad of pathologies including low-grade inflammation, hyper-triglyceridemia, impaired glucose tolerance, insulin resistance, and cardiovascular complications (Astrup and Finer, Citation2000). The consumption of high fructose diets leads to rapid stimulation of lipogenesis and triglyceride (TG) accumulation in adipocytes, resulting in glucose tolerance and insulin resistance (Moore et al., Citation2000). To better understand mechanisms underlying insulin resistance, relationships between adipocyte dysfunction and metabolic disturbances and inflammation have received scrutiny.
The recognition of the central role of adipose tissue in controlling glucose and lipid metabolism has led to a change of the classical perception of adipose tissue as a storage place of fatty acids to one of adipocytes as secretors of bioactive adipocytokines (Hajer et al., Citation2008). These agents mediate metabolic/inflammatory processes that link obesity/MS with CV complications. Thus, adipocyte dysfunction can be seen as a process leading to pro-inflammatory changes and alterations in ‘endocrine’ function (Westerink and Visseren, Citation2011). There have been studies that showed that altered adipocyte function is associated with up-regulated expression of tumor necrosis factor-α (TNFα), interleukin (IL)-6, and resistin, as well as a down-regulation of adiponectin (Adp) expression (Greenberg and Obin, Citation2006). TNFα (often over-expressed in obesity) is a key modulator of adipocyte function and contributes to insulin resistance (Guilherme et al., Citation2008). Specifically, pro-inflammatory TNFα exerts a direct inhibitory effect on insulin signaling cascades, decreases lipogenesis, and increases lipolysis (thereby augmenting free fatty acid [FFA] levels; Guilherme et al., Citation2008). Elevated levels of FFA, in turn, act to reduce insulin sensitivity and increase gluconeogenesis, further enhancing insulin resistance and creating an environment of hyperglycemia and hyperinsulinemia in adipocytes (Lumeng et al., Citation2007).
As it is solely produced by adipocytes, a low plasma Adp level is a good marker of adipocyte dysfunction in insulin resistance (Esteve et al., Citation2009). It has been suggested that Adp might function as an adipostat with insulin-sensitizing and anti-inflammatory activity. Thus, therapeutic strategies aimed at correcting adipocyte dysfunction by increasing plasma Adp and decreasing TNFα levels could potentially be beneficial in preventing complications from pre-diabetic MS.
Thiazolidinediones (TZD), including pioglitazone (PIO), ameliorate insulin resistance by binding to and activating PPARγ (peroxisome proliferator-activated receptor-γ) in adipose tissues (Yki-Jarvinen, Citation2004). This promotes adipose differentiation and increases the numbers of small adipocytes that are more sensitive to insulin; this leads to improved insulin sensitivity in adipose tissue, as well as in the liver and vascular endothelium (Balfour and Plosker, Citation1999). As an agonist of both PPARγ and PPARα, PIO can lower serum triglyceride (TG) and FFA levels (Malinowski and Bolesta, Citation2000; Miyazaki et al., Citation2002, Citation2004) and decrease a plethora of enzymes implicated in FFA and cholesterol synthesis (Bogacka et al., Citation2004, Citation2005; Teruel et al., Citation2005). Statins (competitive inhibitors of HMG-CoA reductase) possess anti-inflammatory and -oxidant effects (Jain and Ridker, Citation2005), and help to reduce circulating LDL-C (Schaefer et al., Citation1999; Khan et al., Citation2009). To date, there is little consensus about the effects of statins on adipocytes, even though adipose tissue is considered a good candidate tissue to explore statin action (Khan et al., Citation2009). As a potent statin, simvastatin is a model drug to investigate the relationship between insulin-sensitizing and the anti-atherogenic effects of this class of drugs, as well as their potential role in inducing changes in the formation/release of two key adipocytokines, Adp and TNFα.
The aim of the studies reported here was to evaluate and compare the efficacy of SIM and/or PIO in rectifying the disturbed metabolic events—and their association with abnormal levels of Adp and TNFα adipocytokines in rats maintained on an HFD that would yield a pathophysiologic state analogous to that of pre-diabetic insulin resistance. Since the complex cluster of insulin resistance and dyslipidemia in MS might not be affected with a single statin or TZD alone, whether the combined effect of these drugs might be more effective than either agent alone in affecting changes to the overall risk profile in these hosts, was also evaluated.
Materials and methods
Animals
Adult male Wistar rats weighing 100–140 g (National Research Center Laboratory, Cairo, Egypt) were maintained in an accredited animal facility with a 12-h light/dark cycle, and constant environmental conditions (20–25°C, 30–60% relative humidity). Rats were provided standard rat chow and water ad libitum, prior to the dietary manipulation. The Research Ethical Committee of the Faculty of Pharmacy (Cairo University) approved all experimental protocols used here.
Development of high fructose diet (HFD)-fed insulin resistant pre-diabetic rats
Rats were divided into five groups. Group I rats were fed standard chow and served as ‘normal controls’ (n = 10). For the treatment regimens, 40 rats were fed a fructose-rich chow (60% fructose, 5% fat, 8% cellulose, 20% protein, 2% fiber, and 5% vitamins/minerals) for 8 weeks (Thorburn et al., Citation1989). Rats were monitored weekly for body weight, as well as fasting levels of serum glucose, TG, total cholesterol (T-Chol), and insulin. Only rats with displayed blood glucose levels > 150–200 hyper-insulinemia, and -cholesterolemia for 7 days were considered resistant diabetic and so were used in the study.
Following confirmation of insulin resistance (IR) using an intra-peritoneal glucose tolerance test (IPGTT), a homeostasis model assessment of insulin resistance (HOMA-Insulin Resistance index; HIRI), and generation of a dyslipidemic profile, these rats were then subdivided into four groups (10 rats each): Group II: HFD control; Group III: HFD + Pioglitazone (PIO, 10 mg/kg; Alexis, San Diego, CA) (Lee et al., Citation2007); Group IV: HFD + simvastatin SIM (SIM, 20 mg/kg; Calbiochem, San Diego, CA) (Mital et al., Citation2000); and Group V: HFD + a combination of PIO/SIM. These latter groups were dosed per osfor 2 weeks after the 8-week HFD feeding was complete; for the dosing period, all rats in Groups II–V were still maintained on the HFD (± the test drug[s]). The last dose of any treatment was given 24 h before sacrifice (via cervical dislocation); rats were fasted 18 h prior to euthanizing to minimize feeding-induced variations in all measured parameters.
IPGTT
Ten rats from each group were subjected to the IPGTT. Fasting rats were given glucose (2 g/kg, intraperitoneal injection) and droplets of tail vein blood were drawn every 30 min (up to 120 min) to evaluate resulting glucose concentrations via an automated glucometer (One Touch-Horizon, Johnson & Johnson (Life Scan) blood glucose monitoring system, Almere, the Netherlands) (Horio et al., Citation2005). The area under the curve (AUC) was calculated for blood glucose (BG) according to the equation: AUC = {0.5 × [BG0+BG30]/2} + {0.5 × [BG30+ BG60]/2} + [BG60+ BG120]/2 (Psyrogiannis et al., Citation2003).
Collection of samples for analysis
At necropsy, rats were weighed and blood was collected from the tail vein. One quarter of the isolated blood was transferred to an EDTA-vacutainer tube and mixed thoroughly for use in measures of glycated hemoglobin (HbA1c) levels, the remainder was centrifuged (800 × g, 4°C, 20 min) for serum separation. Isolated sera was used for assessment of glucose, insulin, TG, T-Chol, high-density lipoprotein-cholesterol (HDL-C) FFA, Adp, and TNFα, as well as for alanine transaminase (ALT) activity. After blood collection, each rat’s liver, as well as visceral (VF) and epididymal (EF) fats, were carefully excised and weighed.
Commercial kits were used to assess each serum parameter. A radioimmunoassay (RIA) was used to determine insulin (Bennett, Citation1983; Berntorp et al., Citation1983) and Adp (Gonzalez-Sanchez et al., Citation2005) levels; TNFα was assessed via ELISA method (R&D Systems, Minneapolis, MN). HIRI was calculated as in Matthews et al. (Citation1985). Liver TG and T-Chol was determined after lipid extraction, according to the method of Bligh and Dyer (1959).
Statistical analysis
All data were expressed as mean ± SD. Data comparisons were performed using a one-way analysis of variance (ANOVA) followed by a Tukey-Kramer Multiple Comparisons Test. All analyses utilized SPSS 16.0 statistical package for Windows (SPSS Inc., Chicago, IL). A p-value < 0.05 was accepted as statistically significant. Correlation coefficients (r) for TNFα and adiponectin with FFA, HIRI, hepatic TG, and/or visceral fat were estimated for treated and untreated rats using linear regression analysis. Statistical significance was taken at p < 0.01.
Results
Effect of HFD on metabolic parameters, TNFα, and Adp
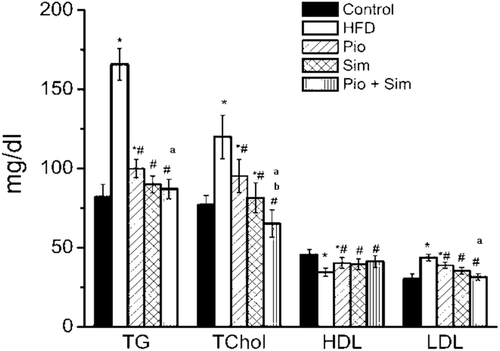
Consumption of HFD for 8 weeks induced a time-dependent escalation in insulin resistance (IR), as manifested by 1.3–3.7-fold significant increases in body weight (BW) as well as in serum levels of glucose, HbA1c, insulin HIRI (3.7-fold) and FFA ( and ). IPGTT and AUC for glucose tolerance were also significantly amplified ( and ). Lipid profiles reflected significant dyslipidemia characterized by an upsurge in levels of TG (2.00-fold), T-Chol (1.50-fold), LDL-C (42%), ALT (2.50-fold), and FFA (1.86-fold), and a significant decrease in HDL-C (24%) ( and ).
Table 1. Time-dependent changes in body weight, glucose, insulin, and TG and TC in rats during 8 weeks of normal (NC) and high fructose diets (HFD).
Table 2. Effect of 14-day oral PIO (10 mg/kg) and/or SIM (20 mg/kg) on serum glucose, insulin, HIRI, HbA1c, free fatty acid (FFA), and ALT.
Figure 1. (a) Glucose tolerance curve of normal and insulin resistant rats after initial 8 weeks on the HFD alone and then 14 days on the indicated treatment drug (in conjunction with maintenance of HFD). (b) Changes in the area under the curve (AUC) as derived from the glucose tolerance test for normal control, non-drug-treated HFD, and drug-treated HFD rats. Values shown are mean ± SD (n = 10 rats/group).*,# Value significantly different compared with normal control and HFD control, respectively, at p < 0.05.*,# a,b Value significantly different compared with PIO or SIM group, respectively, at p< 0.05.a,b Values shown are mean ± SD (n = 10 rats per each group).
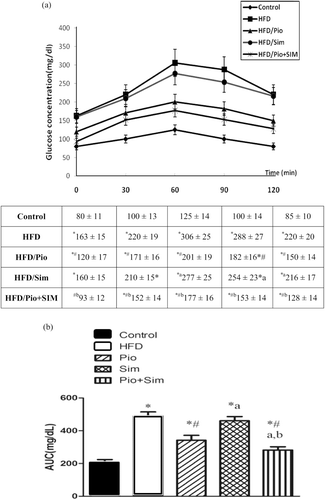
Figure 2. Effect of 14-day oral PIO (10 mg/kg) and/or SIM (20 mg/kg) on serum triglyceride (TG), total cholesterol (T-Chol), LDL (LDL-C), and HDL. All rats were provided normal chow or HFD for 8 weeks prior to 14 days on the indicated treatment drug (in conjunction with maintenance of HFD). Values shown are mean ± SD (n = 10 rats/group).*,# Value significantly different compared with normal control and HFD, respectively, at p < 0.05.a,bValue significantly different compared with PIO or SIM group, respectively, at p< 0.05.
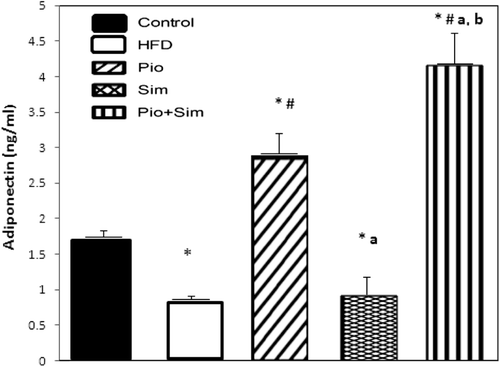
The HFD also induced a 6.5-fold significant elevation in serum TNFα () as well as a significant decrease in Adp levels (50.8%) (). The HFD also led to a significant elevation in ratios of epididymal fat (2.00-fold), visceral fat (1.50-fold), and liver weight (1.40-fold) (each to BW), in addition to a significant increase in liver TG (5.00-fold) levels () upon IR induction.
Table 3. Effect of 14-day oral PIO (10 mg/kg) and/or SIM (20 mg/kg) on hepatic TG content and of epididymal fat:, visceral fat:, and liver weight:BW ratios.
Figure 3. Effect of 14-day oral PIO (10 mg/kg) and/or SIM (20 mg/kg) on serum TNFα. All rats were provided normal chow or HFD for 8 weeks prior to 14 days on the indicated treatment drug (in conjunction with maintenance of HFD). Values shown are mean ± SD (n = 10 rats/group). Value significantly different compared with normal control and HFD, respectively, at p < 0.05. *,# a, bValue significantly different compared with PIO or SIM group, respectively, at p < 0.05.
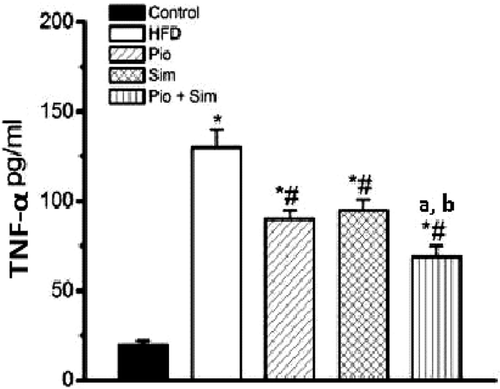
Figure 4. Effect of oral PIO (10 mg/kg) and/or SIM (20 mg/kg) on serum Adp. All rats were provided normal chow or HFD for 8 weeks prior to 14 days on the indicated treatment drug (in conjunction with maintenance of HFD). Values shown are mean ± SD (n = 10 rats/group). *,# Value significantly different compared with normal control and HFD, respectively, at p < 0.05. Value significantly different compared with PIO or SIM group, respectively, at p < 0.05.a, b Value significantly different compared with PIO or SIM group, respectively, at p < 0.05.
Role of PIO and/or SIM in ameliorating HFD-altered metabolic parameters
PIO administration rectified the HFD-induced changes in glucose metabolism and lipid profile, whereas SIM demonstrated activity in amending the lipid profile moreso than the glucose metabolic parameters (, ). PIO improved both glucose and lipid metabolism; it caused a significant decline in serum glucose (26.8%), insulin (29.2%), AUC (37.3%), HbA1c (22.6%), FFA (17.9%), and ALT (27.7%) (), as well as significant decreases in TG (39.7%), T-Chol (20.5%), and LDL-C (9.7%) and an increase in HDL-C (16.9%) (all values relative to HFD-only hosts; ). Moreover, PIO induced a significant decline in the liver TG (23.9%), as well as a normalization of the epididymal fat:, visceral fat:, and liver weight:BW ratios ().
Although SIM failed to affect insulin sensitivity (i.e., no significant impact on HFD-induced levels of glucose or insulin), it led to a readjustment of the HFD-induced dyslipidemia, i.e., reductions in serum TG (45.7%), T-Chol (32%), LDL-C (17.9%), FFA (25.3%), and ALT (24.2%) (all values relative to HFD-only hosts; and ) on par with that by PIO; the effect on HbA1c (14.3%) and on HDL-C (14.6%) was slightly less than that by PIO. A relatively greater reduction in liver TG content (40.4%) and normalization of the previously increased percentage ratios of epididymal: and visceral fat: BW ratios () were additional advantages of the SIM treatment. Only with respect to the impact on liver weight:BW ratios were the two drugs not different.
SIM + PIO co-administration was superior in improving the overall metabolic parameters compared to the individual monotherapies. The co-treatment resulted in a significant reduction in serum glucose (43.5%), insulin (42%), and HbA1c (42.8%), and normalized the HIRI (all values relative to HFD-only hosts; ). The combination was also more efficacious in repairing the serum lipid profile (presented as significant reductions in TG, T-Chol, and LDL-C, as well as increases in HDL-C (19.5%) () and decreases in FFA (37.3%) and liver TG (44.19%) ()). The normalization of the HFD-increased liver TG levels and, in the ratios of visceral fat, and liver weight to body weight were on par with those induced by SIM, but significantly greater than that by SIM or PIM for the measures of epididymal fat:BW ratio.
Impact of PIO and/or SIM on HFD-altered TNFα and Adp levels
PIO and SIM alone each induced significant decreases in serum TNFα (30.7%, 26.9%, respectively) compared with the control HFD group ( and ); their combination caused an even greater reduction (46.9%). In regard to Adp, PIO increased levels 3.4-fold, while SIM failed to alter the HFD-reduced level. Interestingly, the combination of SIM + PIO boosted Adp 4.88-fold as compared to the HFD group. With both TNFα and Adp, the effect of the combined therapies was significantly greater than from either drug alone.
Correlations between serum adipocytokine levels (Adp, TNFα) and HIRI and FFA, hepatic TG ratio, and visceral fat ratio were also determined (). The analyses revealed a significant positive correlation outline between HIRI and the FFA, TG content /liver and visceral fat/BW parameters (r = 0.905, r = 0.787, and r = 0.708, respectively; all p < 0.01). Significant positive correlations were detected between TNFα and FFA (r = +0.905), HIRI (r = +0.872), liver TG content (r = +0.95), and visceral fat ratio (r= +0.564) (all p < 0.001). In contrast, significant negative correlations were shown between Adp levels and FFA (r = –0.454), HIRI (r = –0.689), and visceral fat ratio (r = –0.590); however, correlations were insignificant with TNFα (–0.312) and liver TG content (r = –0.164). All correlations were carried out in treated and untreated HFD animals using linear regression analysis.
Table 4. Correlation coefficient (r) for TNFα and Adp (as well as HIRI) with FFA, HIRI, hepatic TG, and visceral fat.
Discussion
The current study showed that, although SIM alone corrected the HFD-induced changes in lipid profile (but neither the effect on glucose homeostasis nor Adp), it potentiated the effects of PIO on these (and other) end-points. This effect was most notable with respect to the PIO-mediated effect on hypoglycemia, insulin sensitizing, and adipocytokine levels. This finding of a SIM potentiating effect on PIO is the most critical finding of the many made in this study.
High fructose diet (HFD) is known to perturb glucose tolerance, insulin sensitivity, and lipid profiles (Kannappan and Anuradha, Citation2009; Yadav et al., Citation2009), hence, inducing an insulin resistance-like syndrome. Concomitant with the reported insulin resistance and prominent dyslipidemia in the current study, the HFD resulted in elevation in epididymal and visceral fat weights due to direct delivery of portal blood from the visceral fat to the liver, and consequent excessive release of free fatty acids (FFA; Stanhope and Havel, Citation2008) into the blood. The FFA, in turn, induce insulin resistance as evidenced here and elsewhere (Hajer et al., Citation2008) as they alter insulin signaling, diminish glucose uptake, and induce gluconeogenesis in the liver.
Apart from increases in release of FFA, the HFD also resulted in an increase in the secretion of pro-inflammatory TNFα and a decrease in that of Adp, supposedly by these cells, events that are likely to result in whole-body [metabolic] pathologies (Guilherme et al., Citation2008; Westerink and Visseren, Citation2011). Those studies attributed the surge in FFA and TNFα to HFD-induced adipocyte hypertrophy, with the increased release of chemotactins and the recruitment of macrophages generating, in turn, a pro-inflammatory state and induction of insulin resistance (Weisberg et al., Citation2003). In addition to impacting on insulin resistance, TNFα in adipose tissue can also up-regulate TG hydrolysis, thereby further increasing FFA release.
The interplay between macrophages and adipocytes is likely central to initiating and maintaining adipocyte dysfunction. Specifically, large adipocytes release more FFA that can bind to macrophage Toll-like receptor-4 (TLR-4), resulting in NF-κB activation and augmented TNFα production. In turn, macrophage-derived TNFα activates adipocytes, further inducing lipolysis. This local paracrine loop establishes a vicious cycle that presumably leads to a pro-inflammatory state for both macrophages and adipocytes (Hajer et al., Citation2008). It is of note that large adipocytes produce less Adp. Since Adp normally inhibits TLR-activated NF-κB activity, it is assumed that low Adp levels reenforce the above-described loop (Suganami et al., Citation2007). TNFα also inhibits insulin-stimulated glucose uptake, possibly by down-regulating GLUT4 mRNA and protein, and decreases insulin-stimulated auto-phosphorylation of insulin receptors and phosphorylation of insulin receptor substrate 1 (IRS-1) (Stephens and Pekala, Citation1991).
On the other hand, a low plasma Adp level is a good marker of adipocyte dysfunction that precedes insulin resistance (Stefan et al., Citation2002; Goldstein and Scalia, Citation2004). Because TNFα reduces Adp gene expression (Gonzalez-Sanchez et al., Citation2005), it is plausible to assume that the hypo adiponectinemia seen here was partially due to macrophage-induced TNFα release. Mice overexpressing Adp show normalized glucose, partial amelioration of insulin resistance, and reductions in macrophage infiltration into their adipose tissue and systemic inflammation (Goldstein and Scalia, Citation2004). The present study showed a clear association between the dysfunctional adipocyte-induced hypo adiponectinemia and increased TNFα along with increases in the HIRI and in serum and hepatic lipid levels. Murdock et al. (Citation2006) and Hanefeld et al. (Citation2007) reported similar correlations between the HIRI and levels of Adp, TNFα, and FFA. Lastly, the insulin-resistant rats here manifested marked elevations in liver lipid content (fatty liver), a sensible sequalae of obesity and insulin resistance and, therefore, considered a hepatic manifestation of metabolic syndrome (MS; Xu et al., Citation2006). The elevation in ALT levels may be due to increased pro-inflammatory TNFα production, as well as induction of gluconeogenesis, which contributes strongly to impaired insulin signalling (Miyazaki et al., Citation2002). Further, hypo adiponectinemia is believed to contribute to hepatic TG deposition and insulin resistance.
The positive effect of PIO on both glucose and lipid profiles was previously documented in several insulin resistance models (Ding et al., Citation2005; Vijay et al., Citation2009) and can be attributed to its agonistic activity on PPARγ and PPARα, which impart metabolic effects that ultimately mitigate insulin resistance in adipose tissues and liver (Westerink and Visseren, Citation2011). These effects also encounter the decreased expression of TNFα and increased release of Adp (Balfour and Plosker, Citation1999). The PIO-induced decrease in the visceral and epididymal fat weights noted here could be explained by remodeling or redistribution of fat tissues, differentiation of preadipocytes into more insulin-sensitive fat cells in fat depots, and/or apoptosis of hypertrophic large fat cells in visceral/subcutaneous fat depots. Because newly-formed fat cells possess lipogenic enzymes and manifest increased insulin sensitivity (with respect to glucose transport and inhibition of lipolysis), this remodeling of adipose tissue could explain the decline in plasma FFA levels and concomitant enhanced hepatic sensitivity to insulin, along with decreased TNFα and elevated Adp (Motoshima et al., Citation2002).
The current study showed that PIO resulted in a significant decrease in serum TNFα that occurred in tandem with improvements in glucose tolerance and hepatic tissue insulin sensitivity. However, one cannot exclude a local paracrine effect of reduced tissue TNFα levels on the liver as well as on ratios of visceral and epididymal fats/body weight. PIO treatment resulted in markedly increased circulating plasma Adp levels and a decline in hepatic fat content and increased insulin sensitivity. These concomitant changes suggest that PIO-enhanced Adp secretion by visceral adipocytes may play a role in the systemic insulin-sensitizing effects of this drug class (Motoshima et al., Citation2002). Although we did not investigate Adp expression in/by adipose tissue, it would be plausible to speculate that increased plasma Adp levels correlate with decreased hepatic fat content; this crucial link between hepatic fat content and insulin sensitivity provides a basis for concluding that PIO may exert its insulin-sensitizing effects through an Adp-related mechanism.
Transcription via activation of sterol regulatory element binding protein (SREBP) transcription factors, SIM mended lipid profiles (Murdock et al., Citation2006; Devaraj et al., Citation2007). In contrast, SIM showed poor glycemic control (a finding in line with studies by Hwu et al. (Citation1999), Kanda et al. (Citation2003), and Satoh et al. (Citation2005)). Since subjects with MS exhibit a pro-inflammatory state derived from hypertrophic adipocytes, statins’ beneficial effects extend beyond controlling lipid profiles to other pleiotropic effects as modulators of inflammation, a key pathology associated with MS. In our study, while SIM treatment lowered adipocyte-/macrophage-derived TNFα levels, hepatic TG content, and ALT activity, these outcomes were not correlated with any increase in anti-inflammatory Adp levels. The ability of SIM to down-regulate TNFα may be attributed to its capacity to inhibit TLR-4-triggered expression of NFκB activity in—and IFNγ effects on—macrophages in the adipose tissue (Guo and Zhou, Citation2004; Lai et al., Citation2008). Like PIO, SIM can increase PPARγ expression in adipocytes, and so could be responsible for its anti-inflammatory effects. However, failure of SIM to correct glucose homeostasis and Adp may correlate them together, where most reports concluded that a failure of SIM to ameliorate insulin resistance and to correct glycemic control was due to lack of influence on Adp levels (Bulcao et al., Citation2007; Devaraj et al., Citation2007; Forst et al., Citation2007; Koh et al., Citation2007; Khan et al., Citation2009). Such results led to a conclusion that the pathophysiology of glucose intolerance in the insulin resistance pattern is mediated via an Adp-dependent mechanism.
The combined therapy of PIO with SIM was superior to that from each drug alone. Specifically, it was found that SIM potentiated the insulin sensitizing (insulin level, HOMA-I) and hypoglycemic effects (glucose, glycated Hb) induced by PIO in the HFD-treated hosts. Moreover, it seemed that PIO impacted on the lipid lowering effect of SIM. These effects are in keeping with those documented earlier with other TZD and statin drugs (Freed et al., Citation2002; Chu et al., Citation2006). The possible mechanism for these interactions may depend on the two adipocyte cytokines, especially Adp, which was boosted markedly by the combined therapy; however, other potential mechanisms should be further investigated. To this end, the findings of this work point to the successful use of the combination therapy to provide better control over altered insulin resistance as well as to reduce adipocyte inflammation, thereby potentially mitigating overall metabolic repercussions, including cardiovascular ones, associated with MS.
At this point, a valid question in the mind of the reader might be why there were no separate studies run in parallel here to assess effects of both PIO and SIM in non-HFD hosts, viz.to quantify background effects of each agent in the absence of the HFD-induced pathologic state. We address this potential concern in two ways. (1) This study was designed to measure the impact of each drug alone and in combination on the specific pathology associated with the HFD-induced state and, as such, drug-induced changes relative to an untreated HFD host provided the majority of information about pharmacologic/immunologic effects that we were interested in discerning. (2) There are a plethora of studies performed during the original preclinical trial phases of drug development for these agents, as well as a handful or more recent ones. In summary, using normal, insulin resistant, and/or streptozotocin-induced diabetic rats, those studies showed that, in normal healthy rats: (a) PIO (at upwards of 10–24 mg/kg/day, for 4 days) did not alter plasma glucose and lipid levels (Ikeda et al., Citation1990); (b) PIO (at 4 mg/kg/day, for 8 weeks) did not alter serology or hepatic histology (El Gawly et al., Citation2009); (c) PIO (at 10 mg/kg/day, for 4 weeks) had no effect on glucose, HbA1c, and lactate dehydrogenase levels/activities (Kakadiya and Shah, Citation2010); (d) did not impact upon cholesterol absorption (Colca et al., Citation1991); and (e) PIO (at 10 mg/kg/day, for 4 weeks) did not affect blood pressure, blood glucose level, or body weight (Majithiya et al., Citation2005). Similarly, studies using SIM (at 10 mg/kg/day, for 5 weeks) indicated that this agent had no effect on body weight, food/fluid intake, blood glucose, urea, creatinine, AST, ALT, lipid profiles total hemoglobin, HbA1(c), plasma glutathione, or Vitamin C status (Mohamadin et al., Citation2011). One study by Kalo (Citation2009) using high SIM doses (i.e., 25–100 mg/kg/day for up to 8 weeks) indicated significant effects on serum triglyceride and liver enzyme function (i.e., ALT, AST) levels; however, the effects at 25 mg/kg dosage were more often not significant. Thus, we can conclude that, outside of the pathologic state induced by the HFD, both SIM and PIO do not cause untoward toxicities in the rat model.
In conclusion, the ameliorating effect of SIM ± PIO on HFD-induced adipocyte dysfunction and metabolic repercussions needs to be extrapolated to other combinations of statins + insulin sensitizers. Furthermore, the effects of combined therapies on other adipocytokines that may play different roles than Adp in MS/diabetes also should be examined. From a clinical perspective, the main outcome of the implementation of a combined therapy of SIM + PIO could be a delaying of the development of Type 2 diabetes and the subsequent onset of cardiovascular damage in patients with MS.
Declaration of interest
The author reports no conflicts of interest. The author alone is responsible for the content and writing of the paper.
References
- Astrup, A. and Finer, N. 2000. Redefining Type 2 diabetes: ‘Diabesity’ or ‘obesity dependent diabetes mellitus’? Obes Rev 1:57–59.
- Balfour, J. A. and Plosker, G. L. 1999. Rosiglitazone. Drugs 57:921–30; discussion 931.
- Bennett, P. H. 1983. The diagnosis of diabetes: New international classification and diagnostic criteria. Annu Rev Med 34:295–309.
- Berntorp, K., Trell, E., Thorell, J. and Hood, B. 1983. Relation between plasma insulin and blood glucose in a cross-sectional population study of the oral glucose tolerance test. Acta Endocrinol 102:549–556.
- Bligh, E. G. and Dyer, W. J. 1959. A rapid method of total lipid extraction and purification. Can J Biochem Physiol 37:911–917.
- Bogacka, I., Xie, H., Bray, G. A. and Smith, S. R.. 2004. The effect of pioglitazone on peroxisome proliferator-activated receptor-γ target genes related to lipid storage in vivo. Diabetes Care 27:1660–1667.
- Bogacka, I., Xie, H., Bray, G. A. and Smith, S. R. 2005. Pioglitazone induces mitochondrial biogenesis in human subcutaneous adipose tissue in vivo. Diabetes 54:1392–1399.
- Bulcão, C., Giuffrida, F. M., Ribeiro-Filho, F. F. and Ferreira, S. R. 2007. Are the beneficial cardiovascular effects of simvastatin and metformin also associated with a hormone-dependent mechanism improving insulin sensitivity? Braz J Med Biol Res 40:229–235.
- Chu, C. S., Lee, K. T., Lee, M. Y., Su, H. M., Voon, W. C., Sheu, S. H. and Lai, W. T.. 2006. Effects of rosiglitazone alone and in combination with atorvastatin on nontraditional markers of cardiovascular disease in patients with Type 2 diabetes mellitus. Am J Cardiol 97:646–650.
- Colca, J. R., Dailey, C. F., Palazuk, B. J., Hillman, R. M., Dinh, D. M., Melchior, G. W. and Spilman, C. H. 1991. Pioglitazone hydrochloride inhibits cholesterol absorption and lowers plasma cholesterol concentrations in cholesterol-fed rats. Diabetes 40:1669–1674.
- Devaraj, S., Siegel, D. and Jialal, I. 2007. Simvastatin (40 mg/day), adiponectin levels, and insulin sensitivity in subjects with the metabolic syndrome. Am J Cardiol 100:1397–1399.
- Ding, S. Y., Shen, Z. F., Chen, Y. T., Sun, S. J., Liu, Q. and Xie, M. Z. 2005. Pioglitazone can ameliorate insulin resistance in low-dose streptozotocin and high sucrose-fat diet induced obese rats. Acta Pharmacol Sin 26:575–580.
- El Gawly, H. W., Tawfik, M. K., Rashwan, M. E. and Baruzaig, A. S. 2009. The effect of pioglitazone on the liver of streptozotocin-induced diabetic albino Wistar rats. Eur Rev Med Pharmacol Sci 13:443–451.
- Esteve, E., Ricart, W. and Fernández-Real, J. M. 2009. Adipocytokines and insulin resistance: The possible role of lipocalin-2, retinol binding protein-4, and adiponectin. Diabetes Care 32 Suppl 2:S362–S367.
- Forst, T., Pfutzner, A., Lubben, G., Weber, M., Marx, N., Karagiannis, E., Koehler, C., Baurecht, W., Hohberg, C. and Hanefeld, M. 2007. Effect of simvastatin/pioglitazone on insulin resistance, insulin secretion, adiponectin, and pro-insulin levels in non-diabetic patients at cardiovascular risk—the PIOSTAT Study. Metabolism 56:491–496.
- Freed, M. I., Ratner, R., Marcovina, S. M., Kreider, M. M., Biswas, N., Cohen, B. R. and Brunzell, J. D. Rosiglitazone Study 108 investigators. 2002. Effects of rosiglitazone alone and in combination with atorvastatin on the metabolic abnormalities in Type 2 diabetes mellitus. Am J Cardiol 90:947–952.
- Goldstein, B. J. and Scalia, R. 2004. Adiponectin: A novel adipokine linking adipocytes and vascular function. J Clin Endocrinol Metab 89:2563–2568.
- González-Sánchez, J. L., Zabena, C. A., Martínez-Larrad, M. T., Fernández-Pérez, C., Pérez-Barba, M., Laakso, M. and Serrano-Ríos, M. 2005. An SNP in the adiponectin gene is associated with decreased serum adiponectin levels and risk for impaired glucose tolerance. Obes Res 13:807–812.
- Greenberg, A. S. and Obin, M. S. 2006. Obesity and the role of adipose tissue in inflammation and metabolism. Am J Clin Nutr 83:461S–465S.
- Guilherme, A., Virbasius, J. V., Puri, V. and Czech, M. P.. 2008. Adipocyte dysfunctions linking obesity to insulin resistance and Type 2 diabetes. Nat Rev Mol Cell Biol 9:367–377.
- Guo, Z. and Zhou, L. 2004. Evidence for increased and insulin-resistant lipolysis in skeletal muscle of high-fat-fed rats. Metab Clin Exp 53:794–798.
- Hajer, G. R., van Haeften, T. W. and Visseren, F. L. 2008. Adipose tissue dysfunction in obesity, diabetes, and vascular diseases. Eur Heart J 29:2959–2971.
- Hanefeld, M., Marx, N., Pfützner, A., Baurecht, W., Lübben, G., Karagiannis, E., Stier, U. and Forst, T. 2007. Anti-inflammatory effects of pioglitazone and/or simvastatin in high cardiovascular risk patients with elevated high sensitivity C-reactive protein: The PIOSTAT Study. J Am Coll Cardiol 49:290–297.
- Horio, F., Teradaira, S., Imamura, T., Anunciado, R. V., Kobayashi, M., Namikawa, T. and Niki, I. 2005. The HND mouse, a nonobese model of Type 2 diabetes mellitus with impaired insulin secretion. Eur J Endocrinol 153:971–979.
- Hu, E., Liang, P. and Spiegelman, B. M. 1996. AdipoQ is a novel adipose-specific gene dysregulated in obesity. J Biol Chem 271:10697–10703.
- Hwu, C. M., Kwok, C. F., Chen, H. S., Shih, K. C., Lee, S. H., Hsiao, L. C., Lin, S. H. and Ho, L. T. 1999. Lack of effect of simvastatin on insulin sensitivity in Type 2 diabetic patients with hypercholesterolaemia: Results from a double-blind, randomized, placebo-controlled crossover study. Diabet Med 16:749–754.
- Ikeda, H., Taketomi, S., Sugiyama, Y., Shimura, Y., Sohda, T., Meguro, K. and Fujita, T. 1990. Effects of pioglitazone on glucose and lipid metabolism in normal and insulin resistant animals. Arzneimittelforschung 40:156–162.
- Jain, M. K. and Ridker, P. M. 2005. Anti-inflammatory effects of statins: Clinical evidence and basic mechanisms. Nat Rev Drug Discov 4:977–987.
- Kadowaki, T., Yamauchi, T., Kubota, N., Hara, K., Ueki, K. and Tobe, K. 2006. Adiponectin and adiponectin receptors in insulin resistance, diabetes, and the metabolic syndrome. J Clin Invest 116:1784–1792.
- Kakadiya, J. and Shah, N. 2010. Investigation of effects of pioglitazone, glimepiride, nobivolol, valsartan, and hesperidine on glucose, HbA1c and lactate dehydrogenase in isoproterenol-induced myocardial infarction in normal and diabetic rats. JITPS 1:144–151.
- Kalo, M. S. 2009. Effect of cholesterol biosynthesis inhibitor on some biochemical parameters in normal male rats. Iraqi J Vet Sci 23:5–12.
- Kanda, M., Satoh, K. and Ichihara, K. 2003. Effects of atorvastatin and pravastatin on glucose tolerance in diabetic rats mildly induced by streptozotocin. Biol Pharm Bull 26:1681–1684.
- Kannappan, S. and Anuradha, C. V. 2009. Insulin sensitizing actions of fenugreek seed polyphenols, quercetin and metformin in a rat model. Indian J Med Res 129:401–408.
- Khan, T., Hamilton, M. P., Mundy, D. I., Chua, S. C. and Scherer, P. E. 2009. Impact of simvastatin on adipose tissue: Pleiotropic effects in vivo. Endocrinology 150:5262–5272.
- Koh, K. K., Quon, M. J., Lee, S. J., Han, S. H., Ahn, J. Y., Kim, J. A., Chung, W. J., Lee, Y. and Shin, E. K. 2007. Efonidipine simultaneously improves blood pressure, endothelial function, and metabolic parameters in nondiabetic patients with hypertension. Diabetes Care 30:1605–1607.
- Lai, I. R., Chang, K. J., Tsai, H. W. and Chen, C. F.. 2008. Pharmacological preconditioning with simvastatin protects liver from ischemia-reperfusion injury by heme oxygenase-1 induction. Transplantation 85:732–738.
- Lee, M. Y., Lee, E. Y., Lee, B. J., Won, C. S., Koh, J. H., Shin, J. Y., Shin, Y. G., Cho, B. P. and Chung, C. H. 2007. Beneficial effects of thiazolidinediones on diabetic nephropathy in OLETF rats. Yonsei Med J 48:301–307.
- Lumeng, C. N., Bodzin, J. L. and Saltiel, A. R. 2007. Obesity induces a phenotypic switch in adipose tissue macrophage polarization. J Clin Invest 117:175–184.
- Majithiya, J. B., Paramar, A. N. and Balaraman, R. 2005. Pioglitazone, a PPARgamma agonist, restores endothelial function in aorta of streptozotocin-induced diabetic rats. Cardiovasc Res 66:150–161.
- Malinowski, J. M. and Bolesta, S. 2000. Rosiglitazone in the treatment of Type 2 diabetes mellitus: A critical review. Clin Ther 22:1151–68; discussion 1149.
- Matthews, D. R., Hosker, J. P., Rudenski, A. S., Naylor, B. A., Treacher, D. F. and Turner, R. C. 1985. Homeostasis model assessment: Insulin resistance and beta-cell function from fasting plasma glucose and insulin concentrations in man. Diabetologia 28:412–419.
- Mital, S., Magneson, A., Loke, K. E., Liao, J., Forfia, P. R. and Hintze, T. H. 2000. Simvastatin acts synergistically with ACE inhibitors or amlodipine to decrease oxygen consumption in rat hearts. J Cardiovasc Pharmacol 36:248–254.
- Miyazaki, Y., Mahankali, A., Matsuda, M., Mahankali, S., Hardies, J., Cusi, K., Mandarino, L. J. and DeFronzo, R. A. 2002. Effect of pioglitazone on abdominal fat distribution and insulin sensitivity in Type 2 diabetic patients. J Clin Endocrinol Metab 87:2784–2791.
- Miyazaki, Y., Mahankali, A., Wajcberg, E., Bajaj, M., Mandarino, L. J. and DeFronzo, R. A. 2004. Effect of pioglitazone on circulating adipocytokine levels and insulin sensitivity in Type 2 diabetic patients. J Clin Endocrinol Metab 89:4312–4319.
- Mohamadin, A. M., Elberry, A. A., Abdel Gawad, H. S., Morsy, G. M. and Al-Abbasi, F. A. 2011. Protective effects of simvastatin, a lipid-lowering agent, against oxidative damage in experimental diabetic rats. J. Lipids. 2011:167958. Epub 2011:Dec 6 (doi:10.1155/2011/167958).
- Moore, M. C., Cherrington, A. D., Mann, S. L. and Davis, S. N. 2000. Acute fructose administration decreases the glycemic response to an oral glucose tolerance test in normal adults. J Clin Endocrinol Metab 85:4515–4519.
- Motoshima, H., Wu, X., Sinha, M. K., Hardy, V. E., Rosato, E. L., Barbot, D. J., Rosato, F. E. and Goldstein, B. J. 2002. Differential regulation of adiponectin secretion from cultured human omental and subcutaneous adipocytes: Effects of insulin and rosiglitazone. J Clin Endocrinol Metab 87:5662–5667.
- Murdock, D. K., Jansen, D., Juza, R. M., Kersten, M., Olson, K. and Hendricks, B. 2006. Benefit of adding pioglitazone to statin therapy in non-diabetic patients with the metabolic syndrome. WMJ 105:22–25.
- Psyrogiannis, A., Kyriazopoulou, V., Symeonidis, A., Leotsinidis, M. and Vagenakis, A. G. 2003. Relative iron “overload” in offspring of patients with type 2 diabetes mellitus: A new component in the conundrum of insulin resistance syndrome? Hormones (Athens) 2:161–168.
- Satoh, K., Keimatsu, N., Kanda, M., Kasai, T., Takaguri, A., Sun, F. and Ichihara, K. 2005. HMG-CoA reductase inhibitors do not improve glucose intolerance in spontaneously diabetic Goto-Kakizaki rats. Biol Pharm Bull 28:2092–2095.
- Schaefer, J. R., Schweer, H., Ikewaki, K., Stracke, H., Seyberth, H. J., Kaffarnik, H., Maisch, B. and Steinmetz, A. 1999. Metabolic basis of high density lipoproteins and apolipoprotein A-I increase by HMG-CoA reductase inhibition in healthy subjects and a patient with coronary artery disease. Atherosclerosis 144:177–184.
- Stanhope, K. L. and Havel, P. J. 2008. Fructose consumption: potential mechanisms for its effects to increase visceral adiposity and induce dyslipidemia and insulin resistance. Curr Opin Lipidol 19:16–24.
- Stefan, N., Vozarova, B., Funahashi, T., Matsuzawa, Y., Weyer, C., Lindsay, R. S., Youngren, J. F., Havel, P. J., Pratley, R. E., Bogardus, C. and Tataranni, P. A. 2002. Plasma adiponectin concentration is associated with skeletal muscle insulin receptor tyrosine phosphorylation, and low plasma concentration precedes a decrease in whole-body insulin sensitivity in humans. Diabetes 51:1884–1888.
- Stephens, J. M. and Pekala, P. H. 1991. Transcriptional repression of the GLUT4 and C/EBP genes in 3T3-L1 adipocytes by tumor necrosis factor-alpha. J Biol Chem 266:21839–21845.
- Suganami, T., Tanimoto-Koyama, K., Nishida, J., Itoh, M., Yuan, X., Mizuarai, S., Kotani, H., Yamaoka, S., Miyake, K., Aoe, S., Kamei, Y. and Ogawa, Y.. 2007. Role of the Toll-like receptor 4/NF-κB pathway in saturated fatty acid-induced inflammatory changes in the interaction between adipocytes and macrophages. Arterioscler Thromb Vasc Biol 27:84–91.
- Teruel, T., Hernandez, R., Rial, E., Martin-Hidalgo, A. and Lorenzo, M. 2005. Rosiglitazone up-regulates lipoprotein lipase, hormone-sensitive lipase and uncoupling protein-1, and down-regulates insulin-induced fatty acid synthase gene expression in brown adipocytes of Wistar rats. Diabetologia 48:1180–1188.
- Thorburn, A. W., Storlien, L. H., Jenkins, A. B., Khouri, S. and Kraegen, E. W. 1989. Fructose-induced in vivoinsulin resistance and elevated plasma triglyceride levels in rats. Am J Clin Nutr 49:1155–1163.
- Vega, G. L., Clark, L. T., Tang, A., Marcovina, S., Grundy, S. M. and Cohen, J. C. 1998. Hepatic lipase activity is lower in African American men than in white American men: Effects of 5′ flanking polymorphism in the hepatic lipase gene (LIPC). J Lipid Res 39:228–232.
- Vijay, S. K., Mishra, M., Kumar, H. and Tripathi, K. 2009. Effect of pioglitazone and rosiglitazone on mediators of endothelial dysfunction, markers of angiogenesis and inflammatory cytokines in Type-2 diabetes. Acta Diabetol 46:27–33.
- Weisberg, S. P., McCann, D., Desai, M., Rosenbaum, M., Leibel, R. L and Ferrante, A.W.. Jr. 2003. Obesity is associated with macrophage accumulation in adipose tissue. J Clin Invest 112:1796–1808.
- Westerink, J. and Visseren, F. L. 2011. Pharmacological and non-pharmacological interventions to influence adipose tissue function. Cardiovasc Diabetol 10:13.
- Weyer, C., Funahashi, T., Tanaka, S., Hotta, K., Matsuzawa, Y., Pratley, R. E. and Tataranni, P. A. 2001. Hypoadiponectinemia in obesity and Type 2 diabetes: Close association with insulin resistance and hyperinsulinemia. J Clin Endocrinol Metab 86:1930–1935.
- Xu, P., Zhang, X. G., Li, Y. M., Yu, C. H., Xu, L. and Xu, G. Y. 2006. Research on the protection effect of pioglitazone for non-alcoholic fatty liver disease (NAFLD) in rats. J Zhejiang Univ Sci B 7:627–633.
- Yadav, H., Jain, S., Yadav, M., Sinha, P. R., Prasad, G. B. and Marotta, F. 2009. Epigenomic derangement of hepatic glucose metabolism by feeding of high fructose diet and its prevention by Rosiglitazone in rats. Dig Liver Dis 41:500–508.
- Yki-Järvinen, H. 2004. Thiazolidinediones. N Engl J Med 351:1106–1118.