
Abstract
Evidence suggests that bio-activation of drugs to generate chemically reactive metabolites (RM) that act as haptens to form immunogenic protein conjugates may be an important cause of immune-mediated drug hypersensitivity reactions (IDHR). Although many drugs that form RMs raise concerns about producing IDHR, standard non-clinical testing methods are rarely able to identify compounds with the potential to produce IDHR in humans. The objective of this study was to develop a predictive assay for IDHR that involves: (1) the use of an in vitro drug-metabolizing system to generate the RM that is captured by GSH, (2) conjugating the RM-GSH conjugate to mouse serum albumin (MSA) by using a chemical cross-linker, (3) immunization of mice with RM-GSH-MSA adducts, and (4) ex vivo challenge with RM-GSH-MSA adduct and measurement of lymphocyte proliferation to determine if the RM is immunogenic. The predictivity of the assay was evaluated by using drugs that produce RM and have been strongly, weakly, or not associated with IDHRs in the clinic. While this method requires additional validation with more drugs, the results demonstrate the feasibility of identifying drugs strongly associated with IDHR and the utility of the assay for rank ordering drugs with respect to their potential to cause IDHR.
Introduction
It is reported that 20% of drug candidates that enter clinical trials fail to become approved drugs due to safety issues (Dimasi, Citation2001). Many of these safety failures are caused by the ineffectiveness of standard non-clinical repeat dose toxicity studies in detecting certain types of potential adverse reactions. Immune-mediated drug hypersensitivity reactions (IDHR) are identified as the area where currently available non-clinical testing methods are least able to predict for the clinical situation (Olson et al., Citation2000). IDHR, such as allergic hepatitis, cutaneous reactions, and blood dyscrasias, account for ≈6–10% of all adverse drug reactions (Adkinson et al., Citation2002). Although some IDHR are rare (afflicting 1/100 to 1/100 000 patients), their serious and unpredictable nature makes them a significant public health problem and may result in severe warnings in the drug label or withdrawal from the market.
For drugs that are administered by the oral or parenteral routes, there are no validated predictive in vivo or in vitro methods available to identify drugs with the potential to produce IDHR. It has been observed that most of the low molecular weight (MW) drugs that produce hypersensitivity reactions are administered at doses above 10 mg per day (Uetrecht, Citation2007). Therefore, the current approach to minimize risk is by trying to keep the total daily dose below this level. In addition, some IDHR may be mediated by reactive metabolites (RM) of drugs that covalently bind to endogenous proteins, leading to an immune response against the drug-protein adducts (Uetrecht, Citation2003; Park et al., Citation2011).
Based on this mechanism, in vitro assays that evaluate the ability of test compounds to generate RM have been developed to identify the best candidate for clinical testing (i.e. those with little to no RM generation). These assays indirectly determine RM generation through trapping the metabolites with glutathione and subsequent analysis by mass spectroscopy (Dieckhaus et al., Citation2005; Soglia et al., Citation2006; Yan et al., Citation2007). However, while the formation of RM may result in non-specific cytotoxicity, the RM may not necessarily lead to IDHR. For example, acetaminophen would be positive in the RM assay, but is not associated with IDHR in humans. Therefore, for compounds positive in the RM assay, additional testing methods are needed to determine if the metabolite has the potential to cause hypersensitivity reactions.
There are a few animal models that have been developed to predict the potential of systemically administered drugs to induce hypersensitivity reactions. These include the popliteal lymph node assay (PLNA), the reporter antigen-PLNA and the mouse lymph node proliferation assay (Goebel et al., Citation1996; Weaver et al., Citation2005; Ludwig et al., Citation2010). However, since the mouse may not generate the same RM and/or the same amount of RM that will result in IDHR in humans, there is a concern about false negative results. To address this limitation, the objective of this study was to develop a unique model to determine the immunogenicity of RM formed from low MW drugs. This novel approach uses four steps. The first step involves in vitro generation of the RM with recombinant cytochrome P450 isozymes (CYP450) and capture with reduced glutathione (GSH). Next, the GSH-conjugate is chemically linked to mouse serum albumin (MSA). Mice are then immunized and boosted with the RM-GSH-MSA conjugate. The final step involves ex vivo incubation of lymph node cells from immunized mice with RM-protein conjugates and the proliferative response is measured.
Five drugs, all of which are known to form RM through bioactivation, were chosen to determine the feasibility of this approach. Sulfamethoxazole (SMX) and carbamazepine (CBZ) are clearly associated with IDHR (Harr & French Citation2010; Beghi & Shorvon Citation2011; Kumari et al., Citation2011). Propranolol (PRO) has been associated with anaphylactic and cutaneous hypersensitivity reactions, albeit with lower frequencies than SMX and CBZ. Simvastatin (SIM) has been reported to cause eczema and lupus, but it is not known if these are true IDHR (Adams et al., Citation2010; Ruger et al., Citation2011). Acetaminophen (APAP) is rarely associated with IDHR. Data from the initial set of drugs demonstrate that this may be a feasible approach to determine and rank drugs’ potential to produce IDHR.
Materials and methods
Materials
SMX, APAP, CBZ, glutathione (GSH), β-nicotinamide adenine dinucleotide phosphate (NADPH), ovalbumin (OVA), complete Freund’s adjuvant (CFA), and incomplete Freund’s adjuvant (IFA) were obtained from Sigma Chemical Co. (St. Louis, MO). The following chemicals and reagents were purchased from various companies: SIM (Tocris Bioscience, Bristol, UK), PRO (TCI America, Portland, OR), MSA (MP Biomedicals, Solon, OH), [3H]-thymidine (GE Healthcare, Piscataway, NJ), 1-Ethyl-3-[3-dimethylaminopropyl] carbodiimide hydrochloride (EDC) (Thermo Fisher Scientific Inc., Rockford, IL), and recombinant human (rh) CYP2C9, 2E1, 3A4 and 2D6 (BD Biosciences, San Jose, CA).
Animals
BALB/cJ, C57BL/6J and DBA/1 mice (7–10 weeks-of-age) were purchased from the Jackson Laboratory (Bar Harbor, ME) and kept in the Center for Laboratory Animal Care at the University of Colorado Denver (UCD) for 1 week before treatments. The facilities were maintained at 22–24 °C with 40–60% relative humidity and a 12-h light–dark cycle. All mice had ad libitum access to standard rodent chow and filtered water during the experiments. All animal experiments were performed in accordance with guidelines from the UCD Institutional Animal Care and Use Committee.
Synthesis of RM-GSH-protein adducts
A given drug (10 mM in 1 ml reaction solution) was incubated with the appropriate rhCYP450 enzyme at a concentration that gives optimal catalytic activity determined by a model substrate (Rendic, 2002). NADPH (2 mM) and GSH (2 mM) were also included in the reaction mixture. After a 4 h incubation at 37 °C, the rhCYP450 enzyme was removed by using a 10 kD exclusion column (Amicon Centrifugal Filters, EMD Millipore, Billerica, MA). Subsequently, MSA or OVA (8 mg) was added into the ligation mixture containing the RM-GSH conjugates and EDC (3.3 mg/ml). After a 2 h incubation period at room temperature, excess EDC was removed by using a desalting column. The final products were the RM-GSH-(MSA or OVA) conjugates.
Immunization and proliferation assay
Seven-to-eight mice were immunized at the base of the tail with various amounts (50–100 µg) of RM-GSH-MSA (or -OVA) adducts dissolved in PBS and emulsified with CFA. One week later, a booster injection of the same amount and preparation of RM-GSH-MSA (or -OVA) in conjunction with IFA was administered. In experiments examining the immunogenicity of various compounds, each animal was immunized with RM-GSH-MSA of a given drug plus SMX-GSH-MSA, which served as an internal positive control. One week after the second immunization, mice were sacrificed, and the draining inguinal and peri-aortic lymph nodes were harvested and combined for each mouse. Freshly isolated lymph node cells were cultured (0.5 × 10⁶ cells/well) in 96-well plates in RPMI1640 containing 10% fetal calf serum (FCS). Drug-specific T-cell responses were examined by ex vivo re-stimulation of lymph node cells with various RM-GSH-MSA (or -OVA) protein adducts or GSH-MSA (or -OVA) alone (20 or 50 μg/mL) for 4 days (triplicate wells). During the last 16 h, the cells were pulsed with [3H]-thymidine (0.5 μCi/well), and T-cell proliferation was determined by thymidine uptake using a FilterMate™ Universal Harvester (PerkinElmer, Waltham, MA).
Immunoblot analysis
The RM-protein adducts of SMX and APAP were diluted in Laemmli sample buffer (Bio-Rad Laboratories, Hercules, CA) under reducing conditions, boiled for 5 min, and resolved over 12% polyacrylamide gels. After being transferred onto nitrocellulose membranes, non-specific binding was blocked with 5% non-fat milk. The blots were probed with a rabbit polyclonal anti-SMX antibody (1:100; kindly provided by Dr. Craig Svenssen, Purdue University, West Lafayette, IN) or anti-NAPQI antibody (1:500, kindly provided by Dr. Lance Pohl, NIH, Bethesda, MD), and then incubated with horseradish peroxidase-conjugated goat anti-rabbit IgG antibody (1:2000; Millipore Bioscience Research Reagents, Temecula, CA). Protein signals were visualized using an enhanced chemiluminescence (ECL) Plus Western blotting detection system (GE Healthcare, Chalfont St. Giles, Buckinghamshire, UK), and data were captured using a Storm 860 system (GE Healthcare).
Statistical analysis
For each individual animal, T-cell proliferation (measured by [3H]-thymidine uptake in counts per minute [CPM]) in response to RM-GSH-MSA was compared with the CPM in response to MSA by using the analysis of variances (ANOVA) with a post-hoc Dunnett’s test. Since most response data approximately followed log-normal distributions, the data had been log-transformed before conducting the analysis. Data were presented as fold-change values, which were determined by the ratio of CPMRM-GSH-MSA to CPMMSA for each animal. Fold-changes were considered significant when p < 0.05. Another ANOVA was used with all the animal data combined and added animal as a factor in the analysis. The overall mean fold-changes from CPMMSA were calculated based upon the latter ANOVA.
Results
In vitro generation of the RM-protein adducts of SMX
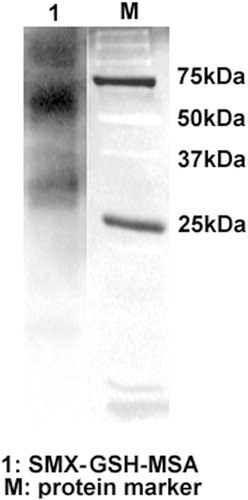
SMX was metabolized in vitro through incubation with rhCYP450 2C9 in the presence of NADPH. The RM of SMX, i.e. nitroso-SMX (SMX-NO), became bound to GSH as it was generated. RM-MSA adducts were synthesized by using EDC to bridge GSH to protein. EDC is a zero-length cross-linking agent widely used to couple carboxyl groups to primary amines. The immunoblot analysis detected intense bands of RM-MSA adducts (), confirming the effectiveness of this in vitro system in generating RM and its protein conjugates.
Figure 1. Generation of SMX-GSH-MSA adducts. SMX (10 mM) was metabolized in vitro by hCYP450 2C9. The reactive metabolite SMX-NO was trapped by GSH and further conjugated to MSA with the use of EDC. SMX-GSH-MSA adducts (lane 1) were detected by immunoblot using anti-SMX antisera. Molecular mass markers (M) are indicated.
Induction of SMX-specific immune response
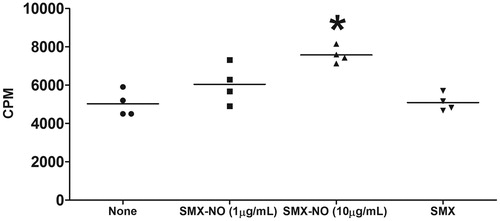
To evaluate the immunogenicity of SMX, female DBA/1 mice were immunized with the SMX-GSH-MSA adducts (100 μg/mouse) in conjunction with CFA and IFA. One week after the last immunization, the lymph node proliferation assay was performed by ex vivo re-stimulation of the cells with either SMX-NO (relatively stable metabolite that is commercially available) (1 and 10 μg/ml) or SMX (50 μg/ml). The data show that stimulating the cells with 10 μg/ml of SMX-NO (but not 1 μg/ml of SMX-NO or SMX) elicited a significantly higher proliferative response compared with unstimulated control cells ().
Figure 2. SMX-GSH-MSA adducts elicit drug-specific T-cell responses in mice. Female DBA/1 mice were immunized with SMX-GSH-MSA in combination with CFA and IFA. SMX-specific immune responses were evaluated by ex vivo re-stimulation of lymph node cells with nothing (none), SMX-NO (1 or 10 μg/ml) or SMX (50 μg/ml). Results from four mice per group are shown, and mean (±SEM) values compared. *p < 0.05 compared with cell stimulated with none.
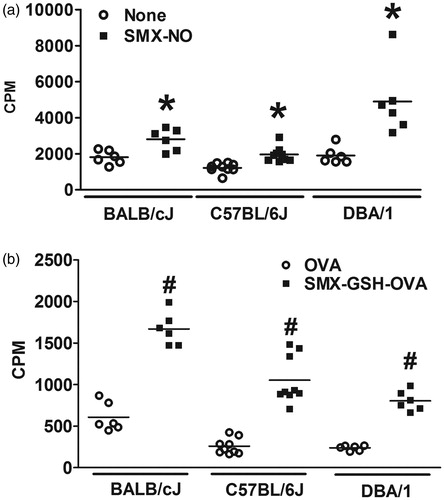
To investigate whether different strains of mice exhibit varying degrees of SMX-specific immune responses, female BALB/cJ, C57BL/6J and DBA/1 mice were immunized with SMX-GSH-MSA as described above. Lymph node cells were re-stimulated with SMX-NO or with SMX-GSH-OVA to confirm that the T-cell response was RM-specific and independent of the carrier protein. SMX-GSH-OVA conjugates were synthesized in vitro following the same method as used in SMX-GSH-MSA synthesis. The data show that ex vivo stimulation with SMX-NO () or SMX-GSH-OVA () elicited positive SMX-specific immune responses in all three strains of mice. The data suggest that all three strains of mice could be used in the assay. DBA/1 mice were selected for the majority of the experiments because they were previously shown to be a strain susceptible to SMX-NO-induced immune responses (Cheng et al., Citation2008).
Figure 3. Mouse strain variation in response to SMX-GSH-MSA immunization. Female BALB/cJ, C57BL/6J, and DBA/1 mice were immunized with SMX-GSH-MSA in combination with CFA and IFA. SMX-specific immune responses were evaluated by ex vivo re-stimulation of lymph node cells with nothing (none) or SMX-NO (10 μg/ml) in (a), and with OVA (10 μg/mL) or SMX-GSH-OVA (10 μg/ml) in (b). Results from at least six mice per group are shown and mean (±SEM) values compared. *p < 0.05 compared with cells stimulated with nothing; #p < 0.05 compared with cells stimulated with OVA.
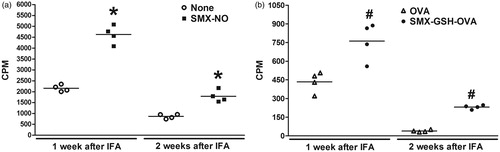
To determine the best time period between the second immunization (with IFA) and collection of lymph node cells for the ex vivo proliferation assay, a study was performed wherein 1- and 2-week rest periods were evaluated. For this study, mice were immunized with SMX-GSH-MSA and after either 1- or 2-weeks post-immunization, lymph node cells were re-stimulated ex vivo with SMX-NO or SMX-GSH-OVA. The CPM responses to SMX-NO or SMX-GSH-OVA were significantly higher than the control CPM responses after both 1 and 2 weeks; however, the magnitude of the increase was comparable between the 1- and 2-week rest periods (). Thus, to shorten the assay duration, a 1 week period was used for the remaining studies.
Figure 4. Comparison of SMX-specific immune responses generated at 1 and 2 weeks after immunization. Female DBA/1 mice were immunized with SMX-GSH-MSA in combination with CFA and IFA. Mice were sacrificed 1 or 2 weeks later. SMX-specific immune responses were evaluated by ex vivo re-stimulation of lymph node cells with nothing (none) or SMX-NO (10 μg/ml) in (a), and with OVA (10 μg/ml) or SMX-GSH-OVA (10 μg/ml) in (b). Results from four mice per group are shown and mean (±SEM) values compared. *p < 0.05 compared with cells stimulated with nothing; #p < 0.05 compared with cells stimulated with OVA.
Evaluating assay feasibility using a panel of drugs
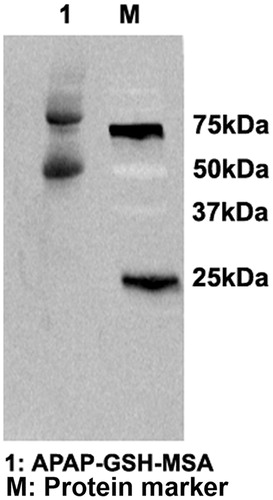
To further evaluate the feasibility of the above-described method for detecting the immunogenicity of reactive metabolite-protein adducts, a panel of drugs was tested. The key CYP450 enzyme identified to metabolize each of the parent drugs was used to generate the corresponding RM in vitro. Each RM was trapped by GSH and linked by EDC to form MSA conjugates as described above. For APAP, the generation of RM and its MSA adducts was confirmed by immunoblot analysis using anti-APAP anti-serum ().
Figure 5. Generation of APAP-GSH-MSA adducts. APAP (10 mM) was metabolized in vitro by hCYP450 2E1. The reactive metabolite NAPQI was trapped by GSH and further conjugated to MSA with the use of EDC. APAP-GSH-MSA adducts (lane 1) were detected by immunoblot using anti-APAP antisera. Molecular mass markers (M) are indicated.
When comparing the mean fold-changes, the immunogenic potentials of the drugs were ranked in the following order (): SMX (6.46), SIM (3.44), CBZ (2.92), PRO (1.94), and APAP (1.84). The ranking of drugs was also determined by using a defined fold-change value as the threshold for a positive response. The percentages of animals with positive responses at a given threshold (2.0, 2.5, or 3.0) for each drug are shown in (and ). When a fold-change of 2.0 is used as the threshold, SMX and SIM generated highest percentage of positive responses, followed by CBZ, PRO, and APAP. Using fold-changes of 2.5 or 3.0 as the threshold, the pattern for the different drugs were observed to be similar to that observed at a threshold of 2.0. Therefore, expressing as a percentage responder with different thresholds did not change the relative ranking of responses between drugs. Judging from both the mean fold-change values and the percentages of positive responses, SMX is the most immunogenic and APAP is the least immunogenic compound. CBZ and SIM are similar and both higher than PRO in terms of the potential of causing drug-specific immune response.
Figure 6. Percentage of animals in each treatment group with a positive assay response at each threshold level. Fold-change values were determined for each individual animal based on the response for RM-GSH-MSA compared to the MSA response alone. Using a defined fold-change value for a positive response, the percentage of animals positive at the given threshold were calculated.
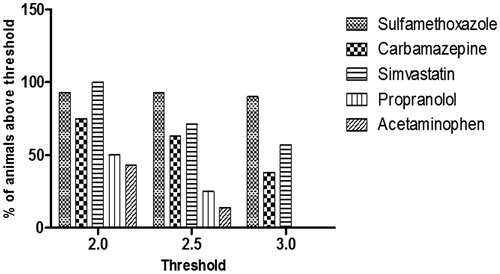
Table 1. Comparison of mean fold-changes (CPMRM-GSH-MSA/CPMMSA) of all animals tested for each drug.
Table 2. Numbers of animals in each treatment group with a positive assay response at each threshold level.
Discussion
During the drug development process, many drugs may not be further pursued for clinical testing once it is determined that they generate RM due to concerns about IDHR. These concerns are further heightened by the fact that often IDHR occur in a small percentage of the population and are not identified until larger populations are exposed (Phase 3 or commercialization). Since IDHR may have a significant impact on the use of the marketed drug, it is critical to identify potential IDHR risk early during drug development to minimize risk to patients and costs involved in the drug development process. To this end, a method to determine the potential of RM to produce hypersensitivity reactions is needed.
The goal of the present study was to develop an approach that takes into account the requirement of metabolic activation of many drugs to produce IDHR. This approach uses: (1) an in vitro drug-metabolizing system to generate the RM that is captured by GSH; (2) conjugation of the RM-GSH conjugate to MSA by using a chemical cross-linker; (3) immunization of mice with RM-GSH-MSA adducts; and (4) ex vivo challenge with RM-GSH-MSA adduct and measurements of lymphocyte proliferation to determine if the RM is immunogenic. For the first step, the isoform of CYP450 that plays a major role in the biotransformation of the parent drug needs to be known. Initial studies were conducted with liver microsomes, but this required further purification of the RM-protein adducts. Also, since the number of sulfhydryl groups in a protein is usually limited, direct conjugation of the RM to a trapping protein is inefficient. Therefore, excess GSH to trap the RM as it is generated was used as an alternative. A common type of RM is a soft electrophile that reacts with GSH (Uetrecht, Citation2003). However, in the case that a RM is a hard electrophile, N-acetyl-lysine may be used in place of GSH. Once the RM-GSH conjugate is generated, it is then linked to MSA using EDC, which is a zero length carboxyl- and amine-reactive cross-linker. In order to minimize background immune reactions against rhCYP450 protein in mice, the rhCYP450 is removed by using size-exclusion columns.
We chose to use MSA as the protein conjugate since MSA is a ‘self’ protein; therefore, one can maximize immune responses against the test drug rather than to a ‘foreign’ protein. The nature of the protein that is covalently modified by the RM may be important in determining the immunogenicity of the RM-protein adducts. However, our previous study provides evidence to support that the abundance, rather than the particular characteristics of a protein determines whether it is targeted for RM modification. It is not the nature of the protein, but the reactivity of the RM that determines the immunogenicity of the RM-protein adducts (Cheng et al., Citation2008). Therefore, MSA used as a model protein in this assay should be sufficient to evaluate the immunogenicity of the RM.
The potential for the RM of a drug to produce a hypersensitivity reaction is determined by several factors: (1) the amount and reactivity of the RM formed; (2) the epitope density of the RM-protein adducts (the number of RM molecules per molecule of protein); (3) exposure of the RM-protein adducts to the immune system; (4) the danger signal associated with the drug or metabolite that will up-regulate co-stimulatory molecules and cytokines to enhance antigen presentation and activation; (5) the Class I or II allele of the patient that is able to bind the RM-peptide conjugate and present to T-cells; and (6) the chemical structure of the RM that can be recognized by the available repertoire of T-cell receptors.
The assay developed in this study takes into account factors 1, 2, and 6 in differentiating the RM of drugs that have a higher risk of producing IDHR from those with a lower risk for IDHR. A drug that causes IDHR in patients is likely to be bio-transformed to large amounts of RM. The RM is probably highly reactive and forms larger amounts of protein adducts with high epitope density. The use of the rhCYP450 in this assay maximizes the generation of the RM of a drug. The reactivity of the RM will determine the amount of RM-GSH and, thus, RM-MSA conjugates formed. These features are recapitulated in the in vitro segment of our assay. Mice were immunized at the base of the tail with the RM-MSA adducts in the presence of CFA and IFA to maximize the immune response. The ex vivo exposure to RM-protein adducts was also maximized in this assay. Thus, the primary variable between test compounds would be the amount and epitope density, of RM-GSH-MSA adducts and the ability of T-cells to recognize and respond to RM-protein adducts.
This study evaluated the feasibility of the assay using five drugs, all of which have been shown to form RM by various isoforms of CYP450 enzymes. APAP has rarely been associated with causing IDHR, although APAP directly damages hepatocytes. Consistent with clinical data, our results reveal APAP as the least immunogenic compound tested. Among all seven mice immunized with APAP-GSH-MSA, none showed a positive response at fold-change threshold of 3.0, and only 1 and 3 showed positive response at thresholds 2.5 and 2.0, respectively ().
SMX has been associated with a relatively high incidence of hypersensitivity reactions that manifest as fever, morbilliform cutaneous reactions, and hepatotoxicity (Berg & Daniel, Citation1987; Rieder et al., Citation1989; Cribb et al., Citation1996). The time-course of the hypersensitivity syndrome development, the presence of T-cells in affected skin, and the reactivity of patients’ T-cells upon re-stimulation with SMX or SMX-NO (Miyauchi et al., Citation1991; Correia et al. Citation1993; Schnyder et al. Citation2000; Burkhart et al. Citation2001), each strongly suggested the involvement of the adaptive immune system in SMX hypersensitivity. Consistent with the clinical observations, our data identify SMX to have the strongest immunogenicity among all five test compounds. This is evident by the highest percentages of animals showing positive response to SMX-GSH-MSA immunization at all three fold-change thresholds.
CBZ causes hypersensitivity syndrome that manifests as blood disorders, hepatotoxicity and severe skin reactions, such as Stevens-Johnson syndrome (SJS) and toxic epidermal necrolysis (TEN) (Rzany et al., Citation1999). The role of the immune system in mediating these adverse reactions is strengthened by recent evidence associating CBZ-induced SJS/TEN with HLA-B*1502 and HLA-A*3101 in various ethnic populations (Chung et al., Citation2004; McCormack et al., Citation2011; Ozeki et al., Citation2011). The majority of animals immunized with CBZ-GSH-MSA showed positive responses when the fold-change threshold was set at 2.0 (six out of eight) or 2.5 (five out of eight), although less than 50% (three out of eight) showed positive responses at the threshold of 3.0 ().
PRO has been associated with a low incidence of hypersensitivity reactions; however, the severity of some of the reactions, such as SJS and TEN, has resulted in FDA-issued warnings section of the label. Consistent with the lower IDHR incidence in the clinic, the results here showed that 25% and 50% of the mice tested had positive immune responses to PRO at thresholds 2.0 and 2.5, respectively. However, none of the mice were positive at threshold 3.0.
The data here demonstrated that 57–100% of the mice tested exhibit positive responses to the immunization with SIM-GSH-MSA adducts. This finding would suggest that SIM can potentially cause IDHR; however, simvastatin is rarely associated with IDHR. This may be due to the finding that the bioavailability of simvastatin is very low due to first pass effects at the intestines and liver (Garcia et al., Citation2003). In this situation, exposure to reactive intermediates in lymphoid tissues would be extremely low. The first pass effect of PRO is also significant (Basset & Robins, Citation1980); however, the recommended doses of PRO (120–640 mg/day for most indications) are much higher than SIM (≤40 mg/day). Therefore, the potential for a high first-pass effect and low systemic bioavailability along with the daily dose may need to be taken into consideration when determining overall risk for IDHR.
In summary, we developed an assay that combines in vitro drug metabolism with in vivo immunization and ex vivo challenge steps to evaluate the potential of a drug RM to cause IDHR. The results demonstrate the feasibility of this approach to rank drugs as having the potential to cause IDHR. Additional studies are needed to further validate this assay and to determine the appropriate threshold to consider a response as positive or negative. This approach may be used in conjunction with other assays to assess the three other factors discussed above in a weight of evidence approach to determine the potential of a RM of a drug to produce IDHR. Moreover, this assay may be applicable to determine the immunogenicity of parent drugs that can covalently bind proteins.
Declaration of interest
The authors report no conflicts of interest. The authors alone are responsible for the content and writing of the paper.
Acknowledgements
The authors wish to thank Dr Craig Svenssen (Purdue University) and Dr Lance Pohl (NHLBI) for the generous gifts of, respectively, the anti-SMX and anti-APAP anti-sera. This work was supported by Pfizer Worldwide Research and Development (to C.J.).
References
- Adams, A. E., Bobrove, A. M., and Gilliam, A. C. 2010. Statins and “chameleon-like” cutaneous eruptions: Simvastatin-induced acral cutaneous vesiculobullous and pustular eruption in a 70-year-old man. J. Cutan. Med. Surg. 14:207–211
- Adkinson, N. F. Jr., Essayan, D., Gruchalla, R., et al. 2002. Task force report: Future research needs for the prevention and management of immune-mediated drug hypersensitivity reactions. J. Allergy Clin. Immunol. 109:S461–S478
- Basset, H. M., and Robins, A. H. 1980. First-pass effect and intrinsic clearance of propranolol and pindolol in the isolated perfused rat liver. S. Afr. Med. J. 58:971–973
- Beghi, E., and Shorvon, S. 2011. Anti-epileptic drugs and the immune system. Epilepsia. 52:40–44
- Berg, P. A., and Daniel, P. T. 1987. Co-trimoxazole-induced hepatic injury - an analysis of cases with hypersensitivity-like reactions. Infection. 15:S259–S264
- Burkhart, C., von Greyerz, S., Depta, J. P., et al. 2001. Influence of reduced glutathione on the proliferative response of sulfamethoxa-zole-specific and sulfamethoxazole-metabolite-specific human CD4+ T-cells. Br. J. Pharma-col. 132:623–630
- Cheng, L., Stewart, B. J., You, Q., et al. 2008. Covalent binding of the nitroso metabolite of sulfamethoxazole is important in induction of drug-specific T-cell responses in vivo. Mol. Pharmacol. 73:1769–1775
- Chung, W. H., Hung, S. I., Hong, H. S., et al. 2004. Medical genetics: A marker for Stevens-Johnson syndrome. Nature. 428:486
- Correia, O., Delgado, L., Ramos, J. P., et al. 1993. Cutaneous T-cell recruitment in toxic epidermal necrolysis. Further evidence of CD8+ lymphocyte involve-ment. Arch. Dermatol. 129:466–468
- Cribb, A. E., Lee, B. L., Trepanier, L. A., and Spielberg, S. P. 1996. Adverse reactions to sulphonamide and sulphonamide-trimethoprim antimicrobials: Clinical syndromes and pathogenesis. Adverse Drug React. Toxicol. Rev. 15:9–50
- Dieckhaus, C. M., Fernandez-Metzler, C. L., King, R., et al. 2005. Negative ion tandem mass spectrometry for the detection of glutathione conjugates. Chem. Res. Toxicol. 18:630–638
- Dimasi, J. A. 2001. Risks in new drug development: Approval success rates for investigational drugs. Clin. Pharmacol. Ther. 69:297–307
- Garcia, M. J., Reinoso, R. F., Sanchez, N. A., and Prous, J. R. 2003. Clinical pharmacokinetics of statins. Meth. Find Exp. Clin. Pharmacol. 25:457–481
- Goebel, C., Griem, P., Sachs, B., et al. 1996. The popliteal lymph node assay in mice: Screening of drugs and other chemicals for immunotoxic hazard. Inflamm. Res. 45:S85–S90
- Harr, T., and French, L. E. 2010. Toxic epidermal necrolysis and Stevens-Johnson syndrome. Orphanet. J. Rare Dis. 5:39--49
- Kumari, R., Timshina, D. K., and Thappa, D. M. 2011. Drug hypersensitivity syndrome. Indian J. Dermatol. Venereol. Leprol. 77:7–15
- Ludwig, I. S., Kwast, L. M., Fiechter, D., and Pieters, R. H. 2010. An in vivo tiered approach to test immunosensitization by low molecular weight compounds. Meth. Mol. Biol. 598:27–37
- McCormack, M., Alfirevic, A., Bourgeois, S., et al. 2011. HLA-A*3101 and carbamazepine-induced hypersensitivity reactions in Europeans. New Engl. J. Med. 364:1134–1143
- Miyauchi, H., Hosokawa, H., Akaeda, T., et al. 1991. T-Cell subsets in drug-induced toxic epidermal necrolysis. Possible pathogenic mechanism induced by CD8-positive T-cells. Arch. Dermatol. 127:851–855
- Olson, H., Betton, G., Robinson, D., et al. 2000. Concordance of the toxicity of pharmaceuticals in humans and in animals. Regul. Toxicol. Pharmacol. 32:56–67
- Ozeki, T., Mushiroda, T., Yowang, A., et al. 2011. Genome-wide association study identifies HLA-A*3101 allele as a genetic risk factor for carbamazepine-induced cutaneous adverse drug reactions in Japanese population. Hum. Mol. Genet. 20:1034–1041
- Park, B. K., Boobis, A., Clarke, S., et al. 2011. Managing the challenge of chemically reactive metabolites in drug development. Nat. Rev. Drug Discov. 10:292–306
- Rendic, S. 2002. Summary of information on human CYP enzymes: Human P450 metabolism data. Drug Metab. Rev. 34:83–448
- Rieder, M. J., Uetrecht, J., Shear, N. H., et al. 1989. Diagnosis of sulfonamide hypersensitivity reactions by in vitro ‘rechallenge’ with hydroxylamine metabolites. Ann. Intern. Med. 110:286–289
- Ruger, R. D., Simon, J. C., and Treudler, R. 2011. Subacute-cutaneous lupus erythematosus induced by Simvastatin. J. Dtsch. Dermatol. Ges. 9:54–55
- Rzany, B., Correia, O., Kelly, J. P., et al. 1999. Risk of Stevens-Johnson syndrome and toxic epidermal necrolysis during first weeks of antiepileptic therapy: A case-control study. Study Group of the International Case Control Study on Severe Cuta-neous Adverse Reactions. Lancet. 353:2190–2194
- Schnyder, B., Burkhart, C., Schnyder-Frutig, K., et al. 2000. Recognition of sulfamethoxazole and its reactive metabolites by drug-specific CD4+ T-cells from allergic individuals. J. Immunol. 164:6647–6654
- Soglia, J. R., Contillo, L. G., Kalgutkar, A. S., et al. 2006. A semiquantitative method for the determination of reactive metabolite conjugate levels in vitro utilizing liquid chromatography-tandem mass spectrometry and novel quarternary ammonium glutathione analogues. Chem. Res. Toxicol. 19:480–490
- Uetrecht, J. 2003. Screening for the potential of a drug candidate to cause idiosyncratic drug reactions. Drug Discov. Today. 8:832–837
- Uetrecht, J. 2007. Idiosyncratic drug reactions: Current understanding. Annu. Rev. Pharmacol. Toxicol. 47:513–539
- Weaver, J. L., Chapdelaine, J. M., Descotes, J., et al. 2005. Evaluation of a lymph node proliferation assay for its ability to detect pharmaceuticals with potential to cause immune-mediated drug reactions. J. Immunotoxicol. 2:11–20
- Yan, Z., Maher, N., Torres, R., and Huebert, N. 2007. Use of a trapping agent for simultaneous capturing and high-throughput screening of both “soft” and “hard” reactive metabolites. Anal. Chem. 79:4206–4214