
Abstract
This study was designed to evaluate the protective activity of Vitamin E (Vit E) on the immunotoxic effects induced by aflatoxin B1 (AFB1) in the progeny of breeder hens. For this purpose, 192 White Leghorn (WL) layer breeder hens were divided into 12 groups (A–L) and then fed test diets for either 1, 2 or 3 weeks. Group A was kept on basal feed (2900 Kcal/kg metabolizable energy) and served as control, while group B was offered a feed supplemented with Vit E at 100 mg/Kg. Groups C–G were offered feed containing 0.1, 0.5, 2.5, 5.0, and 10.0 mg/Kg AFB1, respectively, whereas groups H–L were offered the same dietary levels of AFB1 along with 100 mg/Kg Vit E supplementation. Hatching eggs were shifted to an incubator on a weekly basis to get progeny chicks. Hatched chicks in each group were maintained on basal ration and then subjected to different immunological assays. Lymphoproliferative responses (against PHA-P), antibody titers (against SRBC), oxidative damage to RBC, as well as phagocytic and nitrite production potential of the peritoneal macrophages from the chicks, were all adversely impacted by hen exposure to the higher doses of AFB1 or by increased intake (time) by the hens at a given dose of the toxin. No consistent ameliorative effects from Vit E were noted in these studies, i.e. effects seen against lower AFB1 doses were no longer apparent with the highest doses of AFB1. As such, for now it can be concluded that, with this particular single dose level of Vit E, AFB1-associated immunotoxic effects in progeny chicks can potentially be mitigated by dietary intake of Vit E by their hen dams. However, this is clearly an outcome that is driven by the level of the mycotoxin present in the feed. Future studies need to examine what impact higher Vit E doses than those employed herein might have in these ameliorative outcomes.
Introduction
Mycotoxins, secondary fungal metabolites of some toxigenic species of fungi, are a major concern in the poultry industry. Aflatoxins (AF) produced by Aspergillus flavus and A. parasiticus are reported in poultry feeds and its ingredients almost all over the world (Ahmad et al., Citation2012; Binder et al., Citation2007; Saleemi et al., Citation2012; Streit et al., Citation2012; Zaki et al., Citation2012). Losses associated with consumption of AF-contaminated foodstuff in the poultry industry include growth retardation, decreased feed intake, increased mortality, decreased egg production, and carcass condemnation (Agag, Citation2004; Hussain et al., Citation2008; Hassan et al., Citation2012b; Khan et al., Citation2010).
Among the various types of AF, aflatoxin B1 (AFB1) is an established hepatocarcinogen that causes liver lesions in both mammals and birds (Wogan, Citation1973). Several experimental studies have shown that AFB1 is also immunotoxic in both avian and mammalian hosts (Giambrone et al., Citation1978; Kadian et al., Citation1988; Otim et al., Citation2005). The concept that feeding mycotoxin-contaminated diets to dams adversely affects the immune system of developing embryos (Potchinsky and Bloom, Citation1993; Todd and Bloom, Citation1980) was strengthened by findings of Qureshi et al. (Citation1998). In that study, in broiler breeder hens fed 1 or 5 mg AFB1, there was a severe depression in progeny chick antibody titers against sheep red blood cells (SRBC) and against Brucella abortus antigen. The authors also noted that peritoneal macrophages from chicks of these hens had poor phagocytic responses against SRBC and nitrite production in response to lipopolysaccharide (LPS) stimulation. Significant damage to DNA in B- and T-lymphocytes in 18-day-old embryos has also been observed as a result of hen exposure to aflatoxins (Potchinsky and Bloom, 1993). Such outcomes would be in keeping with the findings that carryover/transfer of AF to eggs as a result of dietary intake by hens has been widely reported in aflatoxicosis (Hassan et al., Citation2012a; Micco et al., Citation1988).
Some might question the use of those assays to affirm the immunotoxicity of AF in the hens and their progeny. With avian species, the use of measures of anti-SRBC antibody titer by agglutination and that of mitogen-induced T-cells proliferation assay has been a subject of debate over the past few decades. In this regard, Grasman (Citation2002, Citation2010) affirmed that these tests were excellent indicators for use in in vivo immunotoxicity testing in bird hosts. The basis for these conclusions included their easy adaptability, reliability, and applicability to a wide range of avian hosts. As such, these specific endpoints were perfectly suited for the studies that were to be performed here, even though other more common types of analyses, i.e. cytokine measures, host resistance to pathogens, etc.,) used in Tier I/II approaches to assess immunotoxicity (Dean et al., Citation1982a, Citationb; Luster et al., Citation1989) could also eventually be adapted to avian species, including breeder hens.
Because AF in its various forms presents a strong (immuno)toxicologic risk to hosts exposed to the mycotoxins, many studies have sought out natural/derived agents that could be employed to mitigate the potential toxicities. Among these, Vitamin E (Vit. E) was reported to ameliorate toxicities induced by AF both in mammals and birds (Choi et al., Citation1995; Mubarak et al., Citation2009; Verma and Nair, Citation2001). A ‘carry-over’ of Vit E to eggs from hens has also been reported (Meluzzi et al., Citation2000; Mori et al., Citation2003). Therefore, it would not be unreasonable to suspect that chicks obtained from hens maintained on a feed containing both AFB1 and Vit E might have their immune responses protected from potential harm from the mycotoxin. Accordingly, the objectives of the present study were to determine if, in fact, there was any protective effect afforded to the progeny of hens fed AFB1 by co-consumption of dietary Vit E.
Materials and methods
Aflatoxin and feed
Aflatoxin B1 (AFB1) was produced by Aspergillus flavus (NRRL 6540; CECT 2687) using the method described by Shotwell et al. (Citation1966) on rice. Briefly, colonies of A. flavus were grown on potato-dextrose agar (PDA) slants that were incubated at 28°C for 7 days. On Day 7, 3 ml of sterile water containing 0.005% Triton X-100 was added atop each slant to prepare inoculum. For the production of AFB1, 100 g of rice were soaked in 50 ml distilled water in a 1-L Ehrlen-meyer flask and held at room temperature (with frequent shaking) for 2 h. The flask was then autoclaved at 121 °C for 15 min. After the flask cooled, inoculum was introduced and the flask was placed on an orbital shaker (200 rpm) and incubated at 28°C. After 6 days, the flask was autoclaved for 3 min to destroy mycelial growth and AFB1 contents were evaluated/confirmed by HPLC (AOAC, Citation2000).
Basal feed (16% total protein and 2900 Kcal/Kg metabolizable energy) was prepared without addition of toxin binder, vitamins, minerals, and antibiotics. Prior to use, each batch of the basal feed was analyzed for ochratoxin, aflatoxin, and zearalenone to ensure that the levels of each were < 1.0 μg/Kg. Mycotoxin-contaminated feeds were prepared by incorporation of known quantities of AFB1. For this purpose, fermented rice were extracted by soaking in a 3-fold quantity of chloroform (1:3) overnight and then filtered through cotton cloth. All the chloroform was then evaporated and the concentrated residues re-suspended into polyethylene glycol (PEG). This suspension was then evenly mixed in the required quantity of basal feed to prepare the experimental feeds containing the desired concentration of AFB1. Prior to being used for feeding, the AFB1 concentrations in each experimental diet were verified by HPLC.
Induction of aflatoxicosis in White Leghorn breeder hens
All of the animal experiments were conducted according to the rules and regulations of the Animal Ethics Committee, Faculty of Veterinary Science, at the University of Agriculture, Faisalabad (Pakistan). A total of 192 laying hens, free from Salmonella and Mycoplasma infections, were procured from a layer farm. Birds were acclimatized for 1 week on basal layer feed having AFB1 levels < 1.0 μg/Kg. Birds were then divided into 12 groups (A–L) with 16 birds in each, kept in the layer battery cages, and offered feed contaminated with different doses of AFB1 alone and in combination with Vitamin E for a period of 3 weeks. Group A was kept on basal feed and served as control, while Group B was offered feed supplemented with Vitamin E (100 mg/Kg). Groups C–G were offered feed containing 0.1, 0.5, 2.5, 5.0, or 10.0 mg AFB1/Kg, respectively, whereas Groups H–L were offered the same dietary levels of AFB1 along with vitamin E (100 mg/Kg). This specific single dose was selected based on its common use for breeder hens in the commercial poultry farming industry.
Forty healthy mature male WL breeders were maintained for semen collection. Semen was collected by abdominal massage method and mixed (1:1) with semen extender (Ovodyl Poultry Semen Extender; IMV, L’Aigle, France). Laying hens were inseminated on alternate days using an artificial insemination gun and straws (IMV) starting 7 days before initiation of the exposures to the test diets. Hatching eggs were then collected on a daily basis and set for incubation on a weekly basis. Prior to setting, eggs were stored at 15 °C. The progeny, which were obtained on a weekly basis, were maintained separately under standard environmental conditions, i.e. on basal layer ration verified not to contain OTA or AFB1 residues at a level >1.0 μg/Kg ration. Animal rooms were kept at 33 °C during the first week of age (and reduced by ≈2.5°C/week thereafter), a 60% relative humidity and with a 12-h light–dark cycle. All chicks had access to fresh water ad libitum.
We feel it important to note that, due to limitations on overall egg production by hens in the 3-week Groups G and L (the highest AFB1 dose), eggs (and thus, progeny) were not available for examination in some of the particular studies outlined below.
Antibody response to SRBC
A 3% suspension of sheep red blood cells (SRBC, in saline solution, prepared from freshly-collected sheep blood at the Department of Microbiology in the University of Agriculture, Faisalabad) was injected intravenously into 13-day-old chicks/group (n = 8/group); a booster dose was injected 14 days later (at 21-days of age). Blood was collected 7 and 14 days after the primary and booster doses, and the corresponding serum was separated and stored at −20 °C until analyzed for antibodies using methods described by Delhanty and Solomon (Citation1966), Yamamoto & Glick (Citation1982), and Qureshi & Havenstein (Citation1994). In this process, the serum samples were heat-inactivated at 56°C for 30 min and then analyzed for total, 2-mercaptoethanol (ME)-sensitive (IgM), and ME-resistant (IgG) anti-SRBC antibodies. The results were expressed as log2 of the reciprocal of the highest dilution exhibiting agglutination.
Lymphoproliferative response to phytohemagglutinin-P (PHA-P)
At 14 days-of-age, 10 chicks/group were injected with phytohemagglutinin (PHA-P) (MP Biomedicals, Inc., Cleveland, OH) to study the lymphoproliferative response as described by Hassan et al. (Citation2012c). For this purpose, 100 μg PHA-P (dissolved in 0.1 ml normal saline) was injected into the intra-digital space between digits 3 and 4 of the right foot. At the same time, 0.1 ml normal saline was injected into a similar site in the left foot. Skin thickness was then measured 24 and 48 h post-injection using a constant tension micrometer (Global Sources, Shanghai, China). The thickness response was then calculated and expressed (mm) as: cutaneous basophilic hypersensitivity response = (right foot skin thickness – left foot skin thickness), at each timepoint.
Preparation of peritoneal macrophages
Macrophage functions were assessed in 29-day-old chicks (n = 10/group), obtained from the hens fed mycotoxin-contaminated diets for 7, 14, or 21 days, according to the methods of Qureshi & Havenstein (Citation1994). Briefly, a pre-soaked (overnight) 3% suspension of Sephadex G-50 (Sigma, St. Louis, MO) in normal saline was injected intraperitoneally into each chick (at dose rate = 1 ml/100 g BW). At 42-h post-injection, each chick was euthanized by cervical dislocation and its abdominal cavity flushed with 30 ml hepranized saline (sterile heparin 0.5 U/ml in normal saline) to permit collection of abdominal exudate cells (AEC). The AEC sample was centrifuged at 285 × g for 10 min, and the resultant supernatant discarded. The cell pellet was re-suspended in 4 ml RPMI-1640 complete growth medium supplemented with 5% heat-inactivated fetal calf serum and antibiotic-antimycotic solution (all from PPA Laboratories GmbH, Dartmouth, MA). The total number of cells was then counted on a hemocytometer and adjusted to the levels needed for use in phagocytosis and nitrite production assays as below.
Macrophage phagocytic ability
A 1% suspension of SRBC was prepared for use as particulate antigen for the AEC. Macrophage monolayers were established by the addition of 1 × 10⁶ AEC/ml from each sample into sterile petri dishes (each dish containing three glass coverslips). After 1 h of incubation in a 5% CO2/95% air chamber, coverslips were washed to remove non-adherent cells. The remaining macrophage monolayers were then co-incubated at 41 °C in a humidified 5% CO2 atmosphere for 60 min with a 1.0 ml (3%) suspension of SRBC that was added to each dish. Any non-internalized SRBC were washed away prior to fixing the coverslips in methanol. The coverslips were then stained with Wright-Giemsa stain and mounted onto microscopic slides with DPX mounting solution (Merck-BDH, Lutterworth, UK). A total of 200 macrophages were then scored for phagocytosis and number of SRBC engulfed/macrophage. For this, coverslips were examined under a M7000DB light microscope (Swift, Tokyo, Japan) at 1000 × magnification.
Nitrite production (as index for oxidative killing)
Lipopolysaccharide (LPS, Escherichia coli O55:B5, Sigma)-induced nitrite production by the isolated abdominal macrophages was quantified as described by Green et al. (Citation1982). Macrophages (calculated number) from each chick were cultured in 24-well plates at 41 °C in a 5% CO2 atmosphere. After 1 h incubation, non-adherent cells were removed by washing with complete medium and the remaining cells were then exposed to LPS (1 μg/well) for 24 h. After this period, an aliquot (200 μl) of culture supernatant was collected from each well and each mixed with 200 μl Griess reagent (0.1% naphalethylenediamine dihydrochloride and 1% sulfanilamide in 5% phosphoric acid) in 96-well microtitre plates. The plate was incubated 15 min at 37 °C and optical density (OD) in each well then measured at 540 nm using a Biochrom microplate reader (Holliston, MA). A standard curve for the assay was generated using various dilutions of sodium nitrite solution in RPMI-1640 complete medium. Nitrite levels in the supernatant samples were extrapolated from a standard curve generated in parallel using sodium nitrite solutions of known concentration.
Assessment of RBC resistance to oxidative damage
Assessment of RBC resistance to oxidative stress was performed following Bertrand et al. (2006). Blood samples were taken from each day-old bird (from dams fed the test diets for 1, 2, or 3 weeks) to assess the resistance of their red blood cells to the oxidant 2-2’-azobis (2-amidino-propane) hydrochloride (AAPH) (Cayman Chemical Co., Ann Arbor, MI). This assay provided a quantitative measurement of overall anti-oxidant status of a chick’s whole blood as it assessed the time required to hemolyze 50% (HT50) of red blood cells in the sample when exposed to a controlled free radical attack. Briefly, 20 μl chick whole blood was immediately diluted in 730 μl modified Ringer’s solution (pH 7.4). Thereafter, 80 μl of the diluted blood was added to each well of a 96-well microplate. The microplate was kept in an incubator at 40 °C for 30 min before 136 µl of a 150 mM (646 mg AAPH in 20 ml modified Ringer’s solution) AAPH (free radical generator) was added to each well (Rojas et al., Citation1998). The microplate was subsequently read in a microplate titrator (Universal Microplate Reader ELX 800, Bio-Tek, Wisnooski, VT) maintained at 40 °C. Rate of hemolysis was determined by the change in optical density at 540 nm.
Statistical analysis
All data were subjected to analysis of variance tests. Means of the different groups were compared using a Duncan’s Multiple Range test within a MSTATC statistical package (Department of Crop and Soil Sciences, Michigan State University, East Lansing, MI). Data were considered significantly different from one another at p-values ≤ 0.05.
Results
Antibody response to SRBC
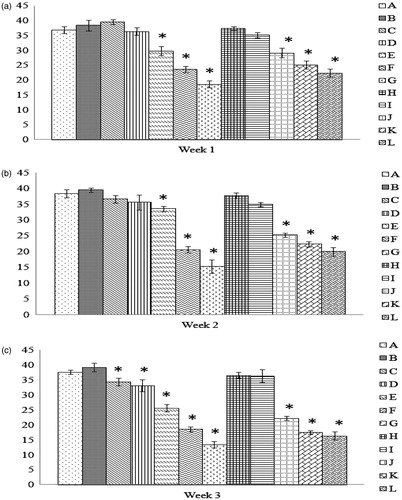
Antibody titers in progeny of hens fed AFB1 ± Vit E for 1 week are presented in . At Day 7 post-primary dosing with SRBC, total antibody titer in the sera of chicks in Groups E, F, G, I, J, K, and L were significantly lower than in counterpart Group A chicks. No significant differences in IgG titers were noted among any of the test groups. By difference, IgM titers in chicks from Groups E, F, G, I, J, K, and L were thus significantly lower than in Group A chicks. At Day 14 post-primary SRBC dose, total antibody titers were still significantly lower in Group F, G, K, and L chicks compared to control values. Interestingly, at this point, IgG titers in the chicks of hens fed a diet supplemented with Vit E only for the 1 week were higher compared to those of chicks of hens fed basal rations. At Day 7 post-booster SRBC injection, the total antibody titer in Group E, F, G, K, and L hosts were still significantly lower compared to titers in Group A chicks. With regards to IgG, a significantly lower titer (compared with Group A hosts) was noted only in the Group K chicks. At Day 14 post-booster SRBC dose, total antibody and IgG titers were significantly higher in Group A chicks compared to titers in chicks of all hens fed AFB1, except those that received the lowest dose (i.e. hens in Groups C and H). In none of the four post-SRBC injection timepoints examined did the presence of Vit E in the hens’ diet affect the toxicity imparted by the AFB1 itself on either total antibody titer or IgG titers (except at Day 14 post-booster of SRBC in Group L chicks).
Table 1. Anti-SRBC antibody titer in chicks obtained from layer breeders fed AFB1 ± Vit E-containing feeds for 1 week.
Antibody titers of progeny of hens fed the test diets for 3 weeks are shown in . At Day 7 post-primary injection of SRBC, total antibody titer in Group E and F chicks was significantly lower than those of Group A counterparts. This effect was no longer apparent by Day 14 post-primary injection. At Day 7 post-booster injection of SRBC, total antibody titers were now significantly lower in Group E, F, J, and K chicks compared to those in Group A animals. Concurrently, IgG titers were significantly lower in all of these chicks, except those in Group J. In contrast, IgM titers were now significantly lower (compared to in Group A chicks) in these Group J hosts; interestingly, these values were also lower in Group D and E chicks. At 14 days post-booster SRBC injection, total antibody titers in Group E, F, J, and K chicks were still significantly lower compared to control values. At this point, IgG titers in only Group F chicks and IgM titers in Group E chicks were significantly reduced relative to the control chick values. Due to cessation of egg production, there were no progeny in Groups G and L to test here. As in the 1 week study, at none of the four post-SRBC injection times did a presence of Vit E in the hens’ diet affect the toxicity imparted by the AFB1 itself on any of the measured endpoints.
Table 2. Anti-SRBC antibody titer in chicks obtained from layer breeders fed AFB1 ± Vit E-containing feeds for 3 week.
Lymphoproliferative response to PHA-P
The lymphoproliferative response of chicks from hens fed the various test diets was determined by intradermal administration of PHA-P into the toe web. The results revealed that, among the offspring of hens fed the test diets for 1 week, there was a significant decrease in skin thickness in chicks in all groups (except those from hens fed the lowest dose [i.e. 0.1 mg/Kg] of AFB1)—at either the 24 or 48 h timepoint—compared to the reactions evinced by chicks in Group A (). In progeny of hens fed the test feeds for 3 weeks, a significantly lower value was observed at the 24 h timepoint only among Group K chicks as compared to the value in chicks from Group A. By 48 h post-PHA-P injection, even this difference was no longer apparent. Due to limitations on overall egg production by hens in the 3-week Groups G and L (the highest AFB1 dose), eggs (and thus progeny) were not available for this particular study. In none of these studies did the addition of Vit E to the hen diet significantly impact the toxicity from AFB1 on the measured endpoints. (Note: Statistical comparisons among all the groups can be found in Supplemental Table 1.)
Figure 1. Lymphoproliferative response against phytohemagglutinin (PHA-P) in chicks from hens fed the test feeds for 1 or 3 weeks. At 14 days-of-age, 10 chicks/group were injected with PHA-P (100 μg PHA-P in 0.1 ml normal saline) into the intra-digital space between digits 3 and 4 of the right foot; 0.1 ml normal saline was injected similarly in the left foot. Skin thickness was then measured 24- and 48-h post-injection. The thickness response was then calculated and expressed (mm) as: cutaneous basophilic hypersensitivity response = (right foot skin thickness – left foot skin thickness), at each time-point. Dam on diets for (a) 1 week and (b) 3 weeks. Values shown are mean ( ± SD); n = 10/group. All groups (A–L) were fed the diets containing various amounts of AFB1 in the presence/absence of Vit E; specific exposure levels for each group are indicated in tables in this paper. Values significantly different from control (Group A chicks) values at *p ≤ 0.05 are indicated. Note: Due to limitations on overall egg production by hens in the 3-week Groups G and L, eggs (and thus progeny) were not available for this particular study.
Macrophage function assays
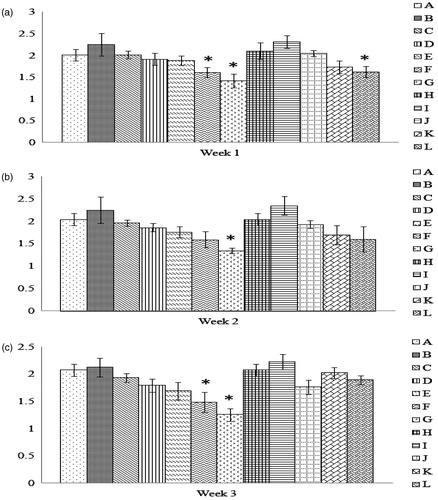
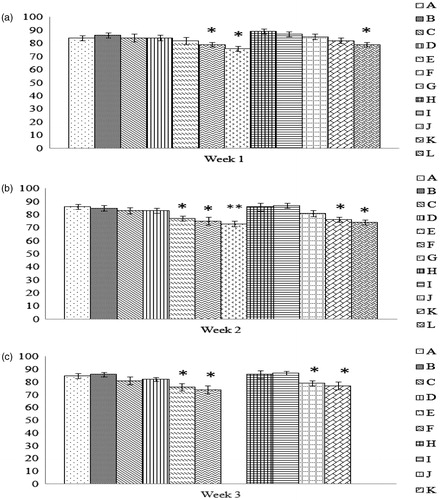
Compared to the cells from Group A chicks, phagocytic potential was significantly decreased among peritoneal macrophages from the Groups E, F, G, J, K, and L progeny of hens fed the test diets for 1 week (); the same effects (except for among Group E chicks) were also evident after the hens had eaten the diets for 2 weeks. When the feeding period was extended to 3 weeks, the progeny of hens fed a dose of AFB1 that had previously not significantly impacted this parameter (i.e. 0.5 mg/Kg) were now affected. The protective effect of Vit E was not observed in any experimental group except Group L, and even here this effect (i.e. a rebound in phagocytic activity) was lost if the hens had consumed the highest dose of AFB1 (i.e. 10 mg/Kg) for 3 weeks. We must note that, among the progeny of hens fed the test diets for 2 weeks, a significant effect from Vit E was noted in chicks in Group J; however, this effect was a worsening of phagocytic activity by the isolated macrophages and was never apparent in either the 1- or 3-week diet feedings. (Note: Statistical comparisons among all the groups can be found in Supplemental Table 2.)
Figure 2. Phagocytic activity of peritoneal macrophages recovered from chicks of hens fed AFB1 ± Vit E for 1, 2, or 3 weeks. At 29 days-of-age, peritoneal macrophages were isolated from the chicks (n = 10/group). The cells were then cultured for 1 h to permit adherence and subsequently provided SRBC to engulf in a 1-h period. The cells were then stained and a total of 200 macrophages/chick scored for phagocytosis and number of SRBC engulfed/macrophage. Dam on diets for (a) 1 week, (b) 2 weeks, and (c) 3 weeks. Values shown are mean percentage (%) of phagocytically-active cells present (±SD); n = 10/group. All groups (A–L) were fed the diets containing various amounts of AFB1 in the presence/absence of Vit E; specific exposure levels for each group are indicated in tables in this paper. Values significantly different from control (Group A chicks) values at *p ≤ 0.05 are indicated.
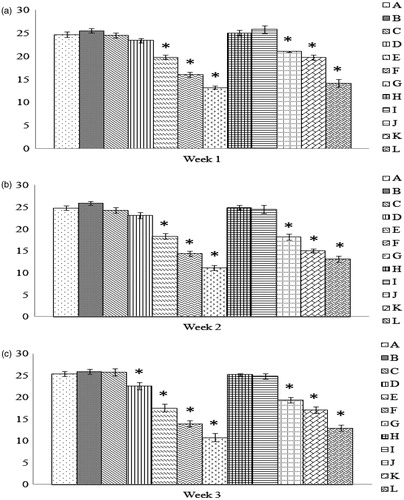
With respect to values of phagocytic index (i.e. number of SRBC engulfed/macrophage), only cells from chicks in Groups G—those from hens that consumed the highest amount of AFB1 for 1, 2, or 3 weeks—were significantly reduced relative to the control chick values (). A cumulative effect from length of feeding was only evident among progeny of hens fed the second-highest AFB1 dose (Group F; 3 weeks of 5 mg/Kg). Any protective effect of incorporation of Vit E into the diet was only noted in progeny of hens fed the 10 mg AFB1/Kg feed for 3 weeks. (Note: Statistical comparisons among all the groups can be found in Supplemental Table 3.)
Figure 3. Number of SRBC engulfed/macrophage obtained from progeny chicks of hens fed AFB1 ± Vit E for 1, 2, or 3 weeks. Cells were prepared and treated as outlined in the legend for . Dam on diets for (a) 1 week, (b) 2 weeks, and (c) 3 weeks. Values shown are mean number of SRBC engulfed per phagocytically-active cell (±SD); n = 10/group. All groups (A–L) were fed the diets containing various amounts of AFB1 in the presence/absence of Vit E; specific exposure levels for each group are indicated in tables in this paper. Values significantly different from control (Group A chicks) values at *p ≤ 0.05 are indicated.
It is interesting to note that, unlike with the two above parameters, significant effects on the function of nitrite/NO production by macrophages isolated from progeny of hens exposed to AFB1 was now evident at some of the lower doses tested (i.e. 2.5 mg/Kg) even after just 1 week of diet intake (). This reduction in activity effect was even more evident as the exposure period progressed (i.e. Group D; 3 weeks of 0.5 mg/Kg). It is also interesting to note that this was also the first time in these studies that there was clear-cut evidence of a dose–response pattern. Any mitigating/protective effect from a presence of Vit E in the hens’ diets was moreover non-specific; however, among the various progeny groups, it seemed that any Vit E effect was apparent primarily among progeny of hens that consumed the highest AFB1 doses (and hence Vit E) for increasing periods of time. (Note: Statistical comparisons among all the groups can be found in Supplemental Table 4.)
Figure 4. LPS-induced nitrite production by peritoneal macrophages recovered from chicks of hens fed AFB1 ± Vit E for 1, 2, or 3 weeks. Cells were prepared for culture as outlined in the legend for . Lipopolysaccharide (LPS, 1 μg/well) was then added to each well to induce nitrite production over a 24-h period. Culture supernatants were then collected and assessed for nitrite using Griess reagent. Dam on diets for (a) 1 week, (b) 2 weeks, and (c) 3 weeks. Values shown are mean µM nitrite/chick cell culture (±SD); n = 10/group. All groups (A–L) were fed the diets containing various amounts of AFB1 in the presence/absence of Vit E; specific exposure levels for each group are indicated in tables in this paper. Values significantly different from control (Group A chicks) values at *p ≤ 0.05 are indicated.
Assessment of oxidative stress
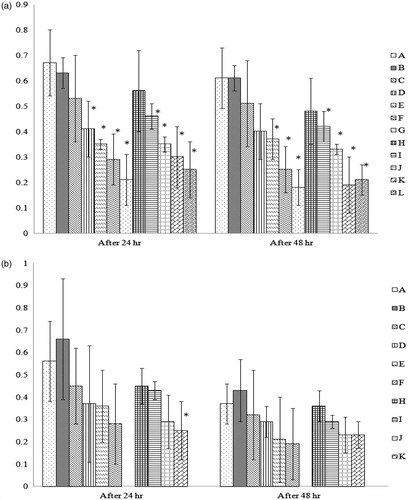
Among the progenies of hens fed the test feeds for 1 week, only the highest dose of AFB1 led to significantly reduced values for rates of hemolysis relative to values for the control chicks. Group F and G chicks had significantly lower rates of hemolysis values compared with control chicks (). The average time for 50% hemolysis of the RBC from these hosts was 79 ± 5 (SD) and 76 ± 2 min, respectively. Both sets of controls (i.e. chicks of hens fed no exogenous chemicals or of hens fed diet containing only Vit E supplement) had values of 84 ± 1 min and 86 ± 5 min, respectively. In all groups, the addition of Vit E to the hen diet led to increases (albeit slight) in these values; only in the case of chicks from hens that received the 5.0 mg AFB1/Kg diet was the outcome improved to the point that the rate value was no longer significantly different from that of control chicks.
Figure 5. Comparison of rate of hemolysis values. Values shown are for the tim-epoint at which 50% hemolysis was observed using a free radical generator AAPH. All values shown are with RBC obtained from progenies of breeder hens fed AFB1 ± Vit E for (a) 1 week, (b) 2 weeks, or (c) 3 weeks. Values shown are mean ± SD; n = 8/group. All groups (A–L) were fed the diets containing various amounts of AFB1 in the presence/absence of Vit E; specific exposure levels associated with each group are indicated in each table in this paper. Values significantly different from control (Group A chicks) values at *p ≤ 0.05 or **p ≤ 0.01 are indicated. Note: Due to limitations on overall egg production by hens in the 3-week Groups G and L, eggs (and thus progeny) were not available for this particular study.
Among progeny of hens that ate the feeds for 2 weeks, values of rate of hemolysis in RBC of chicks from Groups E, F, G, K, and L were each significantly lower than of corresponding controls. In this timeline, the amelioration seen by addition of Vit E to the diet of hens fed the 5.0 mg AFB1/Kg diet was no longer apparent. Furthermore, any impact of the Vit E on the values seen compared to that of counterpart progeny of chicks that had received of AFB1 alone was now only apparent at the AFB1 lower doses.
Lastly, for the progeny of hens that ate the treated feeds for 3 weeks, rates of hemolysis for the RBC of chicks in Groups E, F, and K were again all significantly lower than those of the corresponding control chicks. Note, due to limitations on overall egg production by hens in the 3-week Groups G and L (the highest AFB1 dose), eggs (and thus progeny) were not available for this particular study. As with both other timelines tested, any protective effect of Vit E feeding against AFB1 toxicity was again non-significant and, as with the 2-week study, any real improvement from the values seen in chicks of hens that received AFB1 alone was apparently relegated to the lower doses of toxin tested.
Discussion
Aflatoxin B1, upon metabolism in the body, is activated to AFB1-8,9-exo-epoxide that, in turn, can form adducts with DNA at the N7 position of guanine (Groopman et al., Citation1996), thereby reducing protein biosynthesis of any gene which may have been modified. The noted decline in anti-SRBC antibody biosynthesis in the progeny chicks might be due to one such AFB1-associated arrest. Unlike other types of vitamins (i.e. A and C), a role for Vit E in reducing AFB1-DNA complex formation is not apparent (Yu et al., Citation1994). This would suggest that it would likely be a poor ameliorative response in the chicks of hens fed Vit E along with AFB1. This expectation appears to have been borne out in the studies here analyzing chick lymphoproliferative responses to PHA-P, as well as ex vivo phagocytic activity (index and capacity) and ability to produce nitrite (in response to stimulation with LPS) by their peritoneal macrophages. Any protective effect of Vit E when noted was sporadic among the differing groups of chicks from hens given AFB1 and Vit E concurrently for various periods of time.
A suppression of cell-mediated immunity associated with AFB1 feeding has been widely reported in various avian and mammalian species (Giambrone et al., Citation1978). In the present study, the noted decrease in macrophage functions would seem to be associated with maternal transfer of AFB1 (or its metabolites) to the eggs. This would, in turn, likely affect the differentiation and maturation process of the immature progenitor cells responsible for the development of various cell lines, including macrophages, in the chicks. This concept in chicks is supported by findings of Qureshi et al. (Citation1998) and Nicolas-Bolnet et al. (Citation1995).
It is known that concurrent administration of Vit E and AFB1 results in the metabolism of AFB1 being reduced (Emerole et al., Citation1984). Apart from this potentially mitigating metabolite transfer to eggs/progeny, the presence of Vit E would also be expected to reduce AFB1-related radical formation (Ibeh & Saxena, Citation1998) in the hens or the developing offspring. However, in the present study, addition of Vit E in the contaminated feed was unable to protect against oxidative damage in RBC in the progeny chicks. That the chicks were not consuming the Vit E indicates that any protective effect from maternal consumption of the vitamin was not persistent and/or transferrable. This would differ from earlier findings of Vit E-associated decreases in the abundance/activity of biomarkers of oxidative damage in cells from individuals co-exposed to Vit E and AFB1 (Alpsoy et al., Citation2009).
In previous studies, we demonstrated immune dysfunction in chicks fed AFB1 and chicks hatched from eggs exposed directly to AFB1 (Neldon-Ortiz & Qureshi, Citation1992; Sur & Celik, Citation2003). A single study also reported the immune dysfunction in progeny chicks of hens maintained on AFB1-contaminated feeds. The current study examined exposure of the developing embryos to AFB1 alone and/or concurrently with Vit E via dietary exposure by their dams. The findings that maternal transfer of AFB1 (and/or its metabolites) to the eggs alters the subsequent immunity of the chicks, implies that chicks obtained from AF-intoxicated dams would likely be more susceptible to disease challenge. One outcome of this might be a higher rate of early chick mortality in the commercial poultry production. Our attempt to minimize this potential damage by adding Vit E in the feed of breeder hens provided only a partial protection. Thus, alternative mitigation steps (apart from assuring that there is little AF in the feed-stocks to begin with) are still needed. This could also include the potential use of higher levels of Vit E in the test diets; such studies are currently underway.
Conclusions
The studies performed here clearly showed that the immune systems of progeny chicks were adversely impacted by dam hen exposure to increasing levels of AFB1 or by increased intake (i.e. increasing overall intake over time at any fixed dose) in their feed. No consistent ameliorative effects against the toxicities from the AFB1 as a result of co-consumption of Vit E were noted however, i.e. effects seen against lower AFB1 doses were no longer apparent with the higher doses of AFB1. For now it can be concluded that, with this particular single dose level of Vit E, AFB1-associated immunotoxic effects in progeny chicks can potentially be ameliorated by dietary intake of Vit E by their hen dams. However, this is clearly an outcome that is driven by the level of the mycotoxin present in the feed. Future studies need to examine what impact higher Vit E doses than those employed herein might have in these ameliorative outcomes.
Declaration of interest
The authors report no conflicts of interest. The authors alone are responsible for the content and writing of the paper.
Acknowledgments
The authors highly acknowledge the financial support of the Higher Education Commission of Pakistan.
References
- Agag, B. I. 2004. Mycotoxins in foods and feeds: Aflatoxins. Ass. Univ. Bull. Environ. Res. 7:173–205
- Ahmad, M. F., Saleemi, M. K., Khan, M. Z., et al. 2012. Effects of Ochratoxin A feeding in White Leghorn cockerels on hematological and serum biochemical parameters and its amelioration with silymarin and vitamin E. Pak. Vet. J. 32:520–524
- Alpsoy, L., Yildirin, A., and Agar, G. 2009. The anti-oxidant effects of Vitamin A, C, and E on aflatoxin B1-induced oxidative stress in human lymphocytes. Toxicol. Ind. Health. 25:121–127
- A.O.A.C. (Association of Official Analytical Chemist). 2000. Official method of analysis. No. 990.33: Natural Toxins. 17th Edition. Gaithersburg, MD: Association of Official Analytical Chemist, pp. 20–22
- Bertrand, S., Alonso-Alvarez, C., Devevey, G., et al. 2006. Carotenoids modulate the trade-off between egg production and resistance to oxidative stress in zebra finches. Oecologia. 147:576–584
- Binder, E. M., Tan, L. M., Chin, L. J., et al. 2007. Worldwide occurrence of mycotoxins in commodities, feeds and feed ingredients. Animal Feed Sci. Technol. 137:265–282
- Choi, Y. K., Jung, K. K., Chae, K. Y., et al. 1995. Effects of Vitamin E and selenium supplementation to diets containing aflatoxin B1 on the contents of liver lipids and various blood parameters in rats. Asian-Austral. J. Animal Sci. 8:379–385
- Dean, J. H., Luster, M. I., and Boorman, G. A. 1982a. Methods and approaches for assessing immunotoxicity: An overview. Environ. Health Perspect. 43:27–29
- Dean, J. H., Luster, M. I., Boorman, G. A., et al. 1982b. Procedures available to examine the immunotoxicity of chemicals and drugs. Pharmacol. Rev. 34:137–148
- Delhanty, J. J., and Solomon, J. B. 1966. The nature of antibodies to goat erythrocytes in the developing chicken. Immunology. 11:103–113
- Emerole, G. O., Thabrew, M. I., and Kwanashie, H. O. 1984. Effect of dietary Vitamin E (α-tocopherol) on aflatoxin B metabolism. Eur. J. Drug Metab. Pharmacokinet. 9:295–300
- Giambrone, J. J., Ewert, D. L., Wyatt, R. D., and Eidson, C. S. 1978. Effect of aflatoxin on the humoral and cell-mediated immune systems of the chicken. Am. J. Vet. Res. 39:305–308
- Grasman, K. A. 2002. Assessing immunological function in toxicological studies of avian wild-life. Integr. Comp. Biol. 42:34–42
- Grasman, K. A. 2010. In vivo functional tests for assessing immunotoxicity in birds. Immunotox. Testing Meth. Mol. Biol. 598:387–398
- Green, L. C., Wagner, D. A., Glogowski, J., et al. 1982. Analysis of nitrate, nitrite, and (15N)-nitrite in biological fluid. Anal. Biochem. 126:131–138
- Groopman, J. D., Scholl, P., and Wang, J. S. 1996. Epidemiology of human aflatoxin and their relationship to liver cancer. Prog. Clin. Biol. Res. 395:211–222
- Hassan, Z. U., Khan, M. Z., Khan, A., et al. 2012a. Effects of individual and combined administration of ochratoxin A and aflatoxin B1 in tissues and eggs of White Leghorn breeder hens. J. Sci. Food Agric. 92:1540–1544
- Hassan, Z. U., Khan, M. Z., Khan, A., et al. 2012b. Ochratoxicosis in White Leghorn breeder hens: Production and breeding performance. Pak. Vet. J. 32:557–561
- Hassan, Z. U., Khan, M. Z., Saleemi, M. K., et al. 2012c. Immunological responses of male White Leghorn chicks kept on ochratoxin A (OTA)-contaminated feed. J. Immunotoxicol. 9:56–63
- Hussain, Z., Khan, M. Z., and Hassan, Z. U. 2008. Production of aflatoxins from Aspergillus flavus and acute aflatoxicosis in young broiler chicks. Pak. J. Agri. Sci. 45:95–102
- Ibeh, I. N., and Saxena, D. K. 1998. Effect of alpha-tocopherol supplementation on the impact of aflatoxin B1 on the testis of rats. Exp. Toxicol. Pathol. 50:221–224
- Kadian, S. K., Monga, D. P., and Goel, M. C. 1988. Effect of aflatoxin B1 on the delayed-type hypersensitivity and phagocytic activity of reticuloendothelial system in chickens. Mycopathologia. 104:33–36
- Khan, W. A., Khan, M. Z., Khan, A., and Hussain, I. 2010. Pathological effects of aflatoxin and their amelioration by Vitamin E in White Leghorn layers. Pak. Vet. J. 30:155–162
- Luster, M. I., Ackermann, M. F., Germolec, D. R., and Rosenthal, G. J. 1989. Perturbations of the immune system by xenobiotics. Environ. Health Perspect. 81:157–162
- Meluzzi, A., Sirri, F., Manfreda, G., et al. 2000. Effects of dietary Vitamin E on the quality of table eggs enriched with n-3 long-chain fatty acids. Poult. Sci. 79:539–545
- Micco, C., Miraglia, M., Benelli, L., et al. 1988. Long term administration of low doses of mycotoxins in poultry. 2. Residues of ochratoxin A and aflatoxins in broilers and laying hens after combined administration of ochratoxin A and aflatoxin B1. Food Addit. Contam. 5:309–314
- Mori, A. V., Mendonc, C. X Jr., Almeida, C. R., and Pita, M. C. 2003. Supplementing hen diets with Vitamins A and E affects egg yolk retinol and α-tocopherol levels. J. Appl. Poult. Res. 12:106–114
- Mubarak, A., Rashid, A., Khan, I. A., and Hussain, A. 2009. Effect of Vitamin E and selenium as immunomodulators on induced aflatoxicosis in broiler birds. Pak. J. Life Soc. Sci.7:31–34
- Neldon-Ortiz, D. L., and Qureshi, M. A. 1992. Effects of aflatoxin B1 embryonic exposure on chicken mononuclear phagocytic functions. Develop. Comp. Immunol. 16:187–196
- Nicolas-Bolnet, C., Qureshi, M. A., Cieszynski, J. A., and Taylor, R. L. Jr. 1995. Avian hematopoiesis in response to avian cytokines. Poult. Sci. 74:1970–1976
- Otim, M. O., Mukiibi-Muka, G., Christensen, H., and Bisgaard, M. 2005. Aflatoxicosis, infectious bursal disease and immune response to Newcastle disease vaccination in rural chickens. Avian Pathol. 34:319–323
- Potchinsky, M. B., and Bloom, S. E. 1993. Selective AFB1-induced sister chromatid exchanges and cytotoxicity in differentiating B- and T-lymphocytes in vivo. Environ. Mol. Mutagen. 21:87–94
- Qureshi, M. A., and Havenstein, G. B. 1994. A comparison of immune performance of a 1991 commercial broiler with a 1957 random-bred strain when fed “typical” 1957 and 1991 broiler diets. Poult. Sci. 73:1805–1812
- Qureshi, M. A., Brake, J., Hamilton, P. B., et al. 1998. Dietary exposure of broiler breeders to aflatoxin results in immune dysfunction in progeny chicks. Poult. Sci. 77:812–819
- Rojas, W. R. U., Zeng, L., Madison, S. A., et al. 1998. Mechanistic studies on the decomposition of water-soluble azo-radical-initiators. J. Chem. Soc. Perkin. Trans. 2:2009–2018
- Saleemi, M. K., Khan, M. Z., Khan, A., et al. 2012. Molecular identification of black Aspergilli isolated from poultry feeds by sequencing of ITS-region. Pak. Vet. J. 32:71–174
- Shotwell, O. L., Hesseltine, C. W., Stubblefield, R. D., and Sorenson, W. G. 1966. Production of aflatoxin on rice. Appl. Microbiol.14:425–428
- Streit, E., Schatzmayr, G., Tassis, P., et al. 2012. Current situation of mycotoxin contamination and co-occurrence in animal feed - Focus on Europe. Toxins. 4:788–809
- Sur, E., and Celik, I. 2003. Effects of aflatoxin B1 on the development of the bursa of Fabricius and blood lymphocyte acid phosphatase of the chicken. Brit. Poult. Sci. 44:558–566
- Todd, L. A., and Bloom, S. E. 1980. Differential induction of sister chromatid exchanges by indirect-acting mutagen-carcinogens at early and late stages of embryonic development. Environ. Mutagen. 2:435–445
- Verma, R. J., and Nair, A. 2001. Ameliorative effect of Vitamin E on aflatoxin-induced lipid peroxidation in the testis of mice. Asian J. Androl. 3:217–221
- Wogan, G. N. 1973. Aflatoxin carcinogens. In: Methods in Cancer Research. (Bush, H., Ed.). New York: Academic Press, pp. 309–345
- Yamamoto, Y., and Glick, B. 1982. A comparison of the immune response between two lines of chickens selected for differences in the weight of the bursa of Fabricius. Poult. Sci. 61:2129–2132
- Yu, M. W., Zhang, Y., William, M. D., et al. 1994. Influence of Vitamins A, C, and E and carotene on aflatoxin B1 binding to DNA in woodchuck hepatocytes. Cancer. 73:596–604
- Zaki, M. M., El-Midany, S. A., Shaheen, H. M., and Rizzi, L. 2012. Mycotoxins in animals: Occurrence, effects, prevention and management. J. Toxicol. Environ. Health. 4:13–28