
Abstract
The classification of food allergens based on the structure and function of proteins contributes to the study of the relationship between bioinformatics and potential allergenicity of allergens. Food allergens always share sequence similarity with the allergens in the same allergen families. For that reason, food proteins from different allergen families may induce different patterns of immune responses in animal models. Female Balb/c mice (3–4-weeks-old) were sensitized with food proteins once per week for 4 weeks, and then challenged 2 weeks later (on Day 42 of study). Blood was collected (to obtain serum levels of histamine and protein-specific IgG1 and IgE antibodies) and measures of vascular permeability were performed 20 min after the challenge. Five food proteins (11S globulin, OVA [ovalbumin], HAS [human serum albumin] and LRP [lysine-responsive storage protein] of different allergen families, and Cry 1Ab/Ac [crystal protein]) were used to assess patterns of immune responses for each allergen family and then bioinformatics and digestive stability in simulated gastric fluid were employed to assess the overall utility of the Balb/c. The assay results indicated that, in this model, histamine and protein-specific IgE antibody levels and vascular permeability could be used to identify allergenicity of 11S globulin, OVA, and PAP (potato acid phosphatase) only. However, the results of the protein-specific IgG1 measures could only distinguish allergic food proteins with negative control. Based on bioinformatic analyses, the five different food proteins clearly induced distinct patterns of immune responses in the Balb/c model.
Introduction
Food allergy is a serious and apparently growing problem worldwide. The results of epidemiology surveys indicate that up to 6% of young children and 3–4% of adults suffer from food allergy (Wang & Sampson, Citation2011). Food-induced allergic reactions may be responsible for different clinical symptoms that can be characterized by mild urticaria, diarrhea, or anaphylactic shock. Food allergy is an important manifestation of Type I allergic reaction mediated primarily by immunoglobulin E (IgE). Specific IgE can be induced by ingesting food allergens and binding of these allergens by specific IgE on effector cells, such as basophils and mast cells, leads to mediator release (i.e., histamine), and a subsequent cascade of pathologic event. Currently, food allergens are classified into plant and animal types, and >500 have been identified to date.
Bioinformatic analyses are widely used to evaluate the potential allergenicity of protein. Also, it is recommended by FAO/WHO for assessing the allergenicity of exogenous proteins (FAO/WHO, Citation2003). The principle of bioinformatic analysis is a contrasting of the amino acid sequences in test proteins with known allergens that are in the database. Simulated gastric digestion (SGF) is another approach recommended by the FAO/WHO in their guideline for the assessment of potential allergenicity of exogenous proteins (FAO/WHO, Citation2003). Previous studies have suggested that proteins that can induce anaphylaxis possess a characteristic of digestion-stability (Bowman & Selgrade, 2008).
Animal models have been increasingly used for the assessment of allergenicity of food proteins in the last decade. Studies of classifications of food allergens have shown that food allergens from the same family always have similarity in structures or functions (Jenkins et al., Citation2005, Citation2007). As such, differences of structures or functions among proteins may lead to different patterns of immune response in an exposed host. In this study, we attempted to establish the utility of a Balb/c mouse model to evaluate the allergenicity of differing food proteins. In addition, this model was used to investigate if there were also different patterns of immune responses induced by food proteins from diverse allergen families.
Materials and methods
Preparation of food proteins
OVA (ovalbumin, Grade VI) and PAP (potato acid phosphatase) were purchased from Sigma-Aldrich (St. Louis, MO). 11S globulin (Gly m 6) was extracted from de-fatted soybean meal that was extracted in 0.02 M phosphate-buffered saline (PBS [pH 8.5]; soybean meal:PBS = 1:16 [w/v]) for 45 min at 40 °C. After centrifugation (2000 × g, 10 min), the supernatant was collected, adjusted to pH 6.2, and placed in an ice bath for 12 h. The extract was then centrifuged at 2000 × g (10 min) and precipitates bearing 11S globulin collected. The recombinant HSA (human serum albumin), LRP (lysine-responsive storage protein), and Cry 1Ab/Ac (crystal protein) were produced by our laboratory (as outlined in Cao et al., Citation2009) and had been expressed in BL21 E. Coli (TianGen, Beijing, China) and purified from a His Trap™ FF gel column (Amersham Biosciences, Uppsala, Sweden).
Classification of food allergens
AllFam (http://www.meduniwien.ac.at/allergens/allfam/) is based on an Allergome database that is the currently most comprehensive collection of allergen data. The list of 528 food allergens (including the isoallergens) is gained from SDAP (http://fermi.utmb.edu/SDAP/index.html). Pfam ID of the allergen is also obtained from the database in SDAP. With the shared Pfam ID as a standard, allergens in the same family could be identified and retrieved from AllFam. The method of classification described above was applied to obtain the allergen family to which OVA, 11S glycinin, HSA, LRP, and Cry 1Ab/Ac belong.
Digestive stability in simulated gastric fluid
Simulated gastric fluid (SGF) was prepared as follows: 0.2 g NaCl and 62.4 mg pepsin (4220 U/mg; Sigma) in 70 ml distilled water had its pH adjusted to 1.2 with HCl, and then the mixture volume was brought to 100 ml with distilled water. For the digestive analyses, the mixing ratio of test protein:SGF was 1:19 (v/v). Upon introduction of the test protein (at 5 mg/ml), the reaction was allowed to proceed at 37 °C for 15 s, 2 min, 30 min, and 60 min, at which time the reaction was stopped by addition of 70 μl 0.2 M NaHCO3. The resulting products in the samples then underwent SDS-PAGE analyses.
Animals
Balb/c (female, 3–4-week-old) mice were purchased from Vital River (Beijing, China) and then allowed to acclimate to their new housing for 1 week before beginning experimental protocols. Mice were housed under specific pathogen-free conditions (23–26 °C, 40–70% relative humidity, and 12-h light/dark cycle) with ad libitum access to standard rodent diet (free of any of test proteins as guaranteed by the manufacturer) and filtered water during the course of the study. The Beijing Municipal Science and Technology Commission of China (NO. SYXK 2010-0036) approved all of the animal studies described herein.
Sensitization and challenge protocols
Mice of each group (n = 8) received a dose (by gavage) of 1 mg test protein in 100 μl saline once per week for 4 consecutive weeks. Retro-orbital plexus blood samples were obtained at Day 0 and at the end of each week, and processed for sera/plasma (see below). After this induction period, the mice were not exposed to protein for 2 weeks. On Day 42 of the study, all sensitized animals were orally challenged with 10 mg protein. Negative control mice were treated with the same volume of saline. Blood was then drawn from the retro-orbital plexus of each mouse 20 min after the challenge. To obtain plasma, some of the blood was placed into tubes containing EDTA-K2. To obtain serum, blood was placed into other tubes and allowed to clot for 1 h at room temperature. In all cases, the blood samples were centrifuged at 3000 × g (10 min, 4 °C) to obtain plasma for histamine measures or sera for use in antibody analyses. Individual serum and plasma samples were then stored at −20 °C until analysis.
At 40 min after the challenge, each mouse was euthanized (by overdose with chloral hydrate) and then intraperitoneally injected with 3 ml of PBS (containing 10 mM EDTA). After gently massaging the abdomen, peritoneal lavage (PL) fluid was slowly aspirated. The aspirate was centrifuged at 600 × g for 6 min at 4 °C and the supernatant was collected and frozen at −70 °C until analyzed (Sun et al., Citation2007).
Determination of protein-specific IgG1 and IgE levels
Protein-specific IgG1 and IgE antibodies were detected using an indirect enzyme-linked immunosorbent assay (ELISA). Briefly, 96-well microtitre plates (Costar, Corning, NY) were coated with 10 mg given test protein/L 0.05 M sodium carbonate buffer (pH 9.6) and incubated at 4 °C. After blocking the wells with PBS/0.3% BSA, serum samples were applied to dedicated wells and IgE binding was detected using biotin-conjugated rat anti-mouse IgE antibodies (Abcam, Cambridge, MA; diluted 1:2000) followed by detector horseradish peroxidase (HRP)-conjugated streptavidin (Thermo Scientific, Waltham, MA; diluted 1:4000). For detection of IgG1, HRP-conjugated rat anti-mouse IgG1 (eBioscience, San Diego, CA; diluted 1:2000) was used. For detection in both scenarios, after washing away unbound detector or primary, 100 μl TMB (tetramethylbenzidine; KPL, Gaithersburg, MD) was added for 10 min and the reaction was stopped by 50 μl of 2 M H2SO4. The titres of protein-specific antibodies were then estimated as described previously in Sun et al. (Citation2013).
Determination of histamine levels
Plasma histamine levels were determined using a mouse Histamine (HIS) ELISA Kit (Cusabio Biotech, Wuhan, China), according to the manufacturer’s instructions. The sensitivity of the kit was 7.8 pg/ml.
Vascular leakage
Vascular leakage was determined by measuring albumin levels in the PL fluid 40 min after challenge as described previously. Albumin content was quantified in cell-free supernatants using a Bicinchoninic Acid kit (Biomega, San Diego, CA). Albumin concentration in each sample was calculated by extrapolation from a BSA standard curve prepared and analyzed in parallel.
Statistical analysis
Analyses of significant differences between the data were conducted using the Dunnett test and a two-tailed Student’s t-test in the Statistical Product and Service Solutions (SPSS 17.0, Chicago, IL) software package. Differences were considered significant at p values ≤0.05.
Results
Classification of food allergens
A total of 456 of the 528 food allergens listed in SDAP belonged to corresponding allergen families in AllFam. Furthermore, 60% of the 456 belonged to five allergen families, e.g. the Prolamin superfamily, EF hand domain, Cupin superfamily, Profilin, and Bet v 1-related proteins. Twenty-eight allergen families contained fewer than three food allergens, and made up 60% of all the food allergen families. This suggested to us that most of the food allergens could be categorized into main food allergen families, an analysis consistent with results of an analysis by Mills et al. (Citation2004).
Bioinformatics analysis and classification of the test food proteins
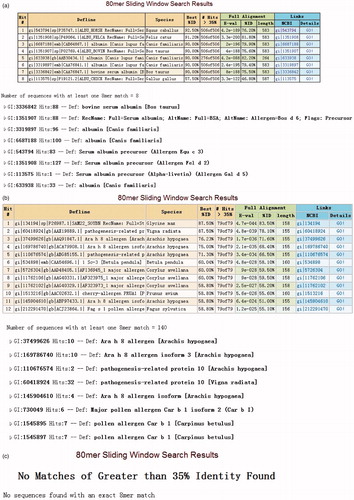
From the searches of the AllFam database, it was determined that OVA and 11S globulin belonged to the Serpin serine protease inhibitor and Cupin superfamily, respectively. The sequences of LRP, HAS, and Cry 1Ab/Ac were searched in the Allergen Online database (http://www.allergenonline.org/). The results of those analyses indicated that HSA was homologous with Bos d 6 (), which belongs to serum albumin, and that LRP shared a homology with Gly m 4 (), which belongs to Bet v 1-related protein. The result of Cry 1 Ab/Ac suggested it was not a potential food allergen ().
Figure 1. Results of FASTA for HSA, LRP, Cry 1Ab/Ac using Allergen Online. (a) HSA, homologous with Bos d 6. (b) LRP, which shares homology with Gly m 4. (c) Cry 1Ab/Ac, that is not a potential food allergen. The results indicate HSA and LRP may have potential allergenicity.
Serpin serine protease inhibitor is a cross-food allergen family, which covers both plant and animal food allergens. Most allergens in this family share a multi-domain fold containing a bundle of eight or nine α-helices and a β-sandwich formed by three β-sheets. The Cupin superfamily includes 24 food allergens and 26 isoallergens. Most allergens are from legumes, nuts, and seeds (Mills et al., Citation2004). These proteins share two short conserved consensus sequence motifs and a β-barrel structure (Dunwell, Citation1998). The members of this family mainly belong to seed storage globulins that can be divided into two sub-families, i.e. 7/8S vicilins and mature 11S legumins.
Bet v 1-related protein includes 18 food allergens and 44 isoallergens, most of which are widely distributed among vascular plants, such as members of the genus Rosaceae (apples, pears, stone fruits), Apiaceae (celery, carrots), and Fabaceae (soybeans, peanuts). Allergens from this group are formed by seven anti-parallel β-strands and three α-helices. Besides, they also share a C-terminal amphipathic helical motif, which consists of a helix (Ivanciuc et al., Citation2009). This family is classified by sequence similarity into three sub-families: pathogenesis-related (PR)-10, Bet v 1 major allergen, and ripening-related (RRP) proteins (Ivanciuc et al., Citation2009). PR-10 includes a majority of allergens in those three sub-families (Wen et al., Citation1997). Bet v 1 is the major birch pollen allergen. Many patients with pollen allergy are also allergic to vegetable and fruit, which suggests plant food allergens have IgE cross-reactivity with Bet v 1 (Vieths et al., Citation2002).
Lastly, allergens like serum albumin can induce anaphylaxis by inhalation as well as by ingestion (Spitzauer, Citation1999). Bos d 6 is capable of sensitizing by inhalation or by ingestion of beef or cow milk (Restani et al., Citation2004).
Kinetics of protein digestion by pepsin
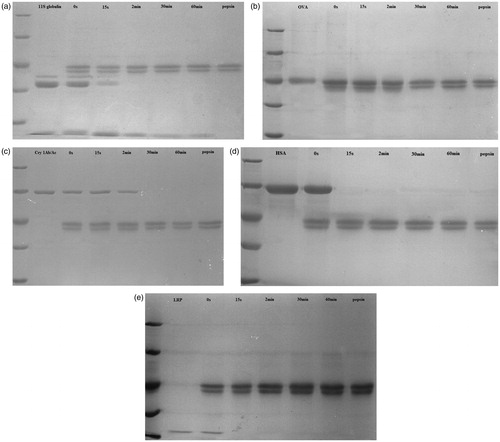
The results of the pepsin digestion studies showed that, with 11S globulin (composed of A [acid] and B [basic] sub-units), the A sub-unit was digested in the period between 2–30 min, whereas the B sub-unit resisted digestion up to 60 min (). In contrast, OVA () and Cry 1Ab/Ac () were completely digested between 2–30 min, suggesting that each had weak digestion stability. The results of HSA and LRP digestion assays indicated that each could be pepsinized rapidly () and thus each was not digestion-stable.
Figure 2. Results of digestion (i.e. SGF) assays with 11S globulin, OVA, Cry 1Ab/Ac, HAS, or LRP. Marker represents 116 kD, 66.2 kD, 45 kD, 35 kD, and 25 kD, respectively. (a) 11S globulin, whose B sub-unit can resist digestion until 60 min. (b) OVA, and (c) Cry 1Ab/Ac, each was completely digested after 2 min. (d) HSA and (e) LRP, which were pepsinized rapidly. The results indicate that 11S globulin has a digestion-stable sub-unit. OVA and Cry 1Ab/Ac can be completely digested between 2–30 min, while HSA and LRP are digested within 15 s.
The mouse model distinguishes different allergenicities of food proteins
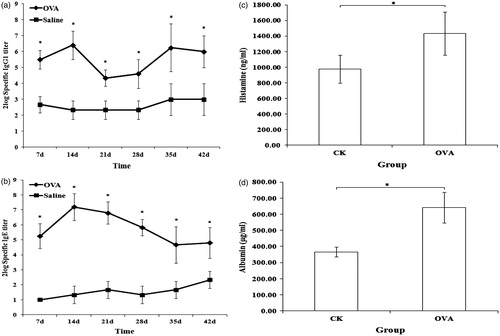
Balb/c mice were sensitized over 4 weeks by oral gavage. Because OVA is a model food allergen in rodent models, the results of the OVA and negative groups here were compared to assess the utility of the Balb/c model in this study. The results for the protein-specific IgG1 and IgE antibodies, levels of histamine, and vascular permeability are shown in . All the indices for mice in the OVA group were significantly higher than those in the negative controls. This outcome suggested that a T-helper (TH)-2 cellular response was induced in the OVA-sensitized mice.
Figure 3. Levels of specific antibodies, histamine, and vascular permeability for OVA-sensitized and negative control (CK; saline) mice. (a) Specific IgG1. (b) Specific IgE. (c) Histamine. (d) Vascular permeability. *Significant differences at p ≤ 0.05. There are significant differences in levels of specific antibodies, histamine, and vascular permeability between OVA-sensitized and CK mice. This indicated that the model could be used to distinguish allergen (OVA) from non-allergen (negative control).
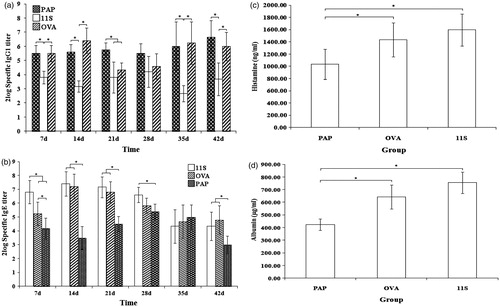
Other mice here were sensitized with one of three proteins (i.e. PAP, OVA, or 11S globulin) of different allergenicity to ascertain if the model could distinguish differing allergenicities of food proteins. There is little evidence that PAP exerts allergenicity, while OVA and 11S globulin are known food allergens. It was also seen here that it was apparently easier to develop oral tolerance against OVA in the mouse model than against the 11S globulin that had a strong allergenicity. The results here with respect to protein-specific IgE antibody levels (), histamine levels (), and vascular leakage () were in accordance with the known allergenicities of these three proteins (11S globulin > OVA > PAP). However, histamine levels for the OVA and 11S globulin mice did not significantly differ. In contrast, a strong response as reflected in increases in levels of PAP-specific IgG1 antibodies was evident ().
Figure 4. Levels of specific antibodies, histamine and vascular permeability for PAP-, OVA-, and 11S globulin-sensitized mice. (a) Specific IgG1. (b) Specific IgE. (c) Histamine. (d) Vascular permeability. The data show that levels of specific IgE, histamine, and vascular permeability in 11S globulin-sensitized mice were higher than in OVA- or PAP-sensitized mice. Levels of these indexes in OVA-sensitized mice were higher than in PAP-sensitized mice. Except for specific IgG antibody levels, the specific IgE, histamine, and vascular permeability outcomes were in accordance with the predicted allergenicity of these three proteins (11S globulin > OVA > PAP), indicating that this mouse model could distinguish allergens possessing different allergenicities. *Significant differences between bracketed values at p ≤ 0.05.
Food proteins from different allergen families induce different immune response patterns
On the basis of bioinformatic analysis, the 11S globulin, OVA, HAS, and LRP belonged to, respectively, the cupin superfamily, serpin serine protease inhibitor, serum albumins, and Bet v 1-related proteins. Cry 1Ab/Ac was not a potential food allergen according to these analyses.
The data here showed that 11S globulin had a strong allergenicity. High levels of 11S globulin-specific IgE and histamine were noted in the mice, and vascular leakage was also significantly increased up to Day 35 (), but decreased thereafter (). In contrast, the level of 11S globulin-specific IgG1 antibodies was relatively low, and no significant weekly differences were noted ().
Figure 5. Levels of specific antibodies, histamine and vascular permeability of 11S- globulin-, OVA-, HSA-, LRP-, and Cry 1Ab/Ac-sensitized mice. (a) Histamine. (b) Vascular permeability. (c) Specific IgG1. (d) Specific IgE. The results show that the allergenicities of 11S globulin and OVA were stronger than those of HSA, LRP, and Cry 1Ab/Ac. Further, the data show that these five food proteins induced different immune response patterns (that may be related to family-specific sequence conservation). *Significant differences between bracketed values at p ≤ 0.05.
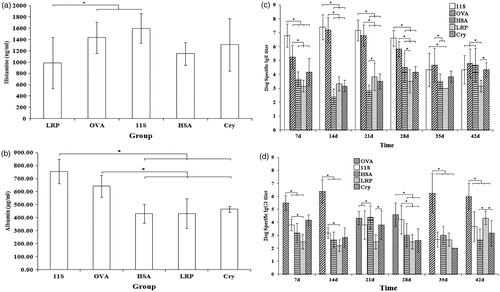
As an allergen that can induce oral tolerance easily, while OVA induced a strong specific IgG1 response, specific IgG1 levels were decreased at Days 21 and 28 (). The level of specific IgE was relatively lower than the 11S globulin group, and it declined from Day 28 (). Moreover, the level of histamine and vascular leakage in the OVA-sensitized mice increased significantly in this period ().
Compared with OVA and 11S globulin, relatively weak effects on histamine levels and vascular leakage were induced by the three exogenous proteins HSA, LRP, or Cry 1Ab/Ac (). The levels of LRP-specific IgG1 were higher than before at Day 42 (), but those of LRP-specific IgE were quite low; levels were not significantly different weekly (). A relatively weak specific IgG1 and IgE response was induced by HSA (). Levels of HSA-specific IgG1 reached a maximum at Day 21 (), whereas those of specific IgE increased from Day 28 (). The results for specific IgG1 and IgE antibodies with Cry 1Ab/Ac, as a non-allergenic exogenous protein, did not significantly differ week-to-week ().
Discussion
In this study, bioinformatics, simulated gastric digestion, and an animal model (Balb/c mouse) were employed to investigate different potential immune response patterns induced by food proteins from different allergen families. According to the results of the analyses of specific IgG1 and IgE antibody levels, histamine levels, and vascular permeability, a TH2 response was induced with the test food allergens. Moreover, three food proteins with different allergenicity (i.e. 11S globulin, OVA, PAP) were used to sensitize mice. Excluding for the protein-specific IgG1 antibody levels, the results seen regarding protein-specific IgE antibody levels, histamine levels, and changes in vascular permeability could be used to distinguish the potential allergenicities of these three food proteins (i.e. 11S globulin > OVA > PAP).
The Balb/c mouse model in our experiment was successful for illustrating that sensitizing mice by gavage (without adjuvant) could be a protocol used in the evaluation of the allergenicity of food proteins. Unfortunately, it was also seen that the use of measures of antigen-specific IgG1 was not appropriate for this model, as the results indicated that changes in the specific IgG1 titres was inversely related to the allergenicity of three test food proteins. Previous studies have shown that IgG1 antibodies can function as blocking reagents to inhibit IgE-mediated systemic anaphylaxis when antigen-specific IgE and IgG1 co-exist (Strait et al., 2006; Finkelman, Citation2007). Similarly, measures of body temperature were found not to be good markers for evaluating allergenicity; the lack of significant differences among the groups (data not shown) can also be explained by the above-noted reports.
It has been suggested that sequence comparisons of allergenic members of some protein families resulted in detection of a wide range of degrees of sequence conservation (Radauer et al., Citation2008). The high extent of IgE cross-reactivity noted within families might also reflect this conservation (Radauer et al., 2008). Based on these earlier reports, we hypothesized here that food proteins from different allergen families could induce different pattern of immune responses. Based upon bioinformatic analyses, five food proteins (e.g. 11S globulin, OVA, HSA, LRP, and Cry 1Ab/Ac) were used in the present study as they belonged to different allergen families (note: Cry 1Ab/Ac was deemed not a potential food allergen by the bioinformatic analysis). As hypothesized, the results here showed that mice sensitized by these five food proteins generated differing immune response patterns.
It was seen here that levels of specific IgG1 antibodies induced by OVA (from Serpin serine protease inhibitor group) underwent a downtrend at Days 21 and 28 in the study. Specific IgE antibodies declined from Day 28. In comparison, the 11S globulin (from Cupin super-family) induced only a low level of specific IgG1 but a strong IgE response, albeit that it declined from Day 35. The three other test exogenous proteins displayed weaker allergenicity than OVA and 11S globulin. Still, each induced different patterns of immune response also. LRP, which shares a homology with Gly m 4 (Bet v 1-related protein group), induced LRP-specific IgG1 antibodies all the way out until Day 42 of the study. HAS—which may belong to the serum albumin group based on the bioinformatic analysis—induced formation of HSA-specific IgG1 antibodies that reach a maximum at Day 21; levels of specific IgE increased from Day 28 onwards.
In conclusion, this study established that the Balb/c mouse could be a useful model for evaluating allergenicity of food proteins. In addition, the study demonstrated (in this model) that food proteins from different allergen families induce differing immune response patterns, and that these outcomes might be related to family-specific sequence conservation. More research concerning family-specific (re: allergen families and food proteins) patterns of immune response are clearly warranted.
Declaration of interest
The authors report no conflicts of interest. The authors alone are responsible for the content and writing of the paper.
This work was supported by a grant from the National Natural Sciences Foundation of China named ‘Research of animal models evaluation system on potential allergenicity’ (No. 81072305).
Acknowledgements
The authors wish to thank the Supervision, Inspection, and Testing Center of Genetically-Modified Organisms of the Ministry of Agriculture.
References
- Bowman, C. C., and Selgrade, M. K. 2008. Differences in allergenic potential of food extracts following oral exposure in mice reflect differences in digestibility: Potential approaches to safety assessment. Toxicol. Sci. 102:100–109
- Cao, S. S., Xu, W. T., Luo, Y. B., et al. 2009. Expression, purification, and re-folding of recombinant Cry1Ab/Ac obtained in Escherichia coli as inclusion. J. Sci. Food. Agr. 89:796–801
- Dunwell, J. M. 1998. Cupins: A new superfamily of functionally diverse proteins that include germins and plant storage proteins. Biotechnol. Genet. Eng. 15:1–32
- FAO/WHO. 2003. Codex alimentarius guideline for conduct of food safety assessment of foods derived from recombinant-DNA plants; Appendix IV: Annex on assessment of possible allergenicity. In: Joint FAO/WHO Food Standard Programme. (Commission, C.A., Ed.), Rome: Codex Alimentarius Commission, pp. 47–60
- Finkelman, F. D. 2007. Anaphylaxis: Lessons from mouse models. J. Allergy Clin. Immunol. 120:506–515
- Ivanciuc, O., Garcia, T., Torres, M., et al. 2009. Characteristic motifs for families of allergenic proteins. Mol. Immunol. 46:559–568
- Jenkins, J. A., Breiteneder, H., and Mills, E. N. 2007. Evolutionary distance from human homologs reflects allergenicity of animal food proteins. J. Allergy Clin. Immunol. 120:1399–1405
- Jenkins, J. A., Griffiths-Jones, S., Shewry, P. R., et al. 2005. Structural relatedness of plant food allergens with specific reference to cross-reactive allergens: An insilico analysis. J. Allergy Clin. Immunol. 115:163–170
- Mills, E. N., Jenkins, J. A., Alcocer, M. J., and Sherwry, P. R. 2004. Structural, biological and evolutionary relationships of plant food allergens sensitising via the gastrointestinal tract. Crit. Rev. Food. Sci. Nutr. 44:379–407
- Radauer, C., Bublin, M., Wagner, S., et al. 2008. Allergens are distributed into few protein families and possess a restricted number of biochemical functions. J. Allergy Clin. Immunol. 121:847–852
- Restani, P., Ballabio, C., Cattaneo, A., et al. 2004. Characterization of bovine serum albumin epitopes and their role in allergic reactions. Allergy 59:21–24
- Spitzauer, S. 1999. Allergy to mammalian proteins: At the borderline between foreign and self? Int. Arch. Allergy Immunol. 120:259–269
- Strait, R. T., Morris, S. C., and Finkelman, F. D. 2006. IgG-blocking antibodies inhibit IgE-mediated anaphylaxis in vivo through both antigen interception and FcγRIIb cross-linking. J. Clin. Invest. 116:833–841
- Sun, J. F., Arias, K., Alvarez, D., et al. 2007. Impact of CD40 ligand, B-cells, and mast cells in peanut-induced anaphylactic responses. J. Immunol. 179:6696–6703
- Sun, N., Zhou, C., Pu, Q. K., et al. 2013. Allergic reactions compared between BN rats and Wistar rats on oral exposure to ovalbumin. J. Immunotoxicol. 10:1–12
- Vieths, S., Scheurer, S., and Ballmer-Weber, B. 2002. Current understanding of cross-reactivity of food allergens and pollen. Ann. NY. Acad. Sci. 964:47–68
- Wang, J., and Sampson, H. A. 2011. Food allergy. J. Clin. Invest. 121:827–835
- Wen, J., Vanek-Krebitzb, M., Hoffmann-Sommergruberb, K., et al. 1997. The potential of Bet v 1 homologues, a nuclear multi-gene family, as phylogenetic markers in flowering plants. Mol. Phylogenet. Evol. 8:317–333