
Abstract
5-Fluorouracil (5-FU) is a widely used anti-cancer agent; however, it induces immunosuppression in patients undergoing a chemotherapy regime. The mode of action by which 5-FU induces immunosuppression is primarily via inhibition of hematopoietic growth factors. In the present study, immunoprotective effects of a semiquinone glucoside derivative (SQGD), a bacterial metabolite isolated from Bacillus sp. INM-1, were evaluated in a model of 5-FU-induced immunotoxicity in C57Bl/6 male mice. The evaluation was done by analyzing G-CSF, GM-CSF, and M-CSF expression in the serum, spleen, and bone marrow cells of the mice at different timepoints after 5-FU treatment. Mice received a single intraperitoneal injection of either 5-FU (75 mg/kg) alone, SQGD (50 mg/kg) alone, or SQGD 2 h prior to the 5-FU treatment. Control mice received saline vehicle only. The results demonstrated that 5-FU treatment significantly inhibited G-CSF, GM-CSF, and M-CSF expression in all three sites at all timepoints from 6–72 h post 5-FU. In SQGD treated mice, up-regulation of factor expression was observed in each compartment, and significantly so most often after 12 h. SQGD treatment prior to 5-FU administration to the mice significantly increased in all sites evaluated – relative to values in both control mice and 5-FU only-treated mice – G-CSF, M-CSF, and GM-CSF expression at almost every timepoint. The present findings suggest that SQGD provides protection against 5-FU-induced immunotoxicity in mice and could protect bone marrow progenitor cells against the effects of cytotoxic drugs used for treatment of cancer. The findings also suggested to us that SQGD is a potential immunomodulator and could protect hematopoiesis against toxic assault caused by anti-cancer drugs in the clinical setting.
Introduction
The hematopoietic system is highly sensitive to toxic chemicals and irradiation assaults. Chemotherapeutic anti-cancer drugs such as 5-fluorouracil (5-FU) intervene with proliferating cells of the hematopoietic system that lead to undesirable toxicity in the normal cells. 5-FU is considered as a S phase-active chemotherapeutic agent, with no activity in G0 or G1 cells (Shah & Schwartz, Citation2001). It is a well-established fact that 5-FU treatment of cells in the S phase causes DNA damage, specifically double-strand breaks, via mis-incorporation of FdUTP into newly-synthesized DNA strands (Curtin et al., Citation1991; Peters et al., Citation2000). Although 5-FU is an effective anti-cancer agent and is being used in a clinical setting, it induces substantial DNA damage in normal (non-cancerous) proliferating cells, particularly bone marrow stem cells, that ultimately leads to severe immunosuppression in patients. Despite a well-established efficacy against a variety of cancers, myelosuppression induced by 5-FU is a limiting factor in its wide clinical use (Chu, Citation2007). The overall quality-of-life in cancer patients undergoing 5-FU therapy is more often compromised due to a resulting severe immunosuppression (Raghavendran et al., Citation2012).
Stem cell growth factors, particularly Granulocyte Colony Stimulating Factor (G-CSF), Granulocyte Macrophage Colony Stimulating Factor (GM-CSF), and Macrophage Colony Stimulating Factor (M-CSF), are integral parts of normal myelopoiesis. G-CSF is known to accelerate and regulate neutrophil production in bone marrow and ensure their delivery into the general circulation (Shochat et al., Citation2007; Singh et al., Citation2012). Induction of neutropenia in cancer patients undergoing 5-FU treatment primarily is a result of G-CSF inhibition (Longley et al., Citation2003). Therefore, modulation of G-CSF expression using prophylactic interventions in 5-FU-treated mice was a main objective of the present study. 5-FU has an inhibitory effect on erythopoiesis and myelopoiesis (Takano et al., Citation2009). M-CSF regulates proliferation and survival of monocyte/macrophage lineages and plays a major regulatory role in the development and maintenance of mononuclear phagocytes in the liver and spleen (Baker & Levin, Citation1998; Ralph & Sampson-Johannes, Citation1990; Roth & Stanley, Citation1992; Stanley et al., Citation1983). GM-CSF is an immunoregulatory factor secreted by a variety of cells including macrophages, endothelialcells, and epithelial cells (Paine et al., Citation2000). It is responsible for the survival, proliferation, differentiation, and function of myeloid cells (Lendemans et al., Citation2006). GM-CSF is closely involved in hematopoiesis, in combination with interleukin (IL)-3. As a chemical stress inducer, 5-FU terminates GM-CSF synthesis, as it inhibits hematopoiesis in the bone marrow (Disis et al., Citation1996; Raghavendran et al., Citation2012).
Semiquinone glucoside derivative (SQGD), isolated from a radio-resistant bacterium Bacillus sp. INM-1 (Kumar et al., Citation2011a,Citationb), was used as a chemoprotective agent in the present investigation. SQGD has already been characterized and evaluated for its anti-oxidant, immunostimulatory, and radioprotective activities (Kumar et al., Citation2011a,Citationb; Patel et al., Citation2012a,Citationb; Mishra et al., 2013a,b). SQGD has potent protecive activities against γ radiation-induced damage as it is known to protect the gastrointestinal and reproductive systems and is known to modulate imunostimulatory cytokines (Mishra et al., Citation2013a,Citationb; Patel et al., Citation2012a,Citationb). The present study was focused on determination of the potential of SQGD to overcome 5-FU-induced immunotoxicity in terms of G-CSF, M-CSF, and GM-CSF expression in the serum, spleen, and bone marrow of mice. It was anticipated that any findings of amelioration of 5-FU-induced toxicity could potentially benefit immunocompromised cancer patients undergoing chemotherapy.
Materials and methods
5-Fluorouracil (5-FU), ammonium chloride, EDTA, EGTA, Triton X-100, Tris-HCl, and NP-40 were purchased from Calbiochem (Darmstadt, Germany). ELISA kits for analyses of G-CSF and GM-CSF were procured from Ray-Biotech (Norcross, GA). The kit for analysis of M-CSF was bought from Cusabio (Hubei, China).
Semiquinone glucoside derivative (SQGD), a bacterial metabolite, was isolated from radio-resistant Bacillus sp INM-1 using solvent fractionation and extraction procedures (i.e. column chomatography, UV-VIS, fluorescence, FTIR, H-NMR, LC-MS, and electron paramagnetic resonance [EPR] spectroscopy) as described in Kumar et al. (Citation2011a).
Animals
Male C57Bl/6 mice (6–8-weeks-old, 28 [±3] g) were selected from an inbred colony at the animal breeding facility of our Institute and maintained under conditions of 28 °C, 55% relative humidity, and a 12-h light:dark cycle. All mice had ad libitum access to sterile water and food (Golden Feeds, Delhi, India). Mice were housed in polypropylene cages containing sterile paddy husk as bedding throughout the experiment. All mice were acclimated for 1 week prior to initiating treatments. All rules and regulations of the Institutional Animal Ethics Committee (IAEC) were strictly followed during experimentation.
Treatment regimens
At the beginning of the experiment, a total of 96 mice were randomly allocated into four groups (n = 6 mice per treatment group for each timepoint) that, in turn, received the following treatments by intraperitoneal (IP) injection (0.2 ml volume):
Group 1: phosphate-buffered saline (PBS, pH 7.4) (control);
Group 2: 5-FU (75 mg/kg body weight [BW]);
Group 3: SQGD (50 mg/kg); or
Group 4: SQGD 2 h before 5-FU.
At different times (6–72 h) post-treatment, subsets of mice were euthanized by cervical dislocation. At necropsy, the spleen, bone marrow, and blood were collected and processed for analyses.
Serum, spleen, and bone marrow single cell preparation
Blood samples were collected from the mice via the retro-orbital plexus (Hoff, Citation2000). The collected sample was incubated for 30 min at room temperature and then centrifuged at 2500 × g. The resultant serum was collected and placed at −20 °C until used.
Each spleen collected at necropsy was processed using a frosted slide and a cell strainer (70 µm, BD Falcon, Franklin Lakes, NJ) to yield single cell suspensions. The cell suspension was then centrifuged at 4000 × g and the resultant cell pellet washed with sterile PBS before being stored at 4 °C. Bone marrow cell suspensions were prepared from the excised femurs collected at necropsy by flushing the marrow with sterile PBS. The flushed material was collected in sterile 1.5 ml tubes and stored at 4 °C.
Preparation of cell lysates
Cell suspensions prepared from the spleens and bone marrow cells were centrifuged at 4000 × g at 4 °C. Each cell pellet obtained was treated with RBC lysis buffer (NH4Cl [0.82% w/v], 0.1% KHCO3 and 3.6% EDTA in water) and incubated for 10 min at 37 °C with mild shaking. The mixture was then centrifuged at 4000 × g and the cell pellets obtained washed with 1 ml PBS. The cell pellet was then treated with cell lysis buffer (1% Triton X-100, 10 mM Tris-HCl, 150 mMNaCl, 0.5% NP-40, 1 mM EDTA, 0.2% EGTA) supplemented with protease inhibitors. Cells were then incubated in ice for 30 min before being centrifuged at 10 000 × g for 30 min at 4 °C. Each sample supernatant was collected and processed for analyses of G-CSF, M-CSF and GM-CSF content.
G-CSF, GM-CSF, M-CSF expression analysis
G-CSF and GM-CSF levels in serum, spleen and bone marrow were analyzed using Ray-Biotech (ELM-GCSF001) and (ELM-GMCSF-001) ELISA kits and following manufacturer instructions. Levels of M-CSF in each site were analyzed using a Cusabio (CSB-E046559) ELISA kit. Quantitative estimation of the expression of each factor was carried out by extrapolation from a standard curve prepared in parallel using kit-supplied standard. The level of sensitivity of each kit was 31 pg analyte/ml.
Statistical analyses
Each experiment was repeated three times and the continuous data obtained expressed as mean ± SD. Significant variation between treatment groups was determined by one-way analysis of variance (ANOVA), followed by a Bonferroni test; p values < 0.05 were considered significant.
Results
Effects of SQGD and/or 5-FU treatments on G-CSF expression in serum
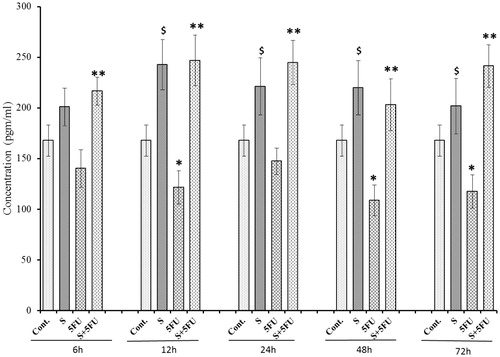
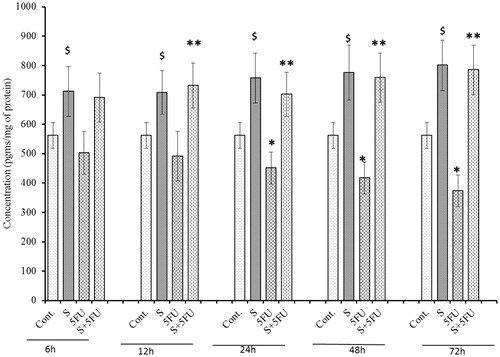
The results clearly demonstrate immunosuppressive effects of 5-FU in mice, i.e. there was a significant down-regulation in serum levels of G-CSF (compared to values in untreated control mice) beginning at 12 h post-treatment with 5-FU-treated mice; the value at 24 h post-treatment barely missed statistical significance (). In contrast, G-CSF expression in the serum of mice treated with SQGD alone was enhanced at all timepoints after 6 h. Maximum G-CSF expression in SQGD treated mice was achieved at 12 h (242.74 [±28.11] pg/ml). SQGD pre-treatment before dosing with 5-FU was found to increase G-CSF levels compared to those seen in mice that received 5-FU only, at all test timepoints. Maximum (∼2-fold) recovery in G-CSF expression was observed at 12 h for the co-treated mice [246.93 (±25.11) pg/ml] vs the 5-FU only-treated mice [121.46 (±16.30) pg/ml]. Consistently, G-CSF levels in the co-treated mice were on par with those of mice that received SQGD alone. Accordingly, values for the co-treated mice in all cases were higher than those in the sera of the untreated control mice.
Figure 1. Effect of SQGD and/or 5-FU treatment on G-CSF expression in serum. Mice were treated with SQGD and/or 5-FU and blood samples were collected at different timepoints for subsequent analysis. C, Control; S, SQGD-treated mice; 5-FU, 5-FU only-treated mice; S + 5FU, Mice pre-treated with SQGD 2 h before 5-FU treatment. All values shown are mean ± SD (n = 6 mice/treatment group for each timepoint). Values significantly different: $p < 0.05, SQGD versus control;*p < 0.05, 5-FU only versus control; **p < 0.05, SQGD + 5-FU versus 5-FU only.
Effects of treatments on GM-CSF expression in serum
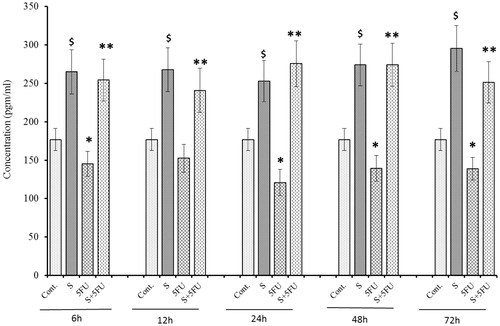
Compared to control mouse values, serum GM-CSF levels were significantly decreased at all timepoints (except 12 h) in mice treated with 5-FU alone (). On the other hand, SQGD only treatment led to consistently-increased GM-CSF levels compared to controls. Maximum serum GM-CSF in the SQGD only-treated mice was seen at the 72 h post-treatment timepoint [295.29 (±26.78) pg/ml]. Pre-treatment with SQGD completely abrogated any 5-FU-induced inhibition of GM-CSF expression, at all timepoints. As with the G-CSF results, serum GM-CSF levels in the co-treated mice were consistently on par with those of mice that received SQGD alone. Further comparisons revealed that, at all timepoints, serum levels of GM-CSF in the co-treated mice were higher compared to those in the sera of untreated control mice.
Figure 2. Influence of SQGD on 5-FU-mediated inhibition in serum GM-CSF expression. C, Control; S, SQGD-treated mice; 5-FU, 5-FU only-treated mice; S + 5FU, Mice pre-treated with SQGD 2 h before 5-FU treatment. All values shown are mean ± SD (n = 6 mice/treatment group for each timepoint). Values significantly different: $p < 0.05, SQGD versus control; *p < 0.05, 5-FU versus control; **p < 0.05, SQGD + 5-FU versus 5-FU only.
Effects of treatments on M-CSF expression in serum
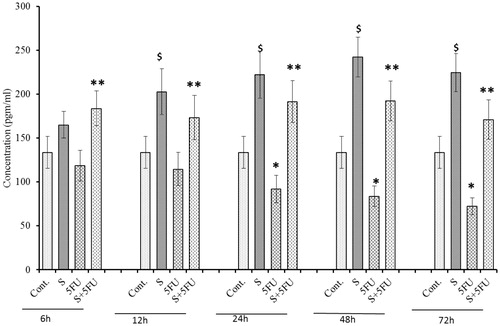
A time-related decrease in serum M-CSF levels (relative to control mice levels) was noticed beginning at 24 h post-treatment in mice treated with 5-FU only (). In contrast, a significant induction in M-CSF expression was seen in the SQGD-treated mice compared to untreated controls at all timepoints (except for 6 h). Maximum expression of M-CSF in these mice was at the 48 h timepoint [242.30 (±22.68) pgm/ml]. Pre-treatment with SQGD led to significantly higher serum levels of M-CSF than those seen in the mice that received the 5-FU alone, at all timepoints. More often than not, levels in the co-treated mice were on par (except at 72 h post-exposure) with those of mice that received the SQGD alone.
Figure 3. Analysis of M-CSF expression in serum of mice treated with SQGD and/or 5-FU. C, Control; S, SQGD-treated mice; 5-FU, 5-FU only-treated mice; S + 5FU, Mice pre-treated with SQGD 2 h before 5-FU treatment. All values shown are mean ± SD (n = 6 mice/treatment group for each time-point). Values significantly different: $p < 0.05, SQGD versus control; *p < 0.05, 5-FU only versus control; **p < 0.05, SQGD + 5-FU versus 5-FU only.
Effects of treatments on G-CSF expression in the spleen
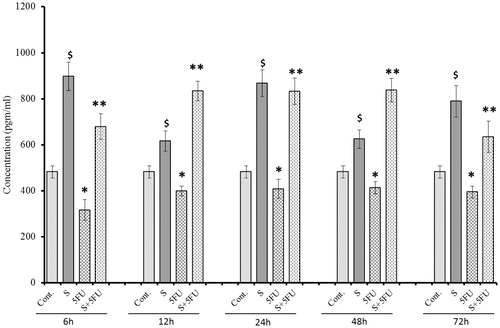
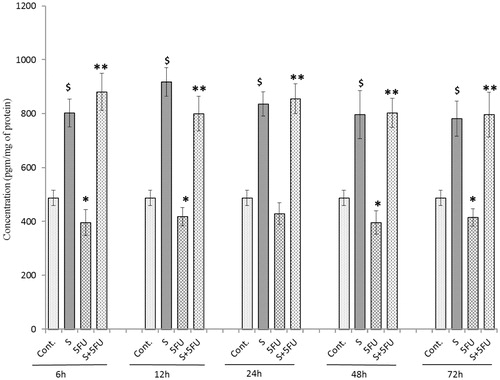
In comparison to values seen in control counterpart tissues, there was a significant reduction in G-CSF expression in the spleens of mice treated with 5-FU alone beginning at 6 h post-treatment and thereafter (). In contrast, compared to control values, there was a significant induction of G-CSF noted in the spleens of all mice treated with SQGD. The maximum G-CSF expression in this group (at 6 h timepoint) was 897.34 (±61.88) pg/ml. Unlike the observations for serum, there was no consistent pattern of G-CSF expression in the spleens of the SQGD-only treated mice over the entire post-treatment timeframe. At all timepoints, it was also clear that SQGD pre-treatment appeared to block the inhibitory effect of 5-FU on G-CSF expression. Again, unlike with the serum values, levels in the co-treated mice were rarely on par – sometimes less or sometimes greater – with those of mice that received the SQGD alone. Accordingly, values for the co-treated mice in all cases were higher than those in the organs of the untreated control mice.
Figure 4. Effect of SQGD and/or 5-FU treatment on G-CSF expression in the spleen. Mice were treated with SQGD and/or 5-FU and spleen samples were then collected at different timepoints and processed for analysis. C, Control; S, SQGD-treated mice; 5-FU, 5-FU treated mice; S + 5FU, Mice pre-treated with SQGD 2 h before 5-FU treatment. All values shown are mean ± SD (n = 6 mice/treatment group for each timepoint). Values significantly different: $p < 0.05, SQGD versus control; *p < 0.05, 5-FU only versus control; **p < 0.05, SQGD + 5-FU versus 5-FU only.
Effects of treatments on GM-CSF expression in the spleen
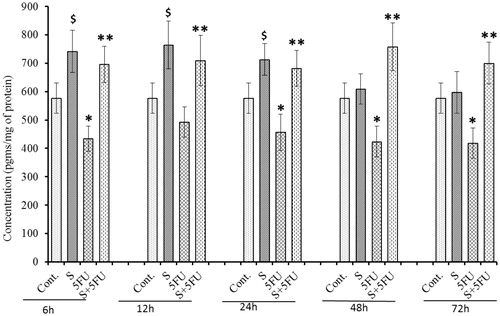
A single treatment with 5-FU significantly reduced splenic GM-CSF levels at all timepoints (except 24 h) compared to values in the organs of the untreated control mice (). In comparison, GM-CSF expression was found to have increased over the entire 6–72 h post-exposure period in spleens of mice administered SQGD only, compared to controls. Maximum expression of GM-CSF in the spleens of these mice was noted at 12 h [917.69 (±53.75) pg/ml]. At all timepoints, it was also clear that SQGD pre-treatment resulted in significantly higher splenic GM-CSF expression relative to values seen in the organs of mice that received 5-FU alone. Unlike with the splenic G-CSF values, levels in the co-treated mice were consistently equivalent to those of mice that received the SQGD alone and thus were higher than those in the organs of untreated control mice as well.
Figure 5. Influence of SQGD on 5-FU-mediated modulation of GM-CSF expression in spleen. C, Control; S, SQGD-treated mice; 5-FU, 5-FU only-treated mice; S + 5FU, Mice pre-treated with SQGD 2 h before 5-FU treatment. All values shown are mean ± SD (n = 6 mice/treatment group for each timepoint). Values significantly different: $p < 0.05, SQGD versus control; *p < 0.05, 5-FU versus control; **p < 0.05, SQGD + 5-FU versus 5-FU only.
Effects of treatments on M-CSF expression in the spleen
At all test timepoints (except 12 h), M-CSF expression was significantly inhibited in the spleens of the mice by 5-FU (compared to in organs of untreated control mice) (). SQGD alone led to a significant increase in M-CSF expression in the period from 6–24 h post-treatment, but normalized to control levels from 48 h onward. As with all the other endpoints thus far, in the mice that received SQGD prior to 5-FU, there was a significant increase in M-CSF expression at all timepoints compared to the values seen in the organs of the 5-FU only-treated mice. Maximum M-CSF expression in the co-treated mice was observed at 48 h [757.48 (±84.05) pg/ml]. Unlike for the SQGD-only mice, the co-treatment mice values were consistently elevated relative to control mice values across the entire post-exposure timeframe analyzed.
Figure 6. Analysis of M-CSF expression in the spleen of mice treated with SQGD and/or 5-FU. C, Control; S, SQGD-treated mice; 5-FU, 5-FU only-treated mice; S + 5FU, Mice pre-treated with SQGD 2 h before 5-FU treatment. All values shown are mean ± SD (n = 6 mice/treatment group for each timepoint). Values significantly different: $p < 0.05, SQGD versus control; *p < 0.05, 5-FU-only versus control; **p < 0.05, SQGD + 5-FU versus 5-FU only.
Effects of treatments on G-CSF expression in bone marrow cells
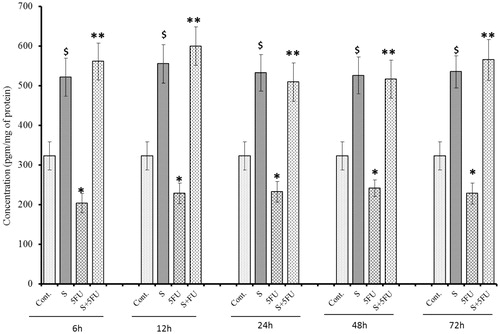
Like the findings with serum and spleen, significant reductions in G-CSF expression over the entire post-treatment timeframe was noted with bone marrow cells in 5-FU only-treated mice, compared to in cells from control mice (). On the other hand, significant induction in bone marrow cell G-CSF expression was observed in all mice treated with SQGD – at all post-treatment timepoints – compared to values with control mice cells. Once again, in mice that received SQGD prior to 5-FU, there was uniform significant increases in bone marrow cell G-CSF expression relative to that noted in cells from the mice that received 5-FU only. Maximum GM-CSF levels in the cells was seen at 12 h [599.90 9±48.65) pg/ml] post-exposure in the co-treated mice. As with many of the other endpoints described above, the co-treatment mice values were consistently elevated relative to control mice values across the entire post-exposure timeframe analyzed, and also on par with those of the mice that received SQDS only.
Figure 7. Effect of SQGD and/or 5-FU treatment on bone marrow cell G-CSF expression. Mice were treated with SQGD and/or 5-FU and bone marrow cells were then collected at different timepoint for analysis. C, Control; S, SQGD-treated mice; 5-FU, 5-FU only treated mice; S + 5FU, Mice pre-treated with SQGD 2 h before 5-FU treatment. All values shown are mean ± SD (n = 6 mice/treatment group for each timepoint). Values significantly different: $p < 0.05 SQGD versus control; *p < 0.05, 5-FU-only versus control, **p < 0.05, SQGD + 5-FU versus 5-FU only.
Effects of treatments on GM-CSF expression in bone marrow cells
Significant reductions (compared to untreated control mouse cell values) in GM-CSF expression was observed in bone marrow cells of mice treated with 5-FU only beginning at 24 h post-treatment (). On the other hand, SQGD treatment alone caused significant induction of GM-CSF expression (at all timepoints). Pre-treatment with SQGD blocked any 5-FU-induced effect, at all test timepoints. The data also show that bone marrow cell GM-CSF levels in the co-treated mice were consistently equivalent with those of mice that received SQGD alone and, thus, also higher than those in cells of the untreated control mice.
Figure 8. Influence of SQGD on 5-FU-mediated modulation of bone marrow cell GM-CSF expression. C, Control; S, SQGD-treated mice; 5-FU, 5-FU only-treated mice; S + 5FU, Mice pre-treated with SQGD 2 h before 5-FU treatment. All values shown are mean ± SD (n = 6 mice/treatment group for each timepoint). Values significantly different: $p < 0.05, SQGD versus control; *p < 0.05, 5-FU only versus control; **p < 0.05, SQGD + 5-FU versus 5-FU only.
Effects of treatments on M-CSF expression in bone marrow cells
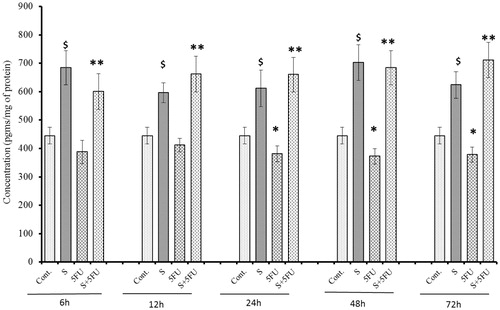
A signficant negative impact of 5-FU treatment on M-CSF expression in the bone marrow cells was seen in mice treated with 5-FU, but only beginning at 24 h post-treatment (). In contrast, significant induction in M-CSF expression was observed in all SQGD only-treated mice at all test timepoints. Maximum induction of M-CSF expression was observed at the 72 h post-treatment timepoint [785.39 (±84.23) pg/ml]. As before, it was evident that SQGD pre-treatment abrogated toxic effects of 5-FU in the bone marrow cells of mice, at all test timepoints. The data also show that bone marrow cell M-CSF levels in these co-treated mice were consistently on par with those of mice that received SQGD alone and, thus, also higher than those in cells of the untreated control mice.
Figure 9. Analysis of M-CSF expression in bone marrow cells of mice treated with SQGD and/or 5-FU. C, Control; S, SQGD-treated mice; 5-FU, 5-FU-only treated mice; S + 5FU, Mice pre-treated with SQGD 2 h before 5-FU treatment. All values shown are mean ± SD (n = 6 mice/treatment group for each timepoint). Values significantly different: $p < 0.05, SQGD vs control; *p < 0.05, 5-FU only vs control; **p < 0.05, SQGD + 5-FU vs 5-FU only.
Discussion
5-Fluorouracil (5-FU) is one of several chemotherapeutic agents used alone and in combination with radiotherapy to treat cancer. Although 5-FU has excellent therapeutic efficacy associated immunosuppressive side-effects are considered a limiting factor against its wide application. Chemotherapy with 5-FU alone or in combination with radiotherapy has been shown to directly damage rapidly-growing and dividing hematopoietic progenitor cells (Kaushansky, Citation1998). In particular, 5-FU induces myelosuppresion by inhibiting expression of regulators of myelopoeisis (i.e. G-CSF, GM-CSF, and M-CSF) in bone marrow progenitors (Raghavendran et al., Citation2012). Thus, the current study was undertaken to investigate if 5-FU-induced inhibition of myeloid regulators in hematopoietic organs (i.e. spleen and bone marrow) could be modulated by pre-treatment with SQGD, a semiquinone glucoside derivative isolated from Bacillus sp. INM-1.
G-CSF is known to activate several signaling pathways including pro-survival, proliferation, differentiation, and mobilization of stem and progenitor cells from the bone marrow to the spleen and then subsequently to the bloodstream (Singh et al., Citation2011). Here, a significant diminution in G-CSF presence was observed in the serum, spleen, and bone marrow cells of the mice administered with 5-FU (, , and ). This would be in accordance with the fact that 5-FU effectively blocks proliferative responses among the primary bone marrow progenitors involved in haematopoiesis (Matrosova et al., Citation2004). As the result of G-CSF depletion, the ability of bone marrow to regenerate white blood cells is strongly compromised (Dolan et al., Citation2005). It is important to note that recovery of G-CSF was noted in all the compartments of mice administered with SQGD 2 h before 5-FU treatment. Earlier studies revealed that induction of the pro-survival factor NF-κB led to enhanced G-CSF expression (Chang et al., Citation1995). Our previous findings also showed that SQGD treatment enhanced Rel A (p65 component of activated NF-κB) expression in human PBMC (Kumar et al., Citation2011b). Therefore, present findings could help us to establish a direct link between SQGD-mediated G-CSF induction and subsequently NF-κB activation. Other reports demonstrated that G-CSF could interact with interleukin (IL)-6 to accelerate multi-lineage recovery (Pathchen et al., Citation1993) and provide further support for the present findings. Thus, as a G-CSF stimulator, SQGD may perform diverse functions and provide protection against 5-FU-induced toxicity to the blood or immune system in situ.
As bone marrow is the prime site of hematopoietic recovery following damage from 5-FU or γ-irradiation in cancer patients (Agool et al., Citation2011), SQGD was also evaluated for its possible role in accelerating endogenous hematopoietic growth factor expression among bone marrow cells of 5-FU-treated mice. GM-CSF can stimulate proliferation of various hematopoietic cells such as macrophages, granulocytes, and endothelial cells (Kojima et al., Citation2011; Singh & Yadav, Citation2005). As an immunosuppressant, 5-FU inhibits regeneration of bone marrow cells, resulting in a severe deficiency in the formation of erythoid, monocytes, megakaryocytes, and many other immune cells by a down-regulation of GM-CSF (Rich, Citation1991). In agreement with several previous studies, GM-CSF expression among marrow cells, spleen, and serum was significantly reduced in 5-FU-treated mice (, , and ). SQGD was found to be instrumental in abrogating 5-FU-induced GM-CSF down-regulation. One could surmise that SQGD might have induced cytoprotective proliferative signals via GM-CSF induction and, thus, would potentially augment immune responses in 5-FU-only-treated mice. Such an outcome would be in line with the fact that GM-CSF induction leads to increases in IL-6, IL-3, IL-1, and stem cell factor expression, each of which are an integral part and help in expansion of early hematopoietic lineages (Raghavendran et al., Citation2012). Thus, by protecting against 5-FU-induced suppression of GM-CSF, SQGD may also provide protection to overall hematopoietic processes in a 5-FU-treated host.
In addition, 5-FU can exert deleterious effects by suppressing platelet levels and decreasing megakaryocyte and macrophage numbers in a treated host (Peters et al., Citation2000). The present study revealed significant induction in M-CSF levels in the serum, spleen, and bone marrow cells of mice pre-treated with SQGD prior to 5-FU treatment (, , and ). M-CSF stimulates phagocytic and chemotactic activities resulting in an increase in anti-tumor cell cytotoxicity and increased formation/release of inflammatory cytokines (Nemunaitis, Citation1993). Hence, as a ‘potent’ M-CSF inducer, SQGD could exert immunostimulatory effects.
Conclusion
In the present investigation in C57Bl/6 mice, we clearly demonstrated that semiquinone glucoside (SQGD) provided protection against 5-FU-induced immunosuppression in treated mice. Enhancement of hematopoietic growth factors closely associated with bone marrow recovery and haematopoiesis was evident with the SQGD alone as well. Further, studies are needed to better understand the mechanisms of action responsible for the observed effects of SQGD in normal as well as in immunocompromised models
Declaration of interest
The authors report no conflict of interest. The authors alone are responsible for the content and writing of the paper.
Acknowledgements
The authors would like to acknowledge the Defence Research and Development Organization for providing financial support for the present study (Project #1.3 of ST-P1, INM-311), as well as for the awarding of a Senior Research Fellowship.
References
- Agool, A., Slart, R. H., Thorp, K. K., et al. (2011). Effect of radiotherapy and chemotherapy on bone marrow activity: A [18F]-FLT-PET study. Nuclear Med. Commun. 32:17–22
- Baker, G. R., and Levin, J. (1998). Transient thombocytopenia produced by administration of macrophage-colony stimulating factor: Investigations of the mechanism. Blood 91:89–99
- Chang, C. M., Limanni, A., Baker, W. H., et al. (1995). Bone marrow and splenic granulocyte-macrophage-colony stimulating factor and transforming growth factor-β mRNA levels in irradiated Mice. Blood 86:2130–2136
- Chu, E. (2007). Ode to 5-Fluorouracil. Clin. Colorec. Cancer 6:609
- Curtin, N. J., Harris, A. L., and Aherne, G. W. (1991). Mechanism of cell death following thymidylate synthase inhibition: 2′-Deoxyuridine-5′-triphosphate accumulation, DNA damage, and growth inhibition following exposure to CB3717 and dipyridamole. Cancer Res. 51:2346–2352
- Disis, M. L., Bernhard, H., Shiota, F. M., et al. (1996). Granulocyte-macrophage-colony stimulating factor: An effective adjuvant for protein- and peptide-based vaccine. Blood 1:202–210
- Dolan, S., Crombez, P., and Munoz, M. (2005). Neutropenia management with granulocyte colony stimulating factor: From guideline to nursing practice protocols. Eur. J. Oncol. Nurs. 9:14–23
- Hoff, J. (2000). Methods of blood collection in the mouse. Lab. Anim. 29:47–53
- Kaushansky, K. (1998). Thombopoietin and hematopoetic stem cell. Blood 92:1–3
- Kojima, H., Otani, A., Oishi, A., et al. (2011). Granulocyte-colony stimulating factor attenuates oxidative stress-induced apoptosis in vascular endothelial cells and exhibits functional and morphological protective effect in oxygen-induced retinopathy. Blood 117:1091–1100
- Kumar, R., Bansal, D. D., Patel, D. D., et al. (2011a). Anti-oxidative and radioprotective activities of semiquinone glucoside derivative (SQGD) isolated from Bacillus sp. INM-1. Mol. Cell. Biochem. 349:57–67
- Kumar, R., Sharma, R. K., Bansal, D. D., et al. (2011b). Induction of immunostimulatory cytokine genes expression in human PBMC by a novel semiquinone glucoside derivative (SQGD) isolated from a Bacillus sp. INM-1. Cell. Immunol. 267:67–75
- Lendemans, S., Rani, M., Selbach, C., et al. (2006). GM-CSF priming of human monocytes is dependent on ERK1/2 activation. J. Endotoxin. Res. 12:10–20
- Longley, D. B., Harkin, D. P., and Johnston, P. G. (2003). 5-Fluorouracil: Mechanisms of action and clinical strategies. Nat. Rev. Cancer 3:330–338
- Matrosova, V. Y., Orlovskaya, I. A., Serobyan, N., and Khaldoyanidi, S. K. (2004). Hyaluronic acid facilitates the recovery of hematopoiesis following 5-FU administration. Stem Cells 22:544–555
- Mishra, S., Bansal, D. D., Malhotra, P. K., et al. (2013a). Semiquinone fraction isolated from Bacillus sp. INM-1 protects hepatic tissues against γ-radiation induced toxicity. Environ. Toxicol. 2013. (Epub ahead of print)
- Mishra, S., Reddy, D. S., Jamwal, V. S., et al. (2013b). Semiquinone derivative isolated from Bacillus sp. INM-1 protects cellular anti-oxidant enzymes from γ-radiation-induced renal toxicity. Mol. Cell. Biochem. 379:19–27
- Nemunaitis, J. (1993). Macrophage function activating cytokines: Potential clinical application. Crit. Rev. Oncol. Hematol. 14:153–171
- Paine, R. 3rd, Preston, A. M., Wilcoxen, S., et al. (2000). Granulocyte macrophage colony-stimulating factor in the innate immune response to Pneumocystis carinii pneumonia in mice. J. Immunol. 64:2602–2609
- Patel, D. D., Bansal, D. D., Mishra, S., et al. (2012a). Radioprotection to small intestine of the mice against ionizing radiation by semiquinone glucoside derivative (SQGD) isolated from Bacillus sp. INM-1. Mol. Cell. Biochem. 370:115–125
- Patel, D. D., Bansal, D. D., Mishra, S., et al. (2012b). A semiquinone glucoside derivative provides protection to male reproductive system of the mice against γ-radiation toxicity. Environ. Toxicol. 2013. (Epub ahead of print)
- Pathchen, M. L., Fischer, R., and MacVittie, T. J. (1993). Effects of combined administration of IL-6 and granulocyte-colony stimulating factor on recovery from radiation-induced hemopoetic aplasia. Exp. Hematol. 21:338–344
- Peters, G. J., van Triest, B., Backus, H. H., et al. (2000). Molecular downstream events and induction of thymidylate synthase in mutant and wild-type p53 colon cancer cell lines after treatment with 5-fluorouracil and the thymidylate synthase inhibitor raltitrexed. Eur. J. Cancer 36:916–924
- Raghavendran, H. R., Sathyanath, R., Shin, J., et al. (2012). Panax ginseng modulates cytokines in bone marrow toxicity and myelopoiesis: Ginsenoside Rg1 partially supports myelopoesis. PLOS One 7:e33733
- Ralph, P., and Sampson-Johannes, A. (1990). Macrophage growth and stimulating factor, M-CSF. Prog. Clin. Biol. Res. 339:43–63
- Rich, I. N. (1991). The effect of 5-fluorouracil on erythopoiesis. Blood 77:1164–1170
- Roth, P., and Stanley, E. R. (1992). The biology of CSF-1 and its receptor. Curr. Top. Microb. Immunol. 181:141–167
- Shah, M. A., and Schwartz, G. K. (2001). Cell cycle-mediated drug resistance: An emerging concept in cancer therapy. Clin. Cancer Res. 7:2168–2181
- Shochat, E., Rom-Kedar, V., and Segel, L. A. (2007). G-CSF controls of neutrophil dynamics in blood. Bull. Math. Biol. 69:2299–2338
- Singh, P. K., Wise, S. Y., Ducey, E. J., et al. (2011). Radioprotective efficacy of tocopherol succinate is mediated though granulocyte-colony stimulating factor. Cytokines 56:411–421
- Singh, V. K., and Yadav, V. S. (2005). Role of cytokines and growth factor in radioprotection. Exp. Mol. Pathol. 78:156–169
- Singh, V. K., Fatanmi, O. O., Singh, P. K., and Whitnall, M. H. (2012). Role of radiation-induced granulocyte colony-stimulating factor in recovery from whole body γ-irradiation. Cytokines 58:406–414
- Stanley, E. R., Guilbert, L. J., Tushinski, R. J., and Bartelmez, S. H. (1983). CSF-1 - a mono-nuclear phagogyte lineage-specific hemopoetic growth factor. J. Cell. Biochem. 21:151–159
- Takano, F., Ohta, Y., Tanaka, T., et al. (2009). Oral administration of Ren-Shen-Yang-Rong-Tang ‘Ninjin’yoeito’ protects against hematotoxicity and induces immature erythoid progenitor cells in 5-FU-induced anemia. Evid.-Based Complement. Alt. Med. 6:247–256